facilities such as nuclear power plants with different smoking habits -Critical analysis of the Radiation Effects Association’s recent Report- Nagai koko NPO Citizen's Science Initiative Japan [email protected]
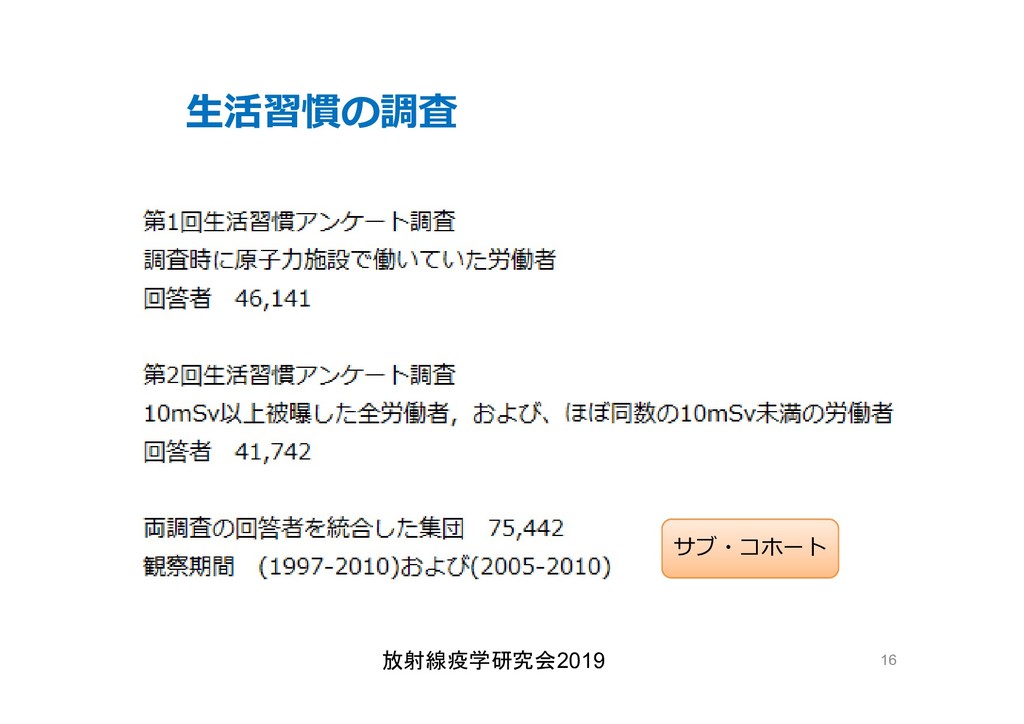
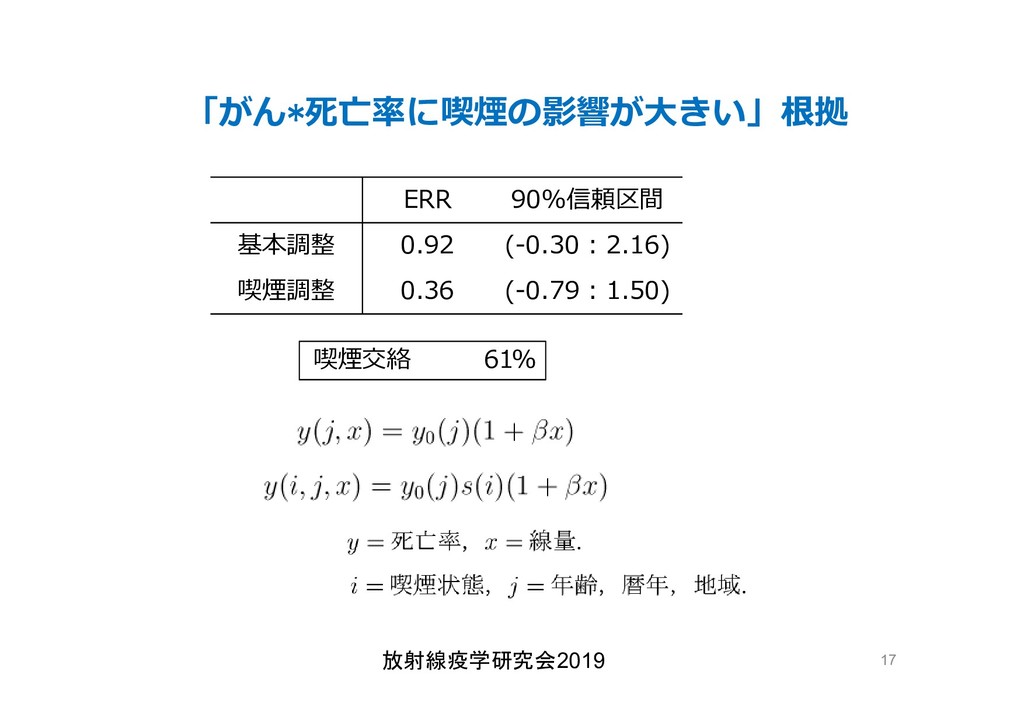
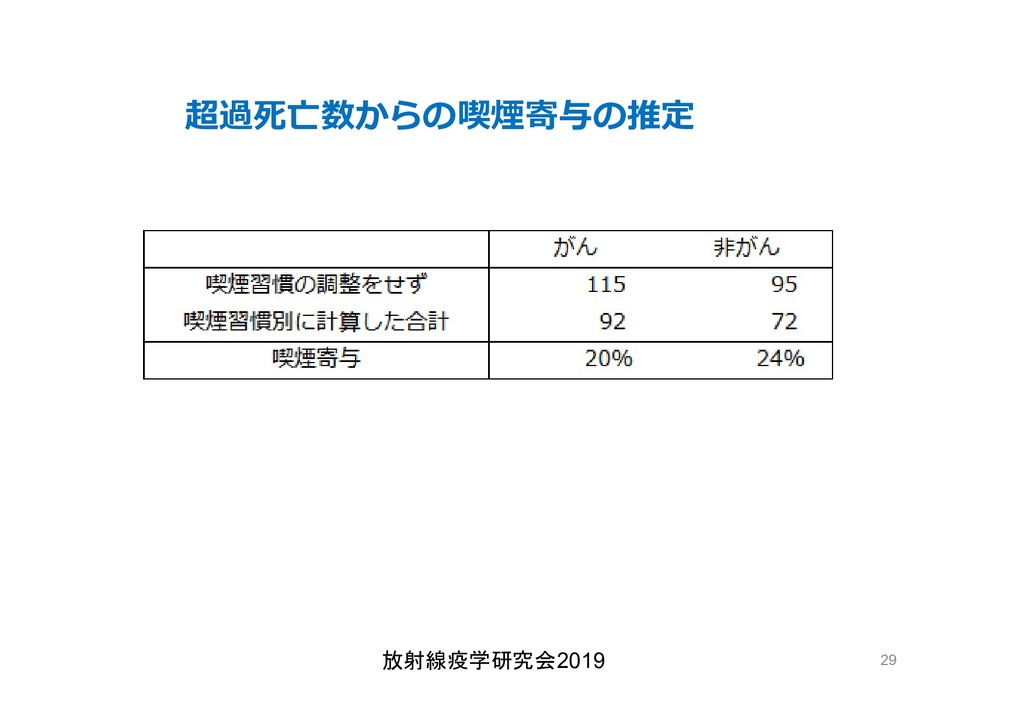
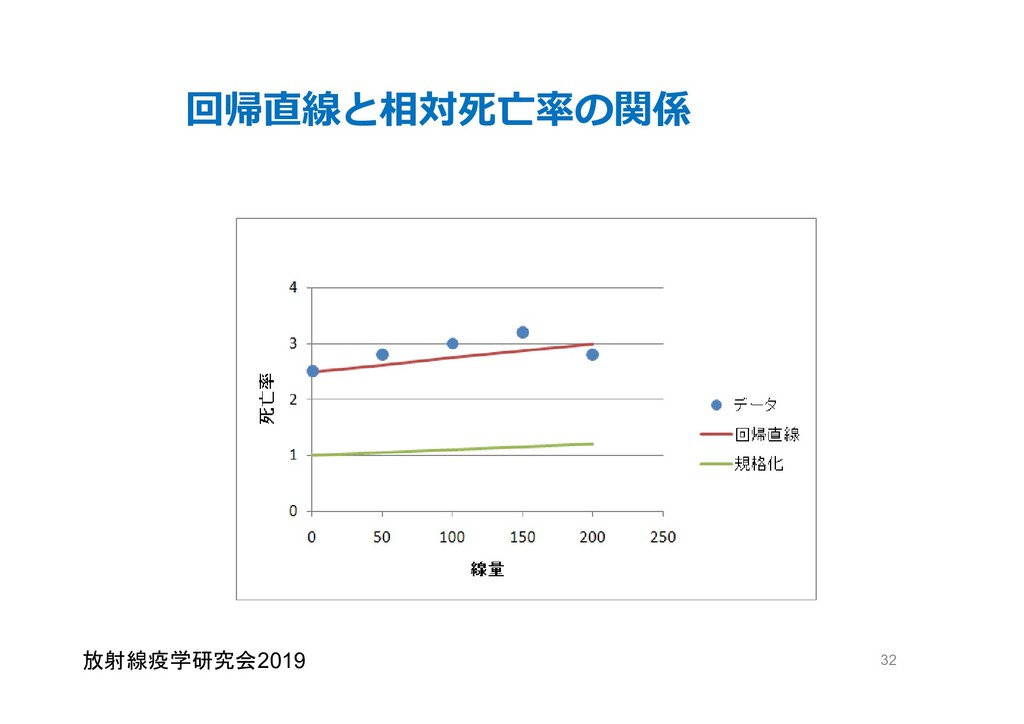
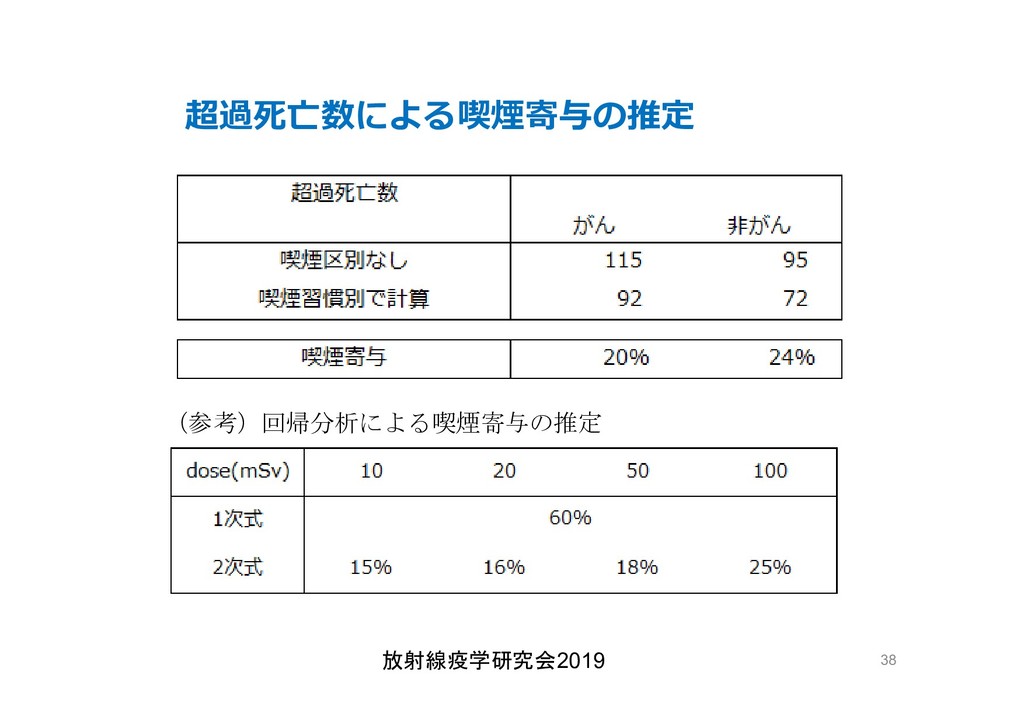
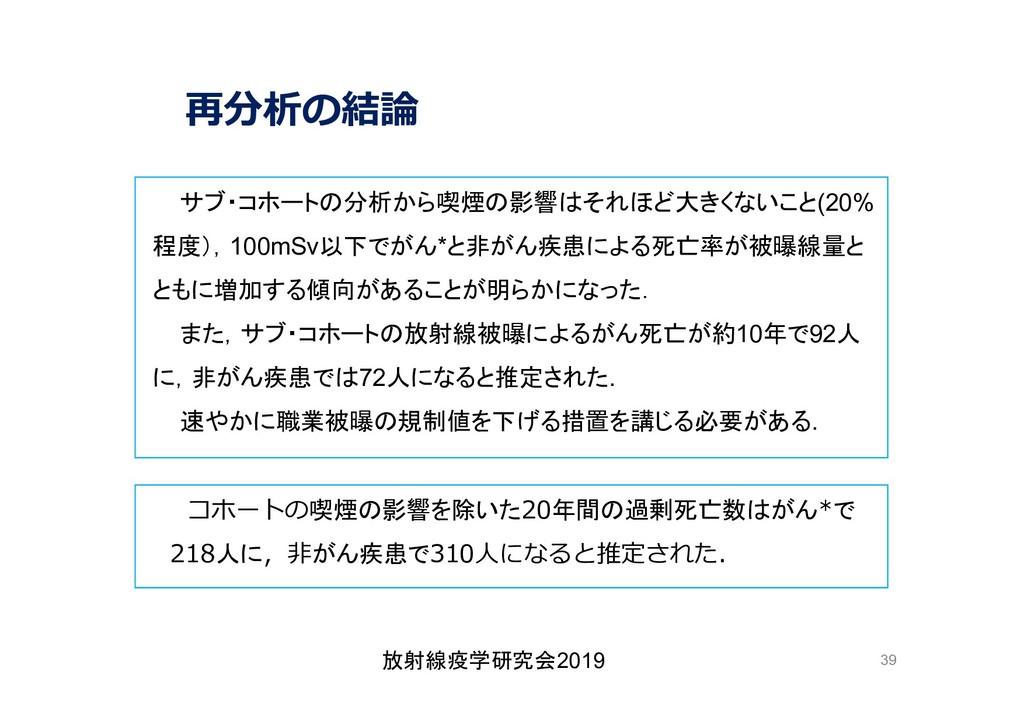
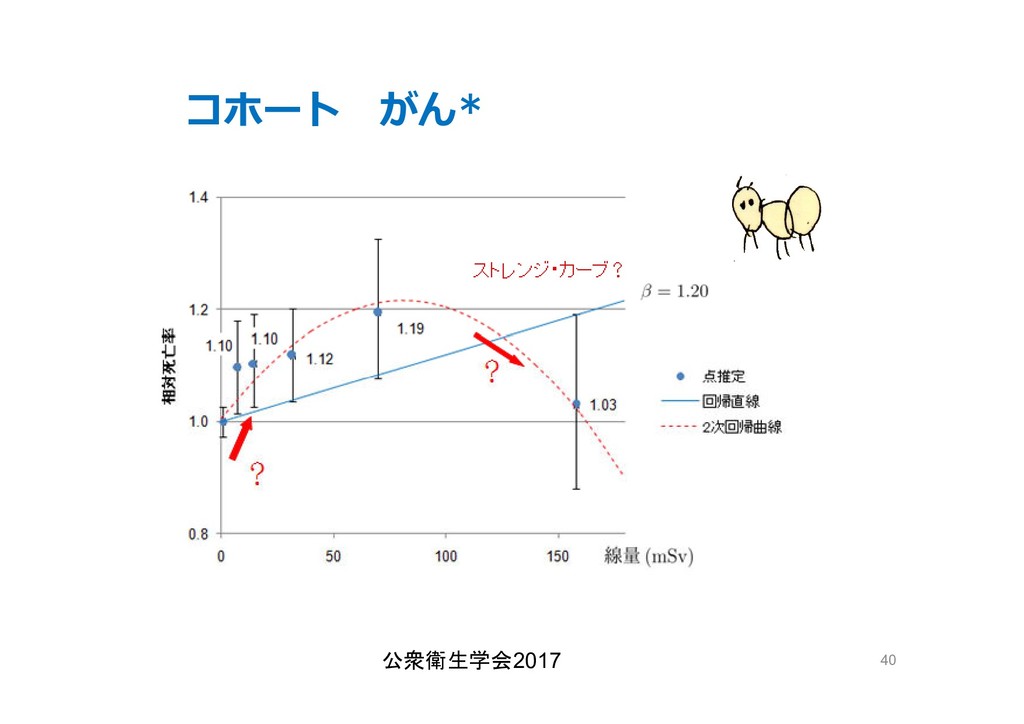
on June 1 2019 Smoking confounding was analised for cancer deaths among Japanese nuclesr male workers 2 deaths among Japanese nuclesr male workers 75,000 whose smoking habit are known. The data was found to be better fitted by a quardratic model than the linear model and it showed that the smoking habit contributes only about 20% of the risk increasing.
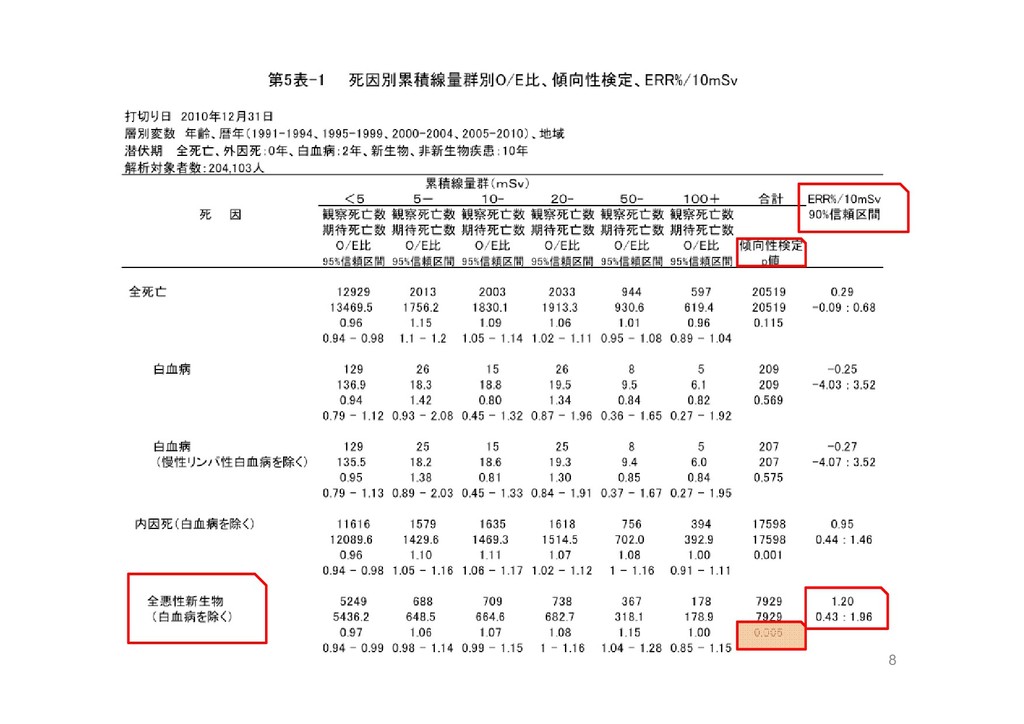
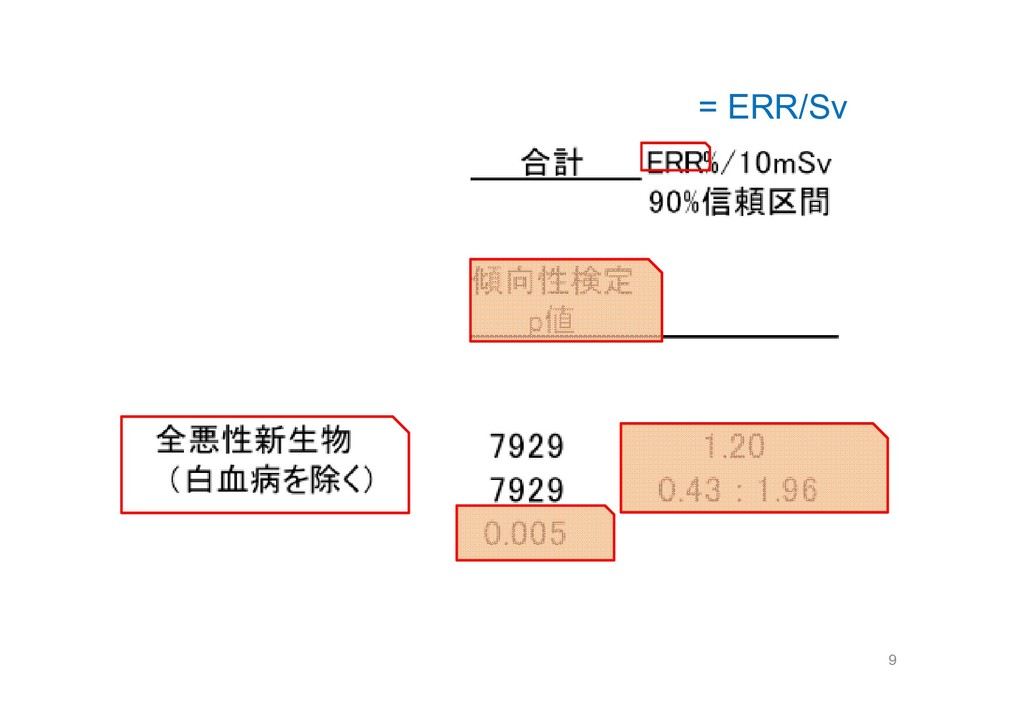
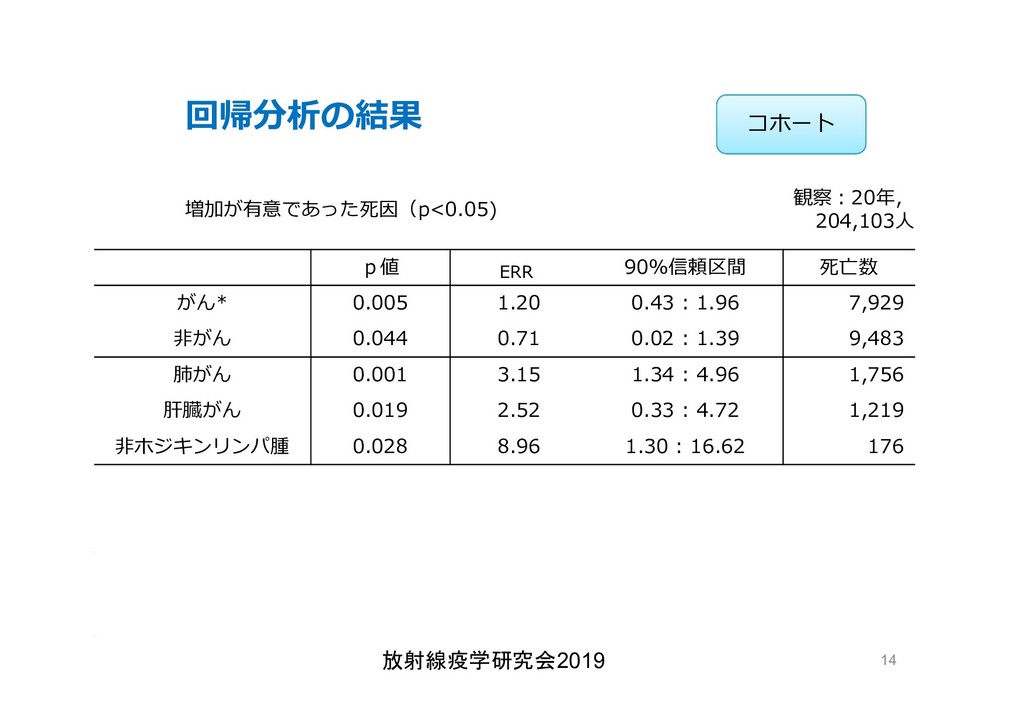
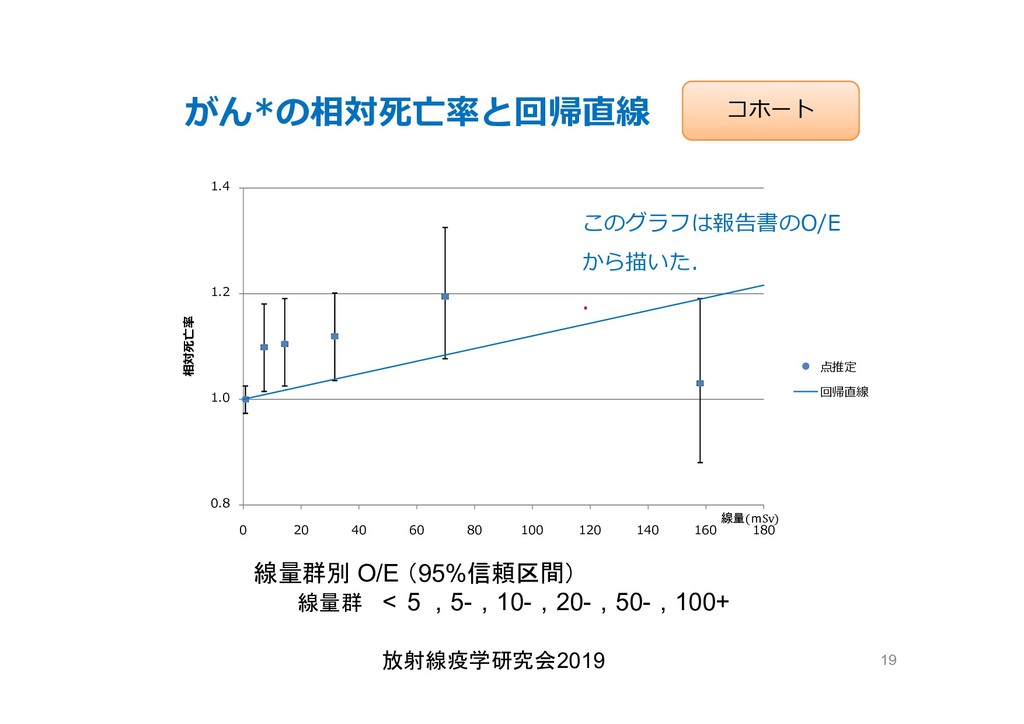
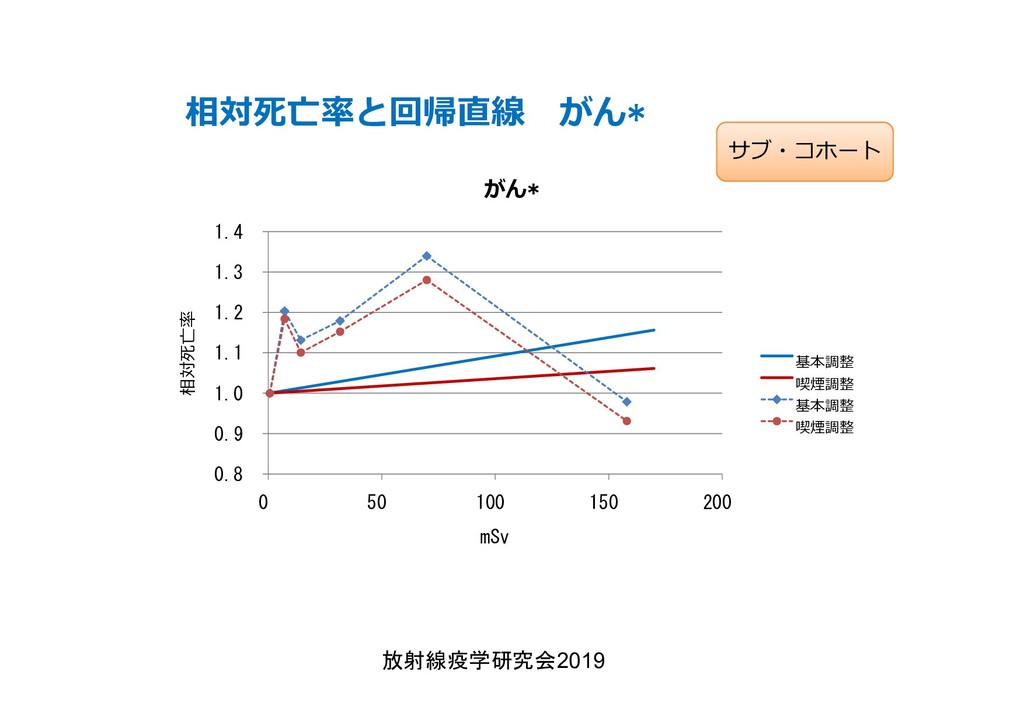
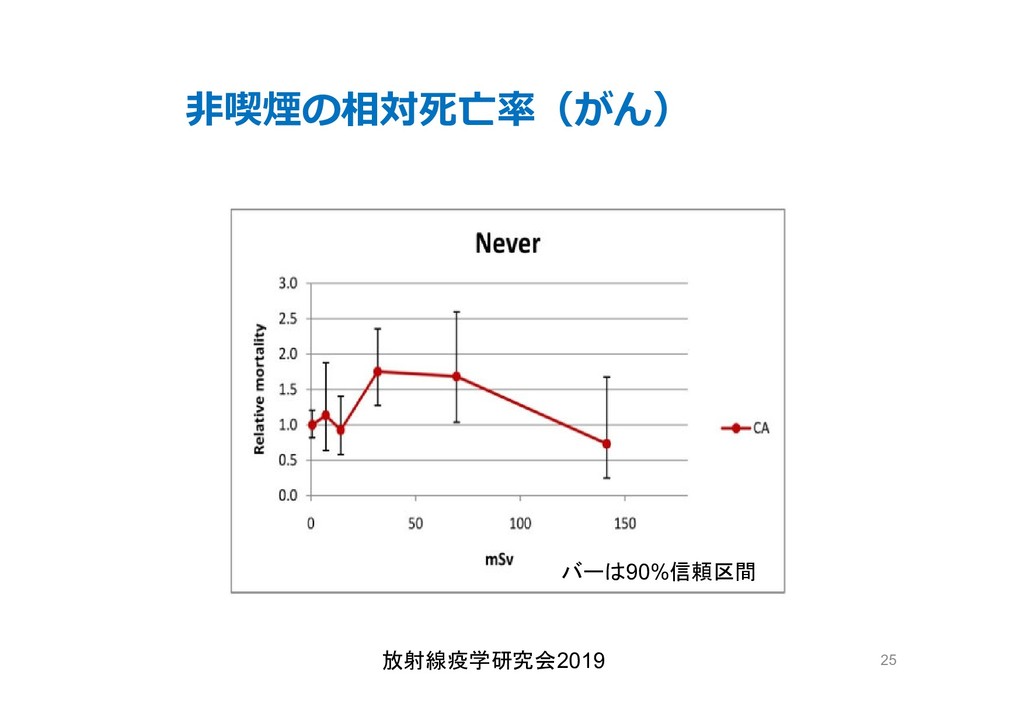
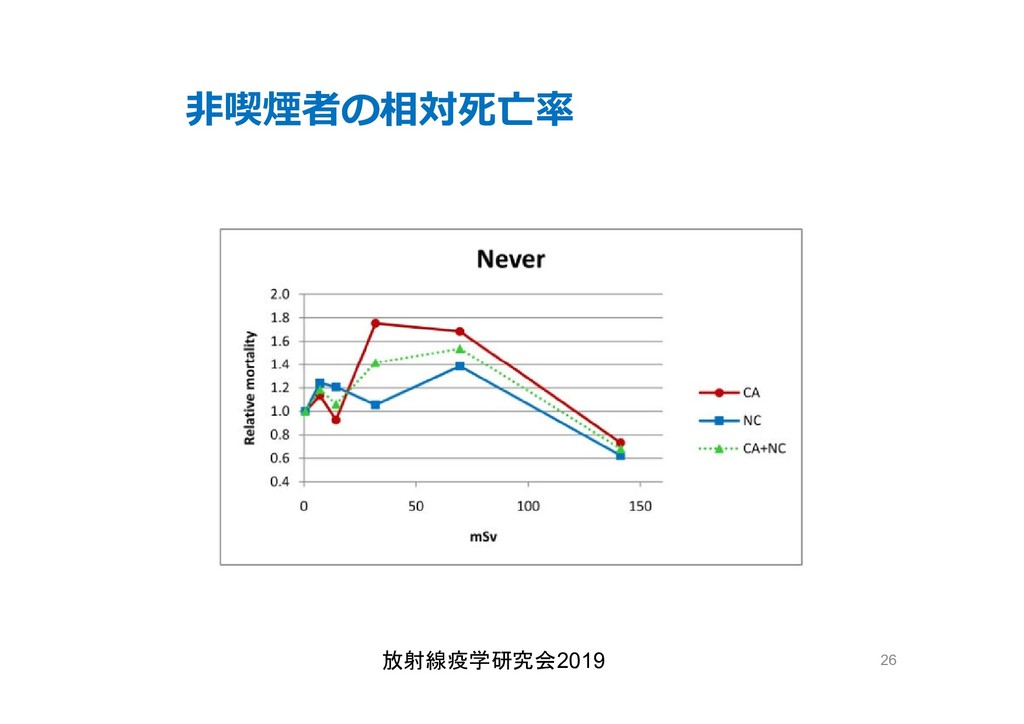
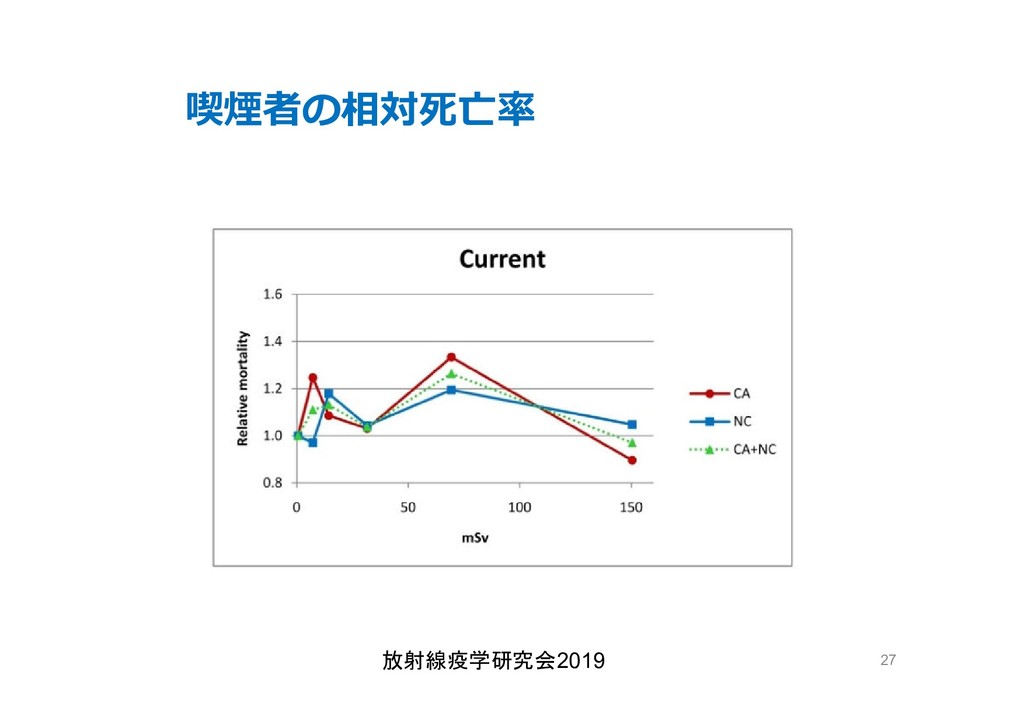
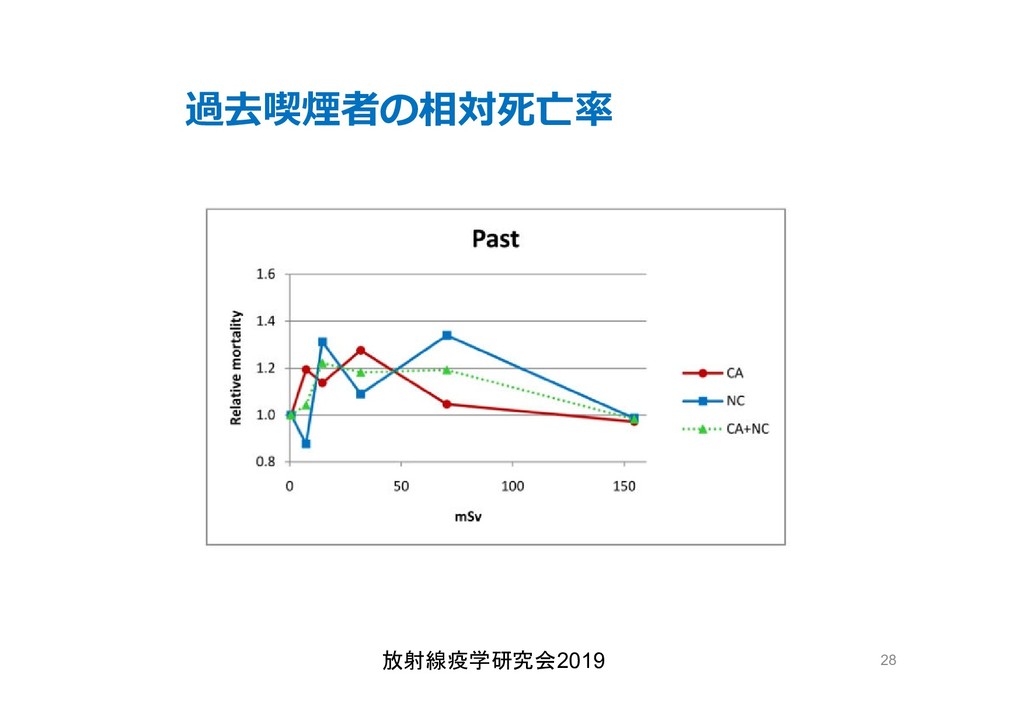
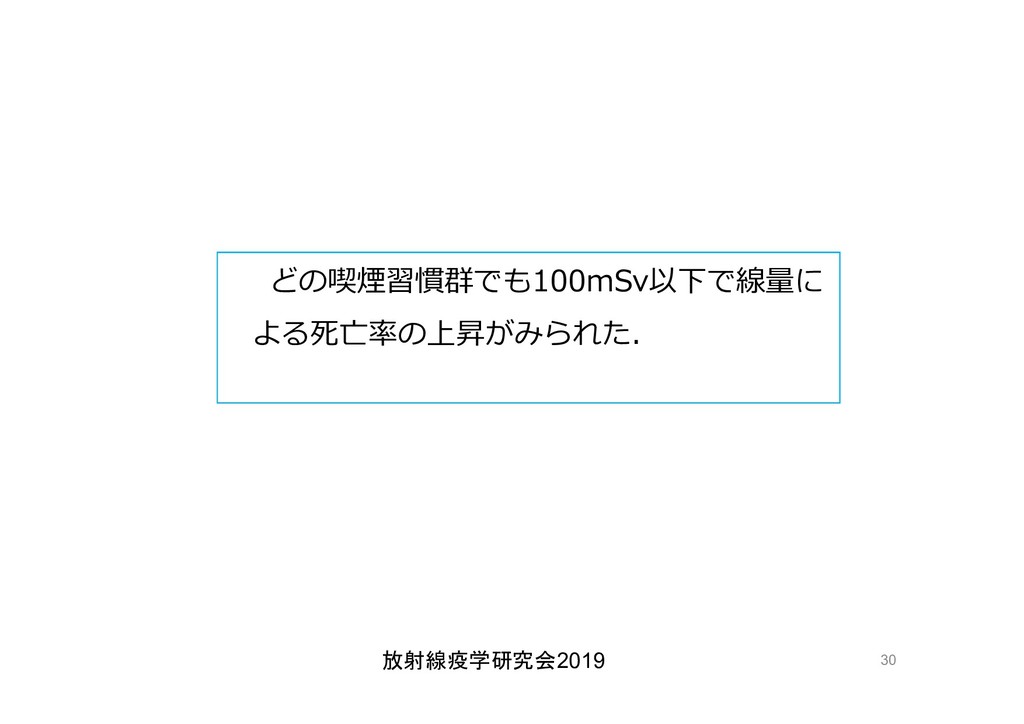
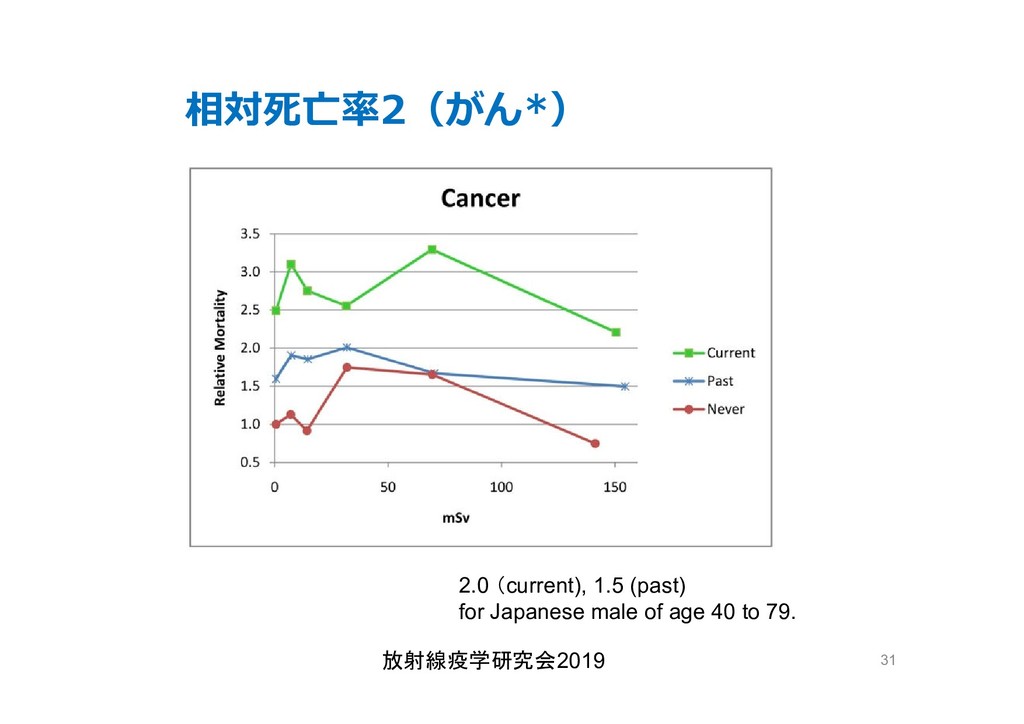
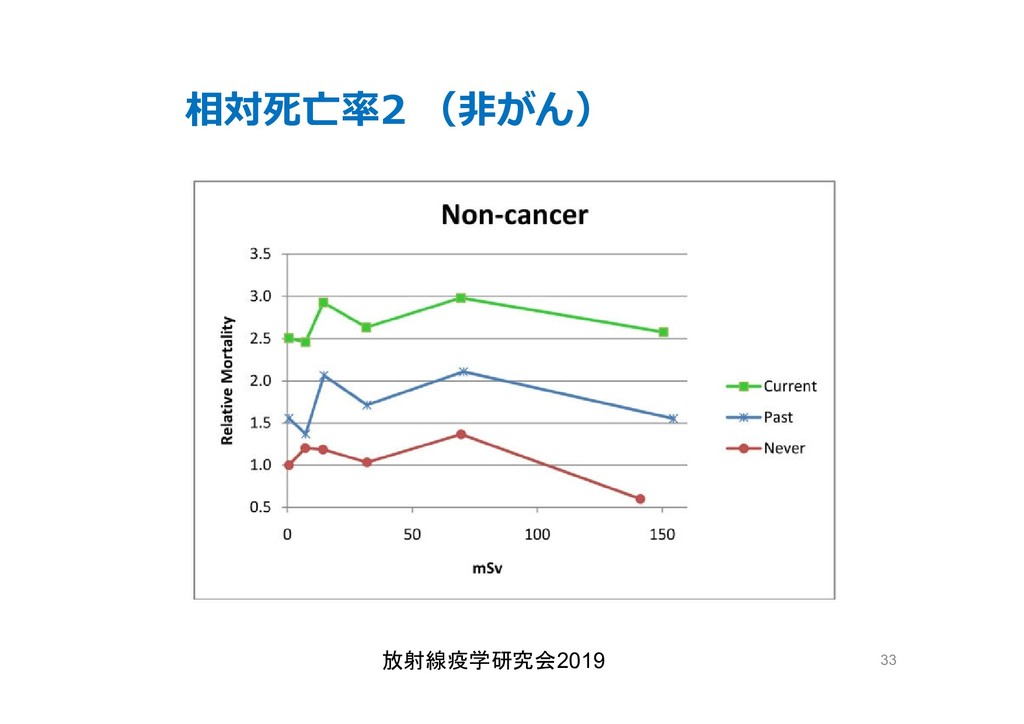
in 2015 report that smoking risk among this population contributes about 60% of risk incresing. However, this estimates is derived by using the linear model, deviation of which is very large from the data. 3 deviation of which is very large from the data. Furthermore, O/E for 6 dose categories were calculated for different smoking habit groups and the risk incresing with dose was found for never-, now- and past-smoking groups. The result for never- smoking group is especially important, because it is free from smoking confounding.
cancer risk estimates of mortality among male nuclear workers in Japan, 1999–2010, Shin’ichi Kudo et al, J. Radiol. Prot.38 357, 2018 Shin’ichi Kudo et al, J. Radiol. Prot.38 357, 2018 • 「がんリスクは10ミリシーベルトでも有意に増加」, 松崎 道幸,日本の科学者 Vol.48,No.1,January 2013 放射線疫学研究会2019 42
![喫煙習慣の異なる原発等核施設労働者の 被曝線量と死亡率の関係 -放射線影響協会のデータの解析- 分野を横断した放射線疫学の研究会 2019夏 -放射線影響協会のデータの解析- 永井 宏幸 NPO市⺠科学研究室/低線量被曝研究会 [email protected]](https://files.speakerdeck.com/presentations/e99ae55dd2944e7cbefdcbc0b0788abc/slide_3.jpg)