Upgrade to Pro — share decks privately, control downloads, hide ads and more …

Monitoring Applications with Prometheus and Grafana

Monitoring Applications with Prometheus and Grafana

Conference: https://www.womentech.net/women-tech-conference
Talk : https://www.youtube.com/watch?v=ygk7yBnljsg&feature=youtu.be

Session: Monitoring Applications with Prometheus and Grafana
"If you can't measure it, you can't improve it."
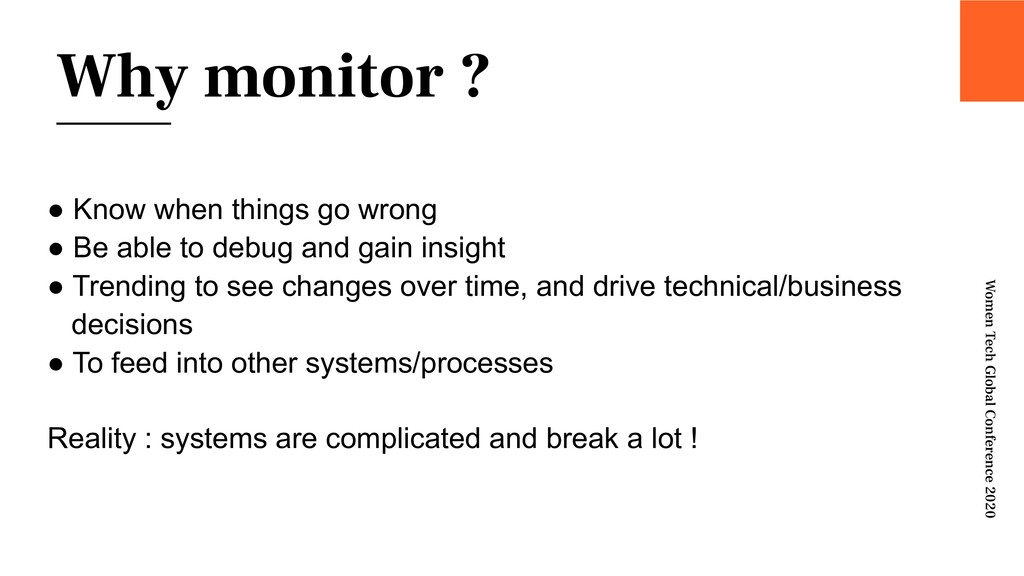
Monitoring an application’s health and metrics makes it possible to manage it in a better way and notice unoptimized behavior.
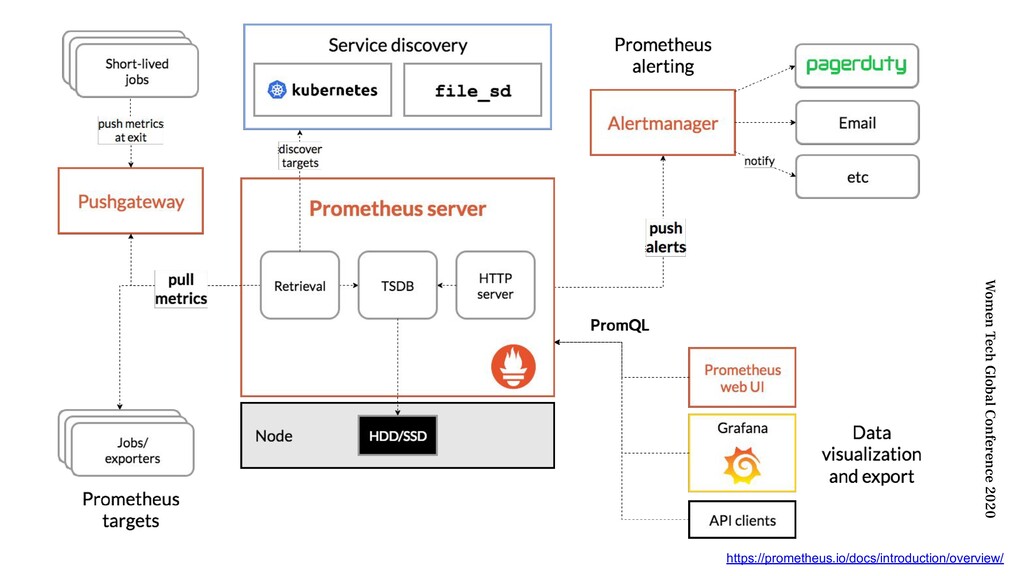
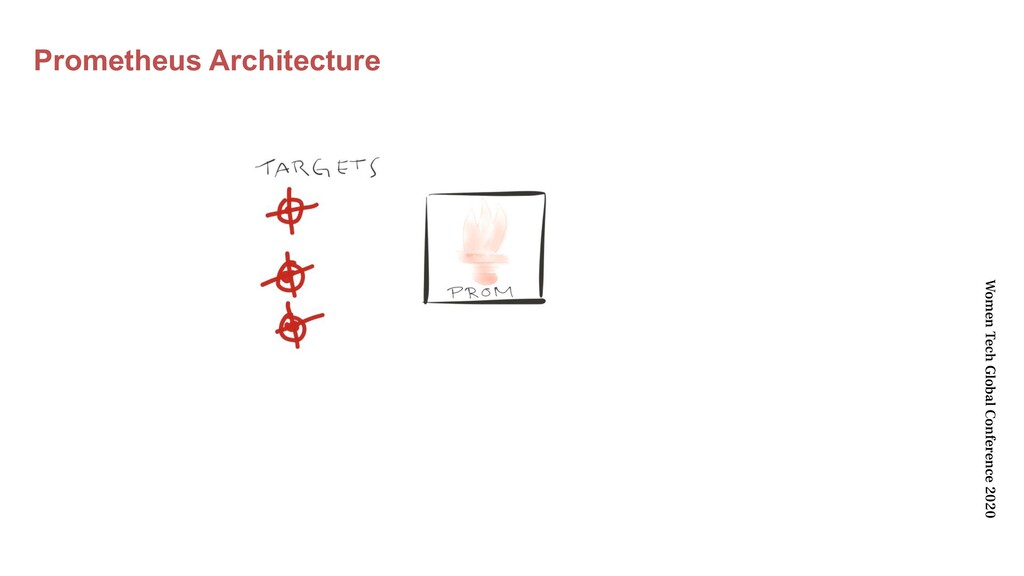
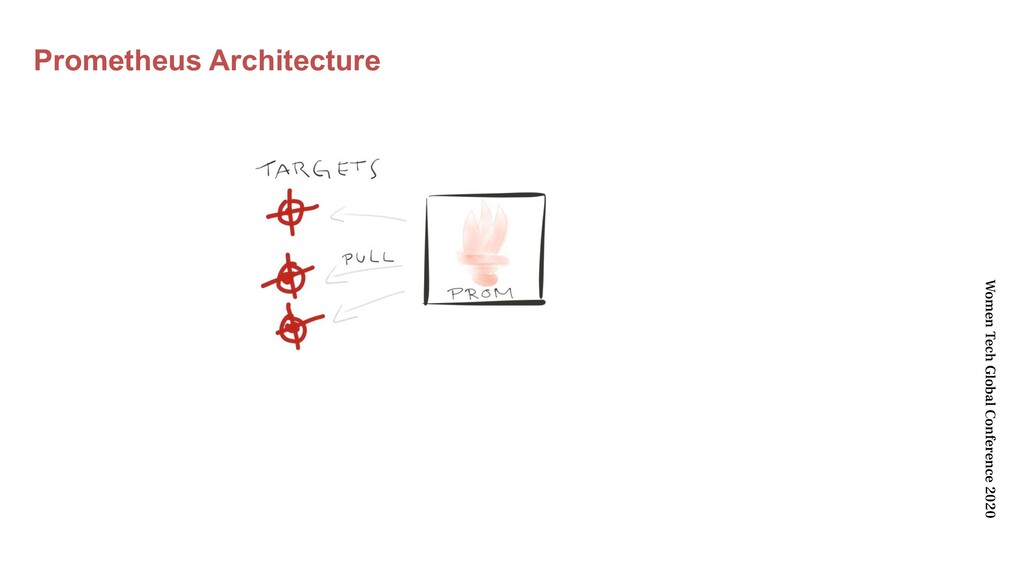
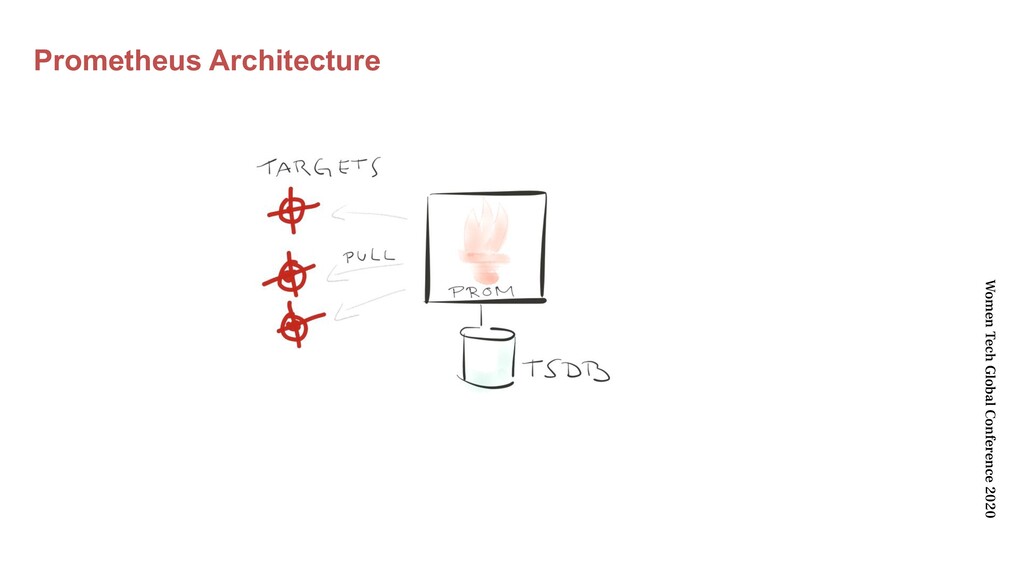
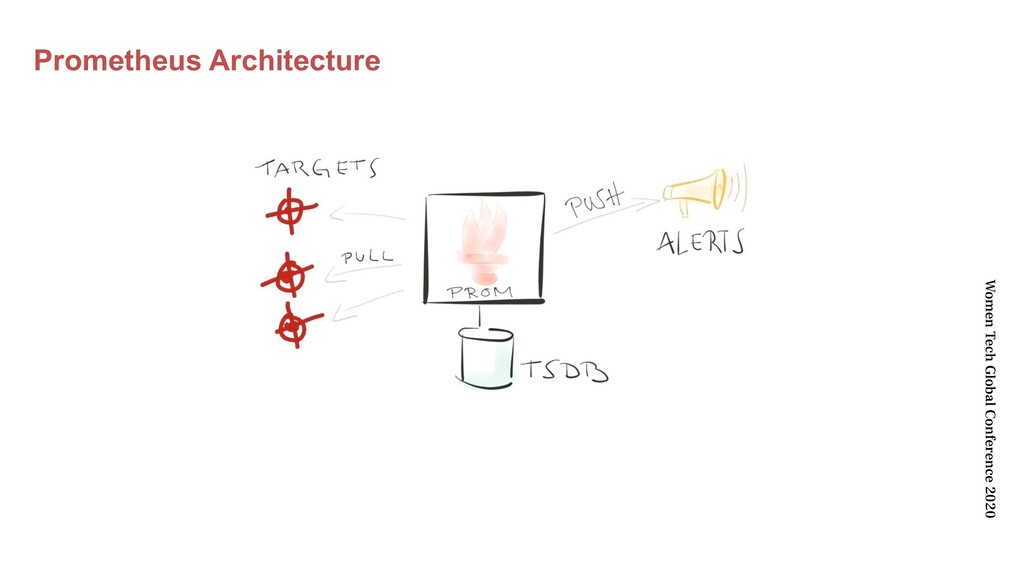
With this session, we will aim to learn about how to start monitoring your technology infrastructure with Prometheus and Grafana and learn about how to derive metrics that matter to reliable and performant operations of your infrastructure.

Nancy Chauhan

June 11, 2020
Tweet

More Decks by Nancy Chauhan

Other Decks in Programming

Transcript

  1. You can find me at : • Github : Nancy-Chauhan

    • Twitter : _nancychauhan • Website : nancychauhan.in Software Developer at Grofers, India Women Tech Global Conference 2020 About me
  2. Agenda • Need for services and systems monitoring • Different

    approaches to monitoring and observability. • Prometheus - landscape and basic architecture. • Monitoring your application – What to monitor – How to monitor – Visualizing – Alerting • Prometheus in Real World Women Tech Global Conference 2020
  3. Why monitor ? • Know when things go wrong •

    Be able to debug and gain insight • Trending to see changes over time, and drive technical/business decisions • To feed into other systems/processes Reality : systems are complicated and break a lot ! Women Tech Global Conference 2020
  4. Potential Problems • Software Bug -> Request/ Application errors •

    Low memory utilization -> Money wasted • High CPU utilization • Disk Full -> No new data stored , Slow performance • Network Outage -> Services cannot communicate Women Tech Global Conference 2020
  5. Types of Monitoring • Check Based monitoring ( health checks)

    ◦ Nagios, Icinga • Logs/ Events ◦ Loki, Splunk, Elasticsearch, • Metric & Time Series ◦ Prometheus, StatsD, InfluxDB • Request Tracing ◦ Zipkin, Jaegar Women Tech Global Conference 2020
  6. Favourite Features • Dimensional data model • Powerful query language

    (PromQL) • Simple & efficient server • Support for Service discovery Integration Women Tech Global Conference 2020
  7. What is Prometheus ? Women Tech Global Conference 2020 Monitoring

    your Application IIlustration by Asif Jamal
  8. What to monitor ? • Request and response statuses –

    success or failure • Timings of transactions – external calls, data processing • Request and response timings • Application runtime metrics – memory, cpu, gc, etc. Women Tech Global Conference 2020
  9. What to monitor ? (contd.) • Environment metrics – container

    metrics, load factor of container / VM, network IO bytes, disk IO etc. • Event counts – no of time something happened like cache miss, exceptions • Queue sizes, Cache sizes Women Tech Global Conference 2020
  10. How to monitor • Using your framework’s support for exporting

    metrics into prometheus • Using prometheus client libraries directly • Using node exporter to export metrics for your VM • Prometheus operator for Kubernetes Women Tech Global Conference 2020
  11. How to monitor (contd.) • Identify what metrics you are

    interested in • Categorize the data type for the metrics – whether its gauge or counter or histogram • Write code to export the metric • Setup prometheus to scrape metrics from your application Women Tech Global Conference 2020
  12. Visualizing Although Prometheus provides basic visualisation, Grafana provides a full

    framework for : • sharing dashboards, • creating advanced queries and graphs, • and allowing for sharing and reuse of those dashboards. Women Tech Global Conference 2020
  13. Alerting • To truly protect applications, alerting teams is necessary

    when something goes wrong. • High level Tasks : • Setup an instance of Alert manager • Configure Prometheus instance to use Alert manager • Create alert rules in alert manager configuration Women Tech Global Conference 2020
  14. Monitoring Microservices • Request and response times of the service

    • Success and failure counters • Business metrics like order size average, A/B testing metrics • Database transactions and external call timings • Kubernetes pod metrics Women Tech Global Conference 2020
  15. Prometheus as a scraper • Prometheus is simple and leaves

    features like analysis and long term storage to extensions • Many organizations use Prometheus to collect metrics for processing and storing metrics in a different system such as Cortex, Uber M3, Thanos, CloudWatch etc. Women Tech Global Conference 2020
  16. Prometheus exporters • Sometimes a service you want to monitor

    isn’t prometheus ready • Define exporters to “export” metrics from a non-prometheus aware monitoring system into Prometheus • Prometheus project provides JMX exporter, StatsD exporter and push gateway • Jenkins exporter exports metrics from Jenkins builds to prometheus Women Tech Global Conference 2020