Developer @Grofers • Loves to make cool things ranging from hardware to infra. • Has hosted her code at @Nancy-Chauhan • Speaks her mind at @_nancychauhan • Lives in Gurgaon, India
• Metric types of Prometheus • Configuring Prometheus for reliability • Scaling Prometheus • Prometheus HA using 3rd party tools like thanos • Monitoring Prometheus • Alternate Architecture for HA
• Know when things go wrong ◦ To call in a human to prevent a business-level issue • Be able to debug and gain insight • Trending to see changes over time, and drive technical/business decisions • To feed into other systems/processes
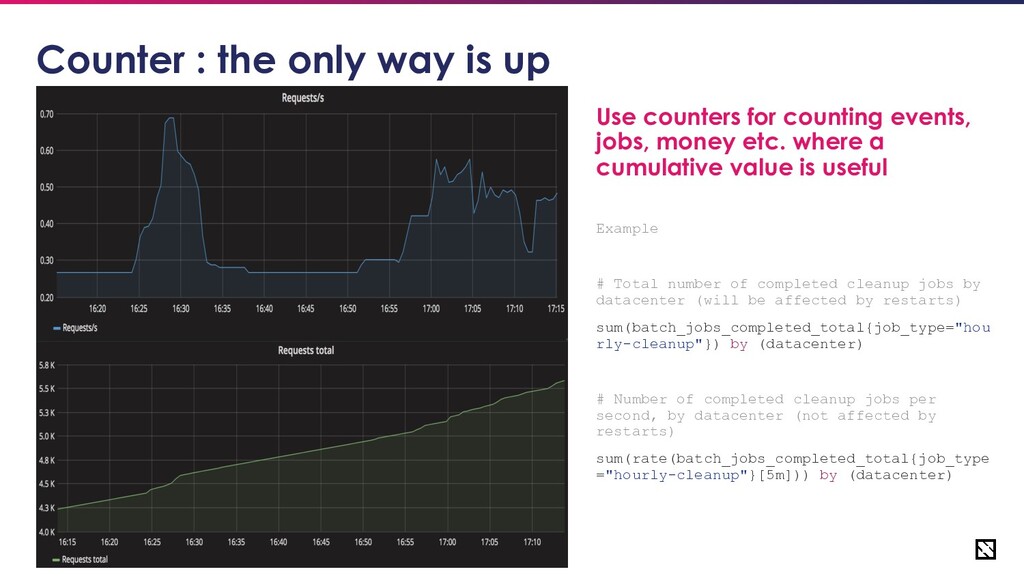
only way is up Use counters for counting events, jobs, money etc. where a cumulative value is useful Example # Total number of completed cleanup jobs by datacenter (will be affected by restarts) sum(batch_jobs_completed_total{job_type="hou rly-cleanup"}) by (datacenter) # Number of completed cleanup jobs per second, by datacenter (not affected by restarts) sum(rate(batch_jobs_completed_total{job_type ="hourly-cleanup"}[5m])) by (datacenter)
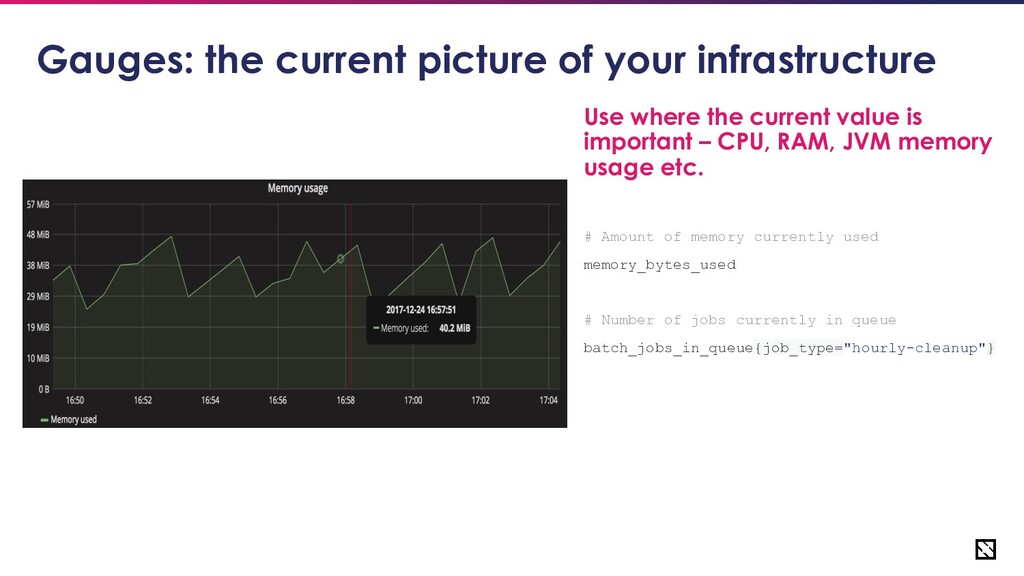
picture of your infrastructure Use where the current value is important – CPU, RAM, JVM memory usage etc. # Amount of memory currently used memory_bytes_used # Number of jobs currently in queue batch_jobs_in_queue{job_type="hourly-cleanup"}
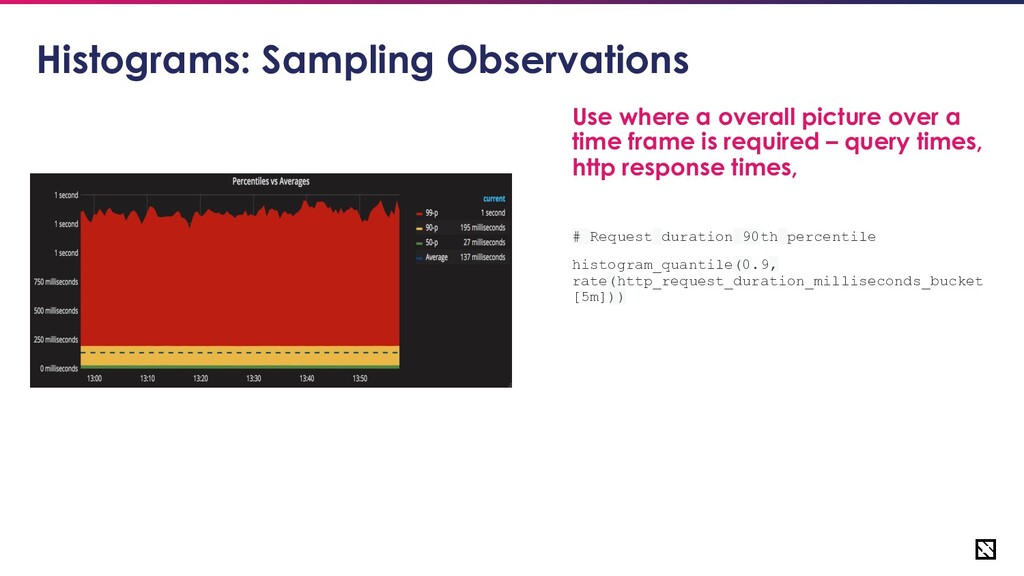
Use where a overall picture over a time frame is required – query times, http response times, # Request duration 90th percentile histogram_quantile(0.9, rate(http_request_duration_milliseconds_bucket [5m]))
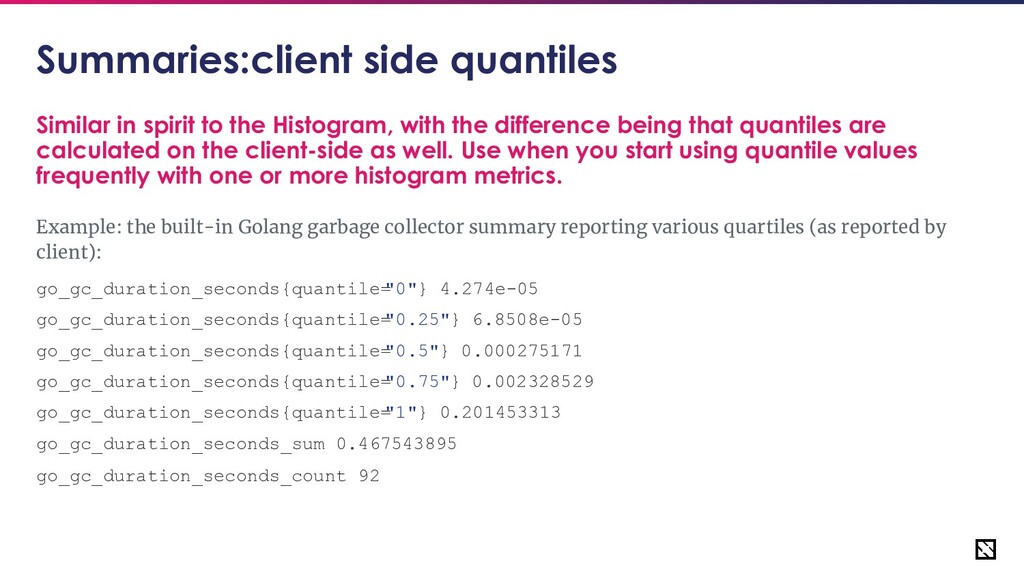
Similar in spirit to the Histogram, with the difference being that quantiles are calculated on the client-side as well. Use when you start using quantile values frequently with one or more histogram metrics. Example: the built-in Golang garbage collector summary reporting various quartiles (as reported by client): go_gc_duration_seconds{quantile= "0"} 4.274e-05 go_gc_duration_seconds{quantile= "0.25"} 6.8508e-05 go_gc_duration_seconds{quantile= "0.5"} 0.000275171 go_gc_duration_seconds{quantile= "0.75"} 0.002328529 go_gc_duration_seconds{quantile= "1"} 0.201453313 go_gc_duration_seconds_sum 0.467543895 go_gc_duration_seconds_count 92
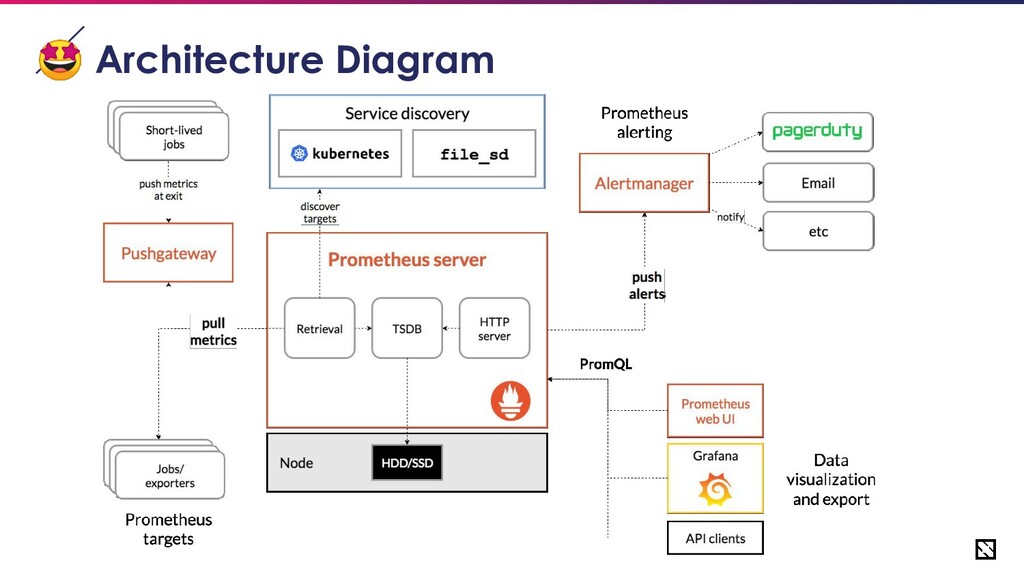
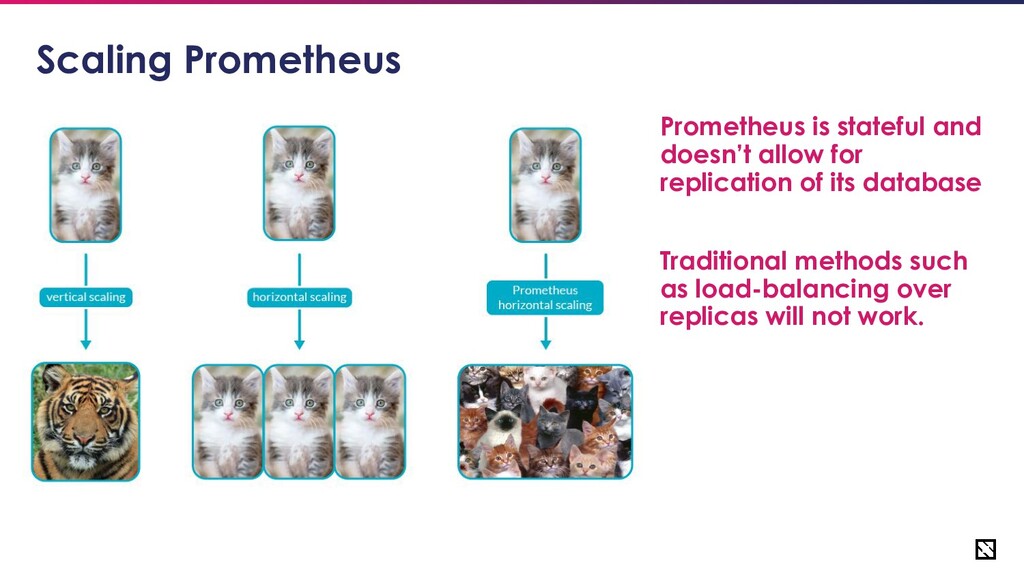
for Reliability • Avoid prometheus being a central point of failure • Scale prometheus to handle the volume of metrics generated by your application • Dedicated monitoring solution for Prometheus itself • Have centralized observability • Consider looking into alternate architecture if nothing works such as introducing a queue before Prometheus
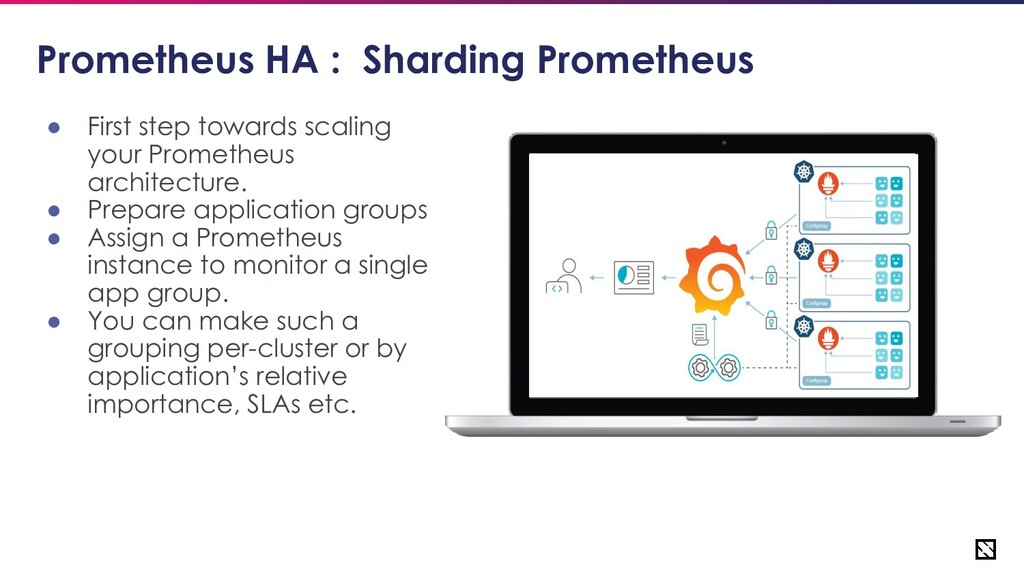
Sharding Prometheus • First step towards scaling your Prometheus architecture. • Prepare application groups • Assign a Prometheus instance to monitor a single app group. • You can make such a grouping per-cluster or by application’s relative importance, SLAs etc.
Prometheus Setup • Functional sharding of Prometheus with a central view • Unlimited long-term storage of data • Behaves as a meta-prometheus allowing to query multiple prometheus instances from a single point
Thanos sidecar to pull prometheus data and send to Thanos Store • Thanos store stores data in a long-term storage after deduplication. • Thanos querier to query multiple prometheus instances simultaneously • Thanos compactor for downsampling historical data • Even if your local prometheus is unavailable, data can be fetched from Thanos Store.
Who watches the watchers? • Monitoring prometheus is critical • Have a dedicated prometheus instance to manage all other prometheus instances • You can consider using a third-party service such as Datadog or NewRelic
HA • Push based architecture ◦ Application push data to a statsd like server (collector) ◦ Collector publishes data to a queue (such as Kafka) ◦ Prometheus scrapes from a purpose-built exporter that reads from Kafka • Advantages: ◦ Reduces loss of data due to prometheus unavailability. ◦ Easy long term storage by consuming queue data • Disadvantages: ◦ Non-standard ◦ Complex
HA Utilising Integration with prometheus Lots of companies use prometheus as scraper and export the data into separate system. • CloudWatch • Cortex • Uber M3