Upgrade to Pro — share decks privately, control downloads, hide ads and more …

Modern Network Observability

Modern Network Observability

How do we move beyond the familiar tools that have kept our networks running for decades? In this talk, we’ll explore modern observability—a fresh approach that enables deeper insights into increasingly complex systems. Building on the lessons shared in our book, Modern Network Observability, I’ll show how modular architectures and open-source tools empower us to unlock the full potential of our data.
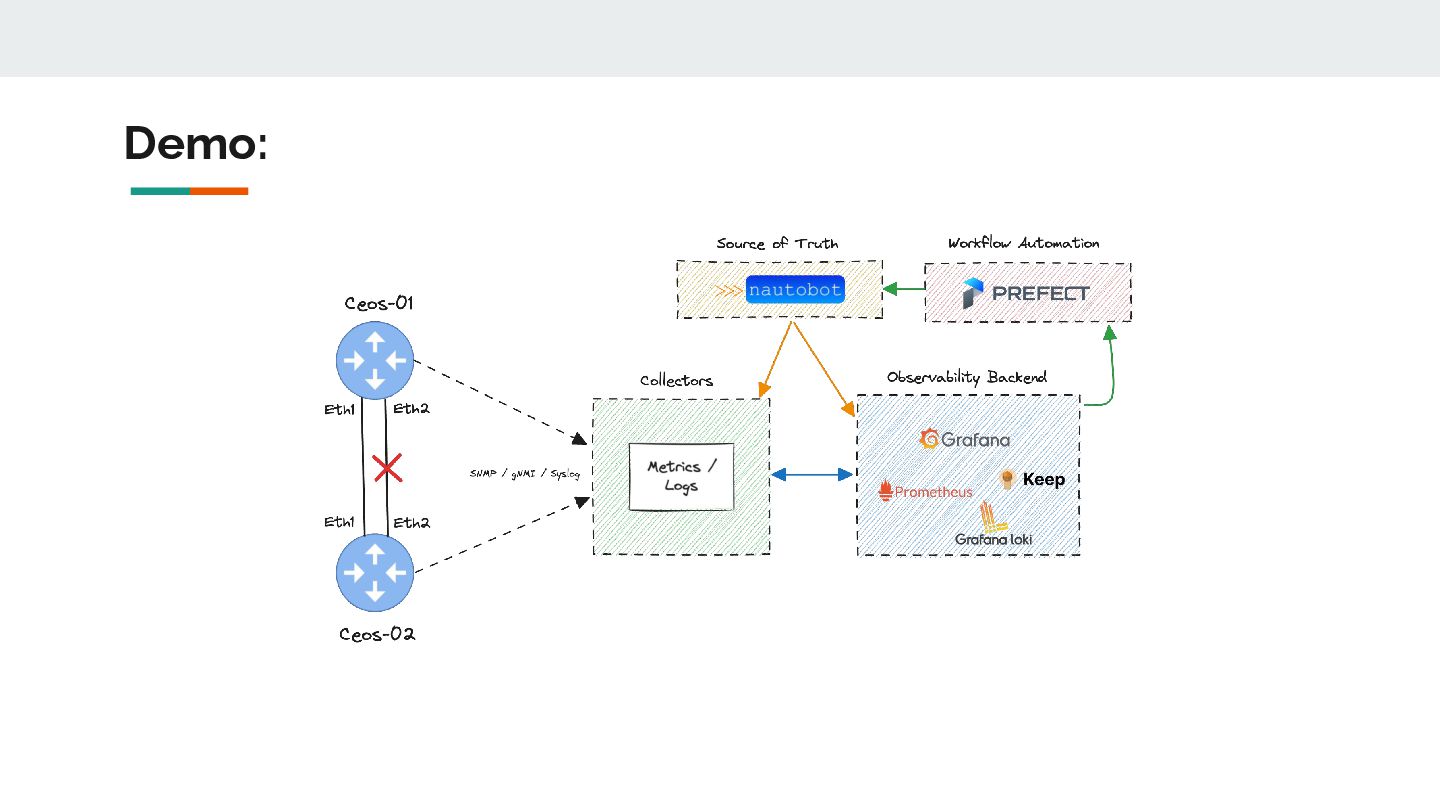
We’ll dive into the challenges of orchestration, data normalization, and overcoming the limits of monolithic monitoring systems. Finally, I’ll wrap up with a demo to demonstrate just how easy it can be to set up an observability stack that shows the value of your network data.

Avatar for David Flores

David Flores

March 03, 2025

Other Decks in Technology

Transcript

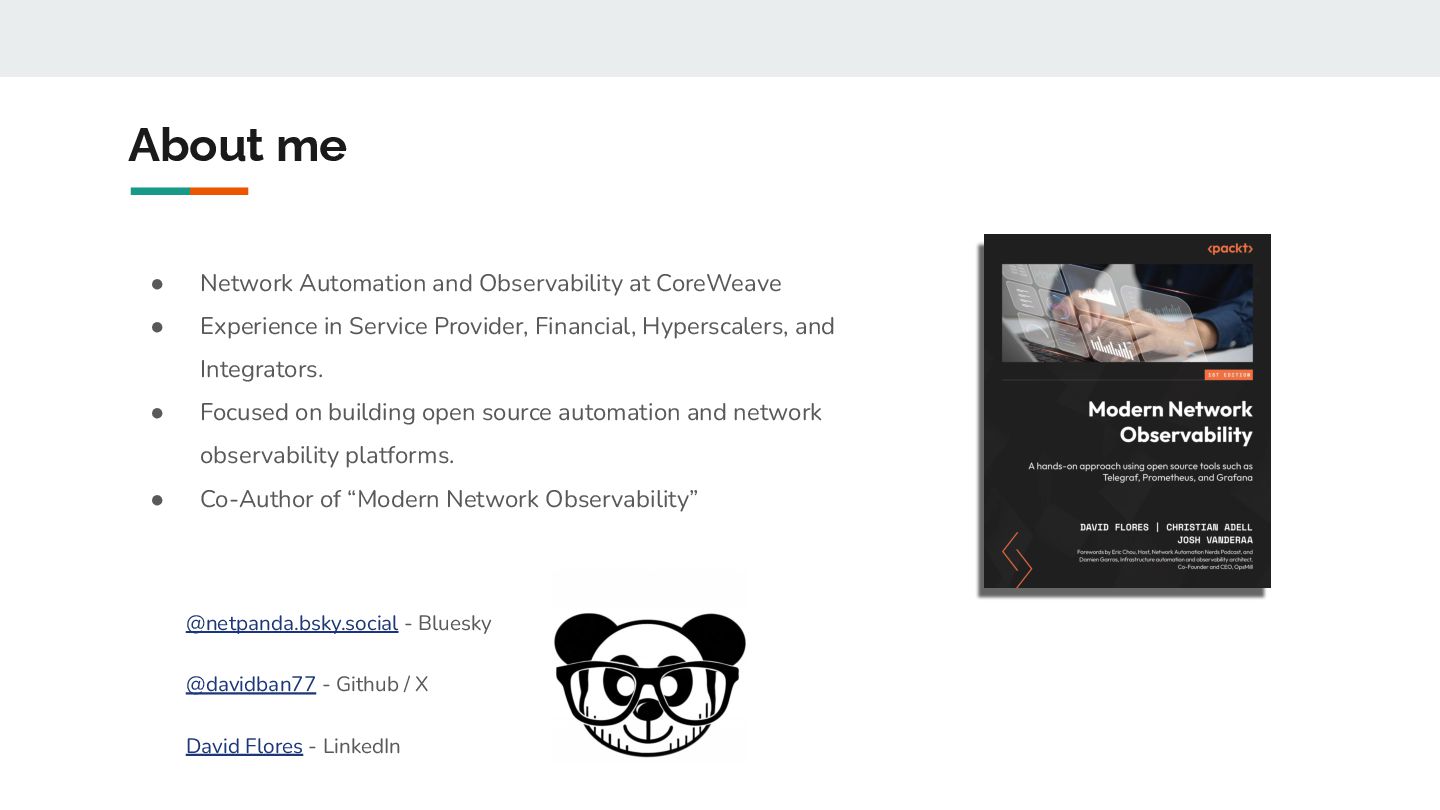
  1. About me • Network Automation and Observability at CoreWeave •

    Experience in Service Provider, Financial, Hyperscalers, and Integrators. • Focused on building open source automation and network observability platforms. • Co-Author of “Modern Network Observability” @netpanda.bsky.social - Bluesky @davidban77 - Github / X David Flores - LinkedIn
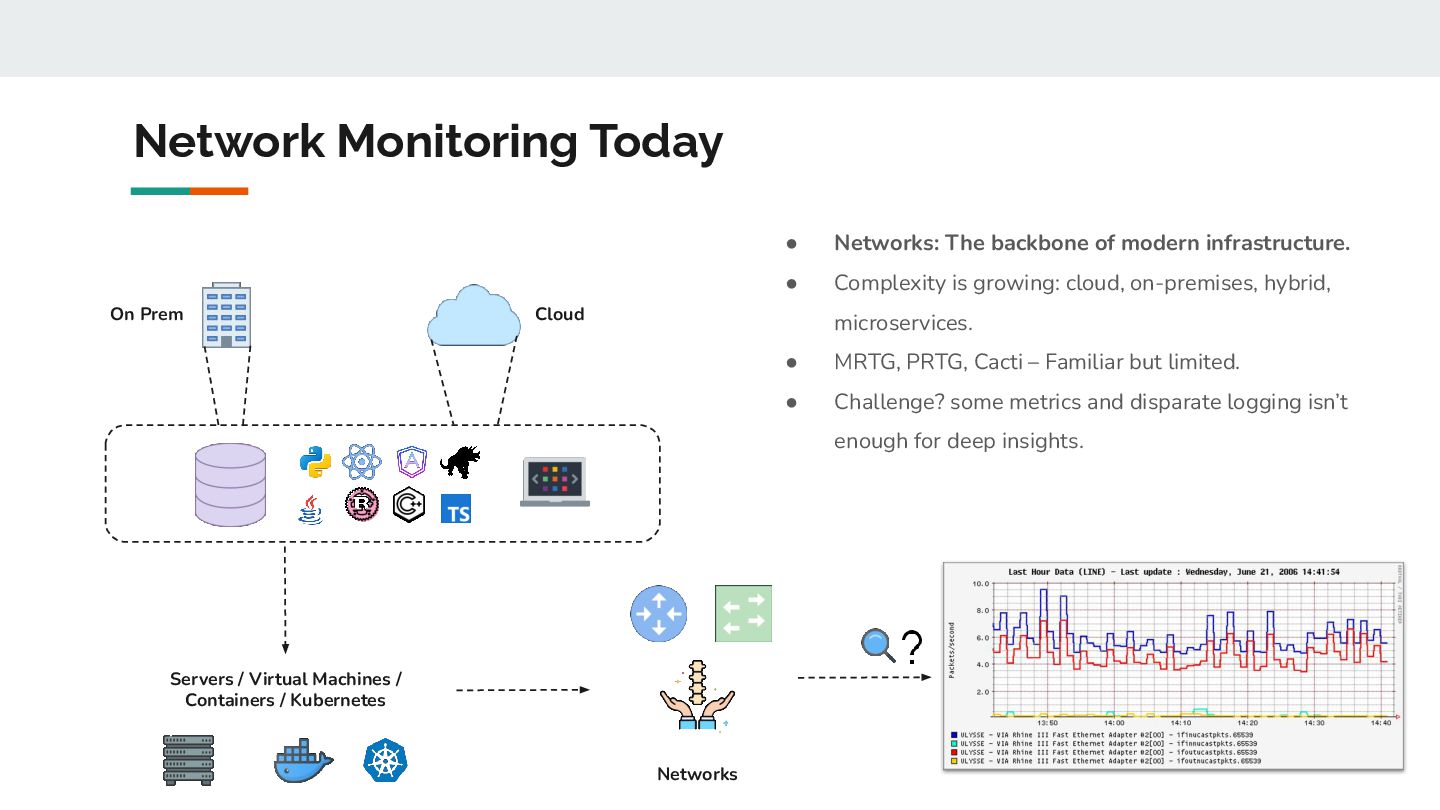
  2. Network Monitoring Today • Networks: The backbone of modern infrastructure.

    • Complexity is growing: cloud, on-premises, hybrid, microservices. • MRTG, PRTG, Cacti – Familiar but limited. • Challenge? some metrics and disparate logging isn’t enough for deep insights. Servers / Virtual Machines / Containers / Kubernetes Networks On Prem Cloud
  3. • Observability vs. Monitoring: “What happened” vs. “Why it happened.”

    • Extracting actionable insights from multiple system signals. • Distributed systems and modular architectures require new strategies. What Is Observability? Metrics Logs Flows Synthetic Monitoring
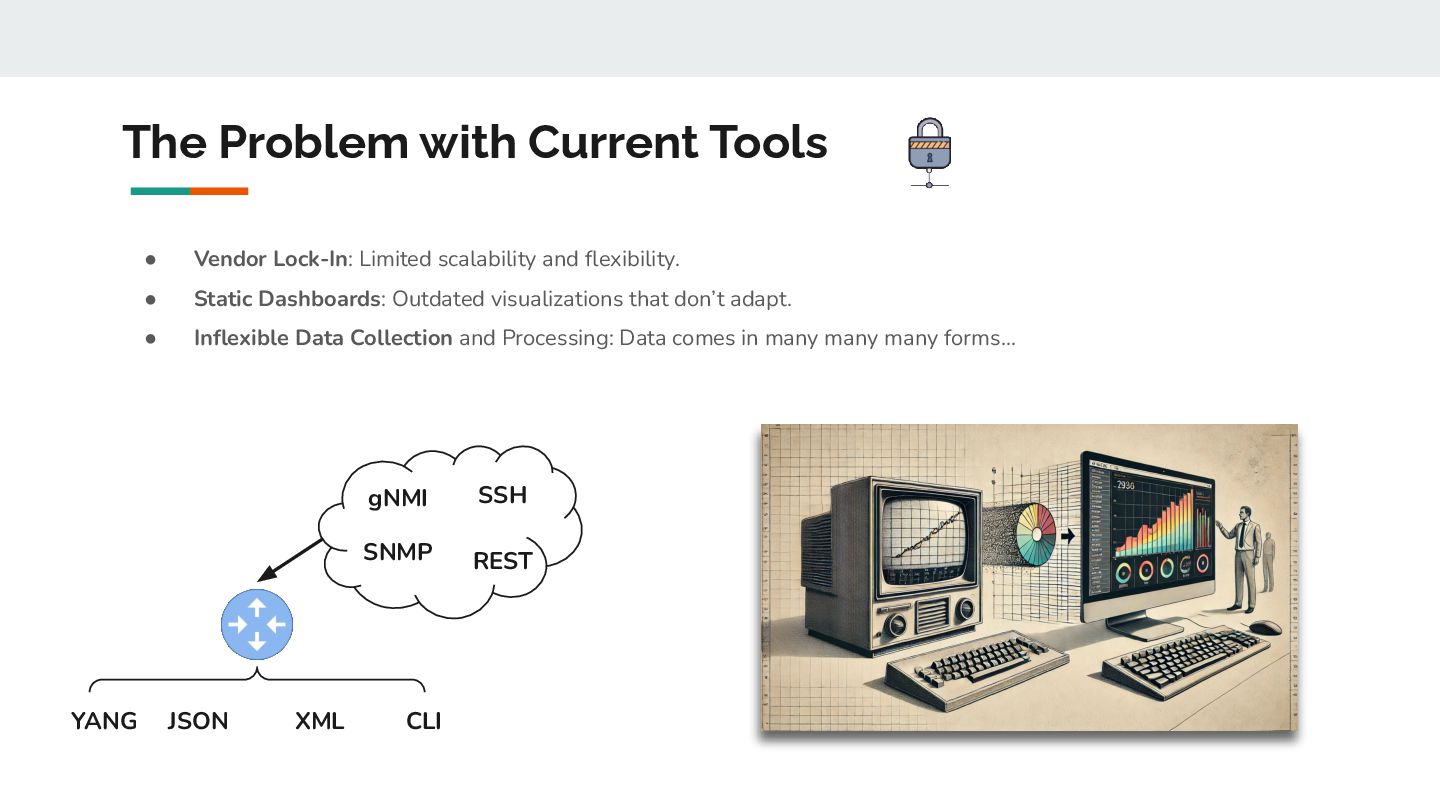
  4. The Problem with Current Tools • Vendor Lock-In: Limited scalability

    and flexibility. • Static Dashboards: Outdated visualizations that don’t adapt. • Inflexible Data Collection and Processing: Data comes in many many many forms… YANG JSON CLI gNMI SNMP SSH REST XML
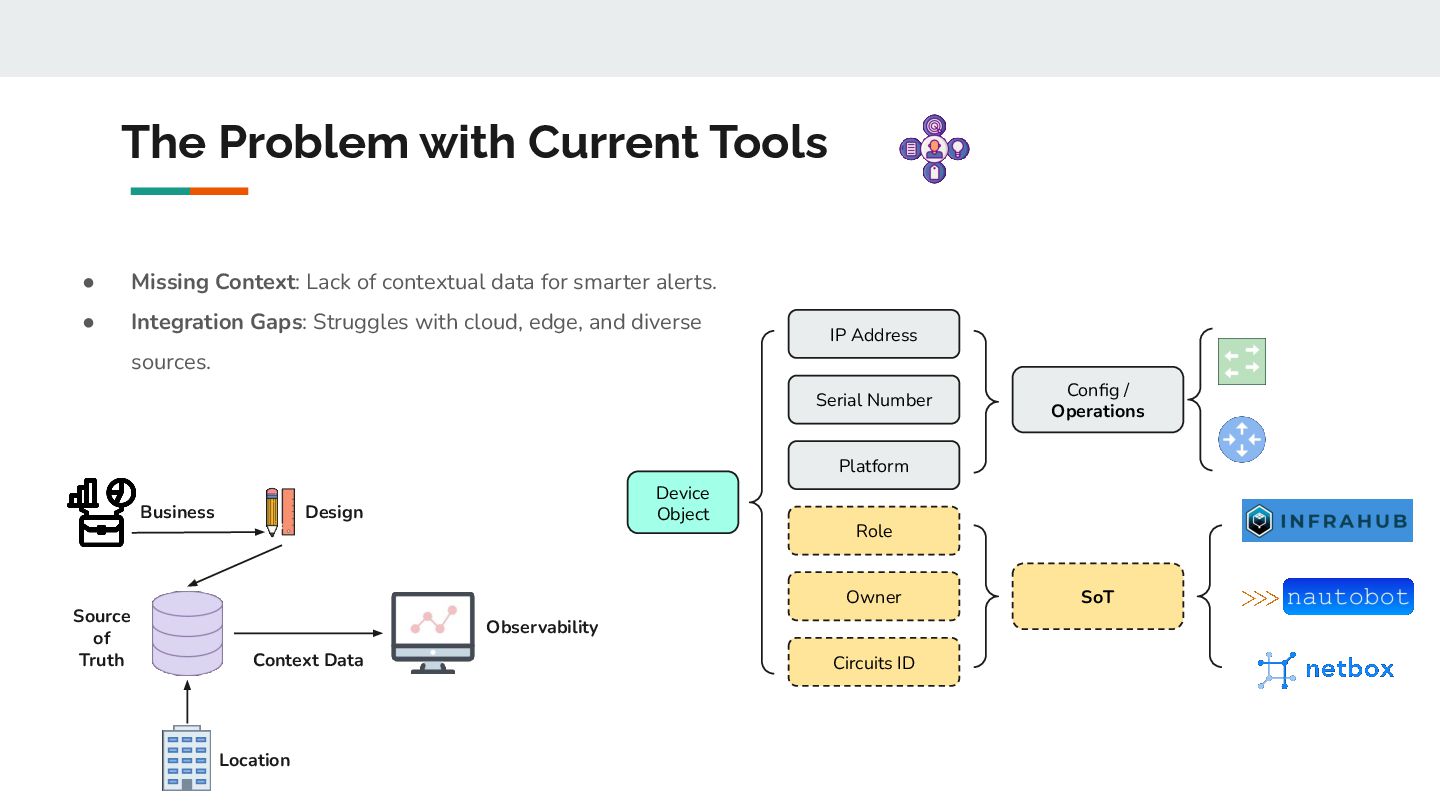
  5. The Problem with Current Tools • Missing Context: Lack of

    contextual data for smarter alerts. • Integration Gaps: Struggles with cloud, edge, and diverse sources. Device Object IP Address Serial Number Platform Role Owner Circuits ID SoT Config / Operations Business Design Location Source of Truth Observability Context Data
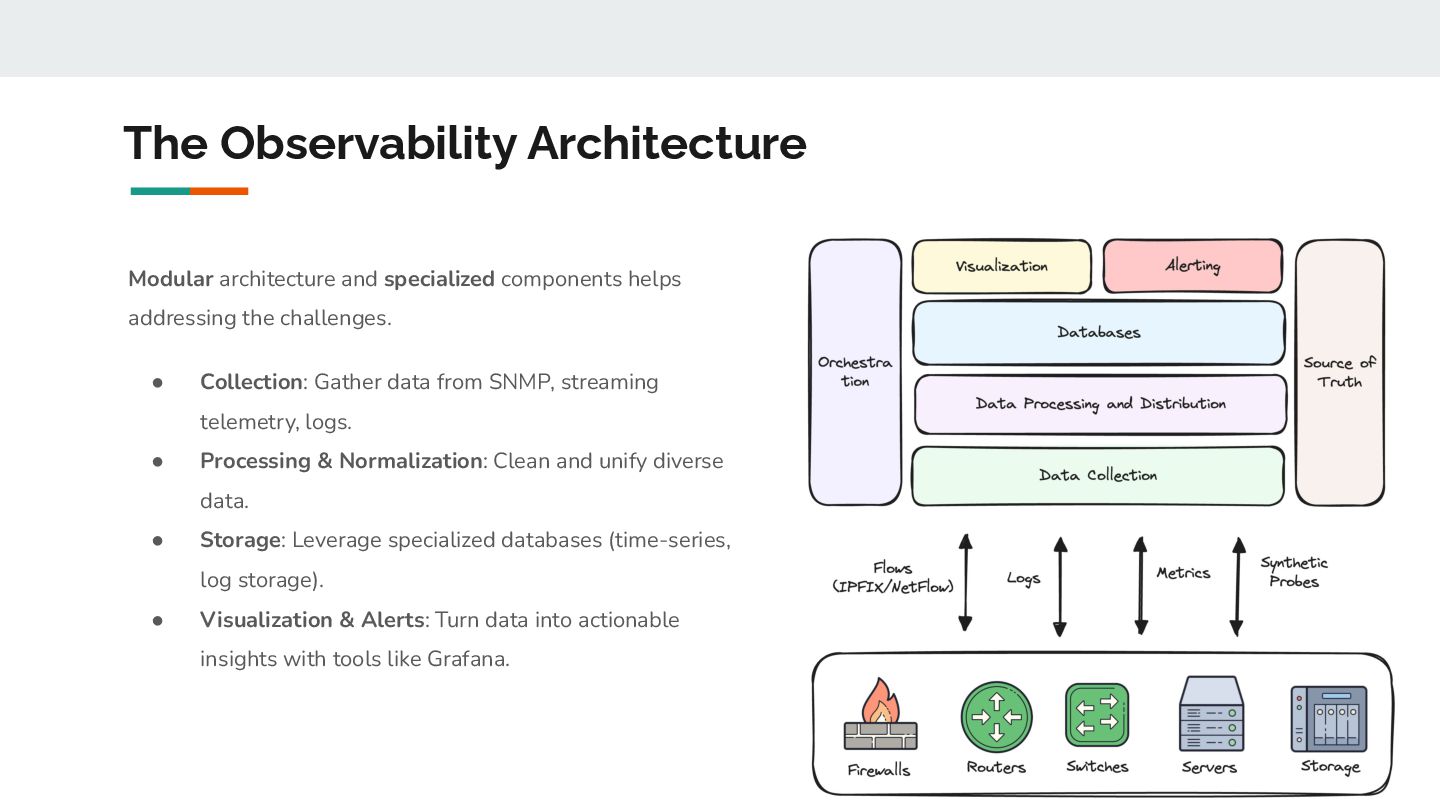
  6. The Observability Architecture Modular architecture and specialized components helps addressing

    the challenges. • Collection: Gather data from SNMP, streaming telemetry, logs. • Processing & Normalization: Clean and unify diverse data. • Storage: Leverage specialized databases (time-series, log storage). • Visualization & Alerts: Turn data into actionable insights with tools like Grafana.
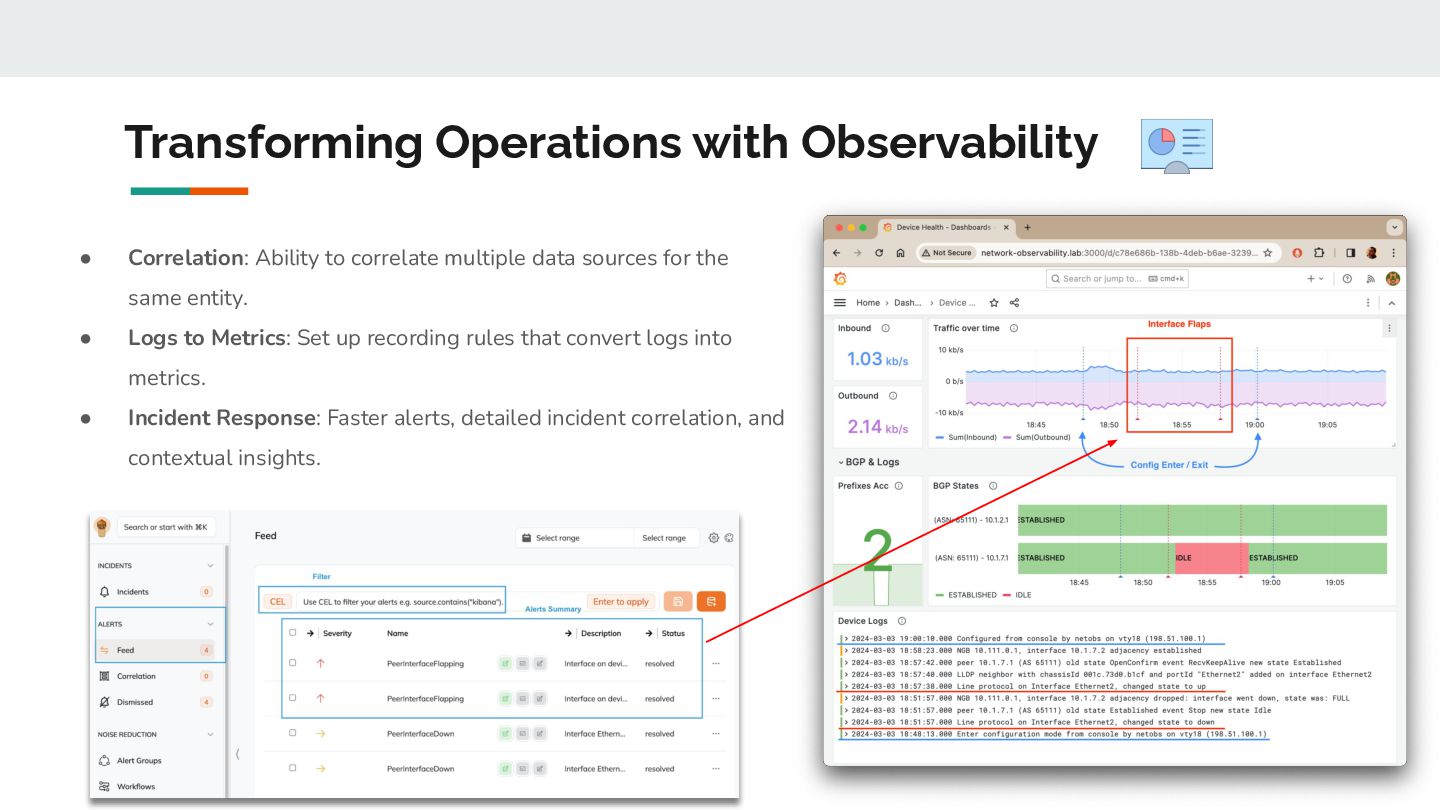
  7. Transforming Operations with Observability • Correlation: Ability to correlate multiple

    data sources for the same entity. • Logs to Metrics: Set up recording rules that convert logs into metrics. • Incident Response: Faster alerts, detailed incident correlation, and contextual insights.
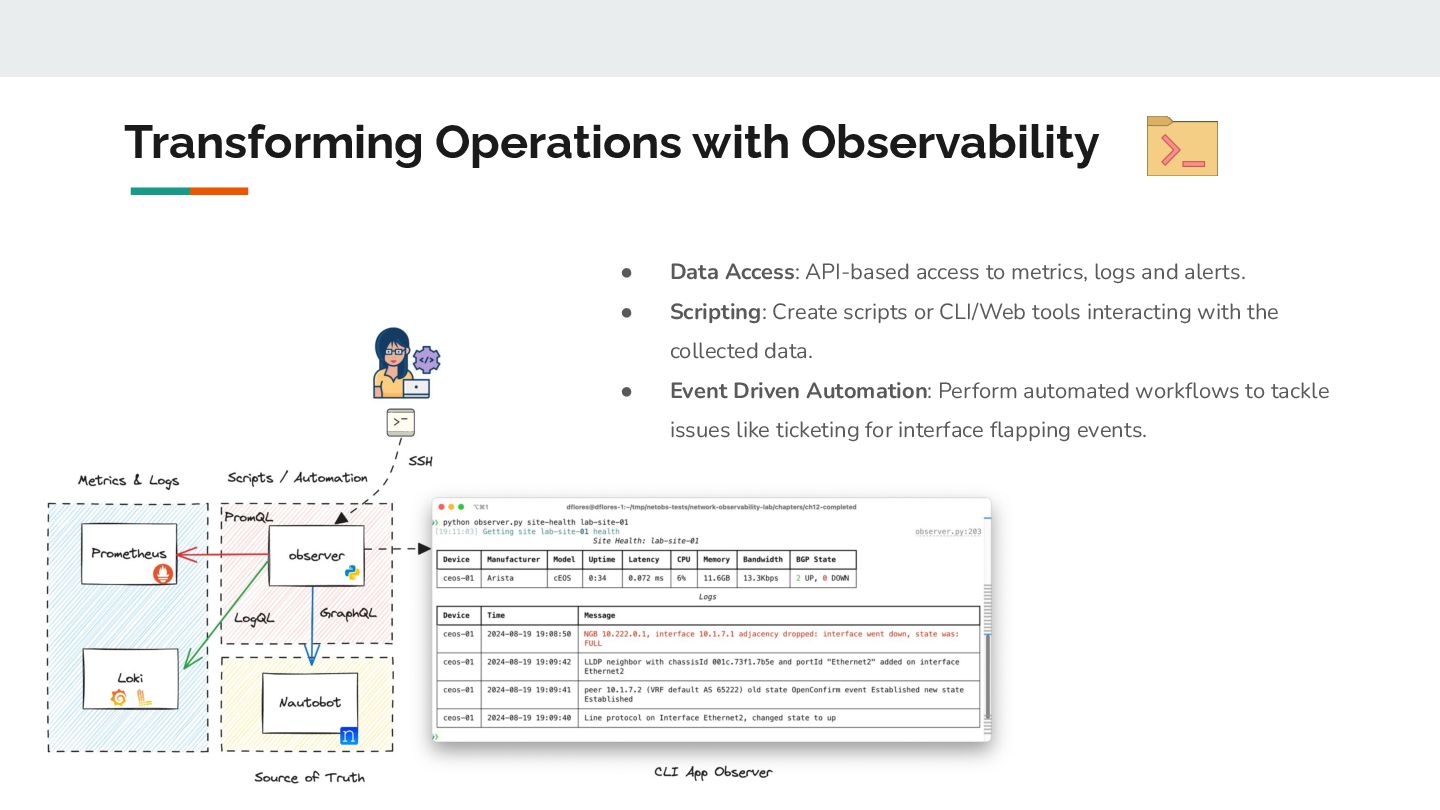
  8. Transforming Operations with Observability • Data Access: API-based access to

    metrics, logs and alerts. • Scripting: Create scripts or CLI/Web tools interacting with the collected data. • Event Driven Automation: Perform automated workflows to tackle issues like ticketing for interface flapping events.
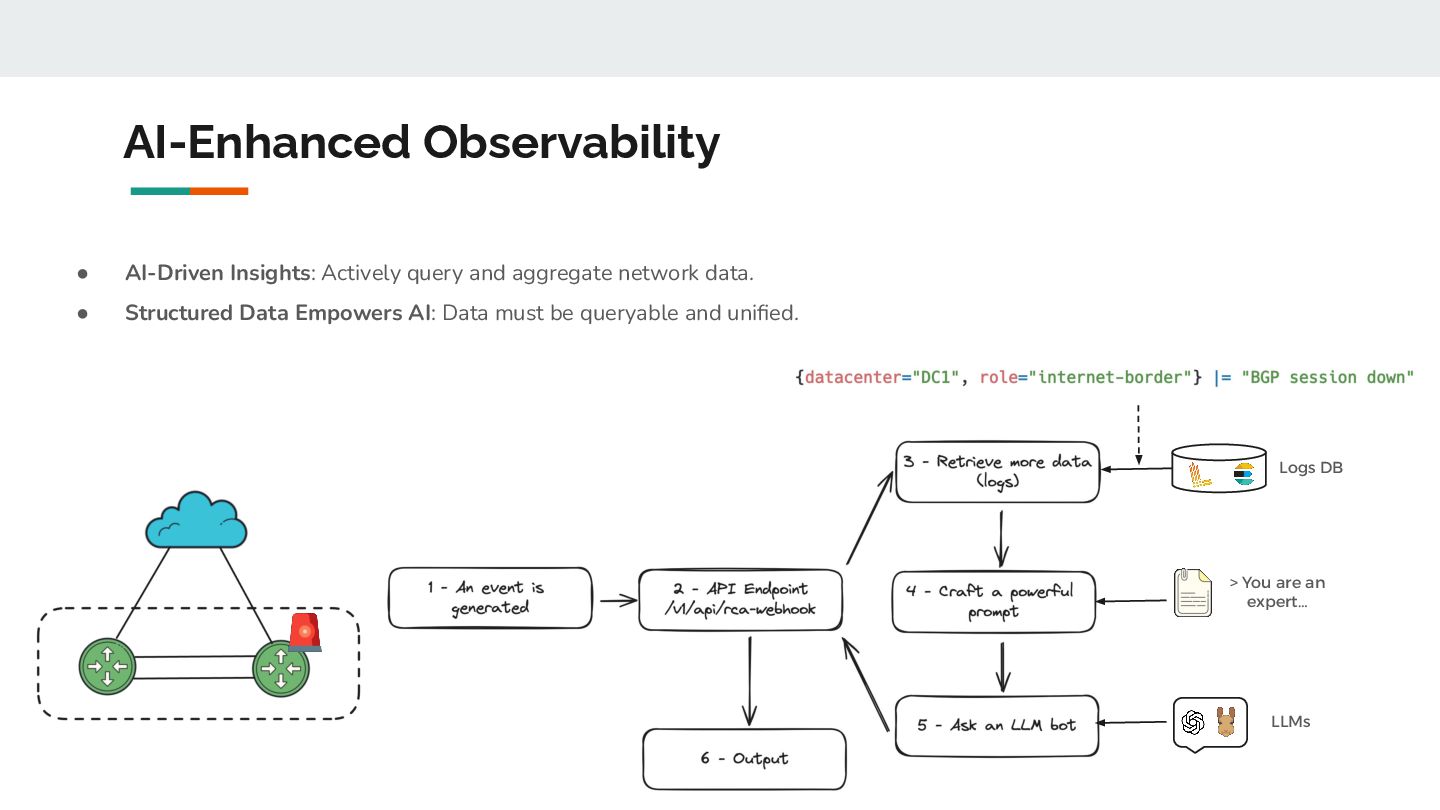
  9. AI-Enhanced Observability • AI-Driven Insights: Actively query and aggregate network

    data. • Structured Data Empowers AI: Data must be queryable and unified. > You are an expert… Logs DB LLMs
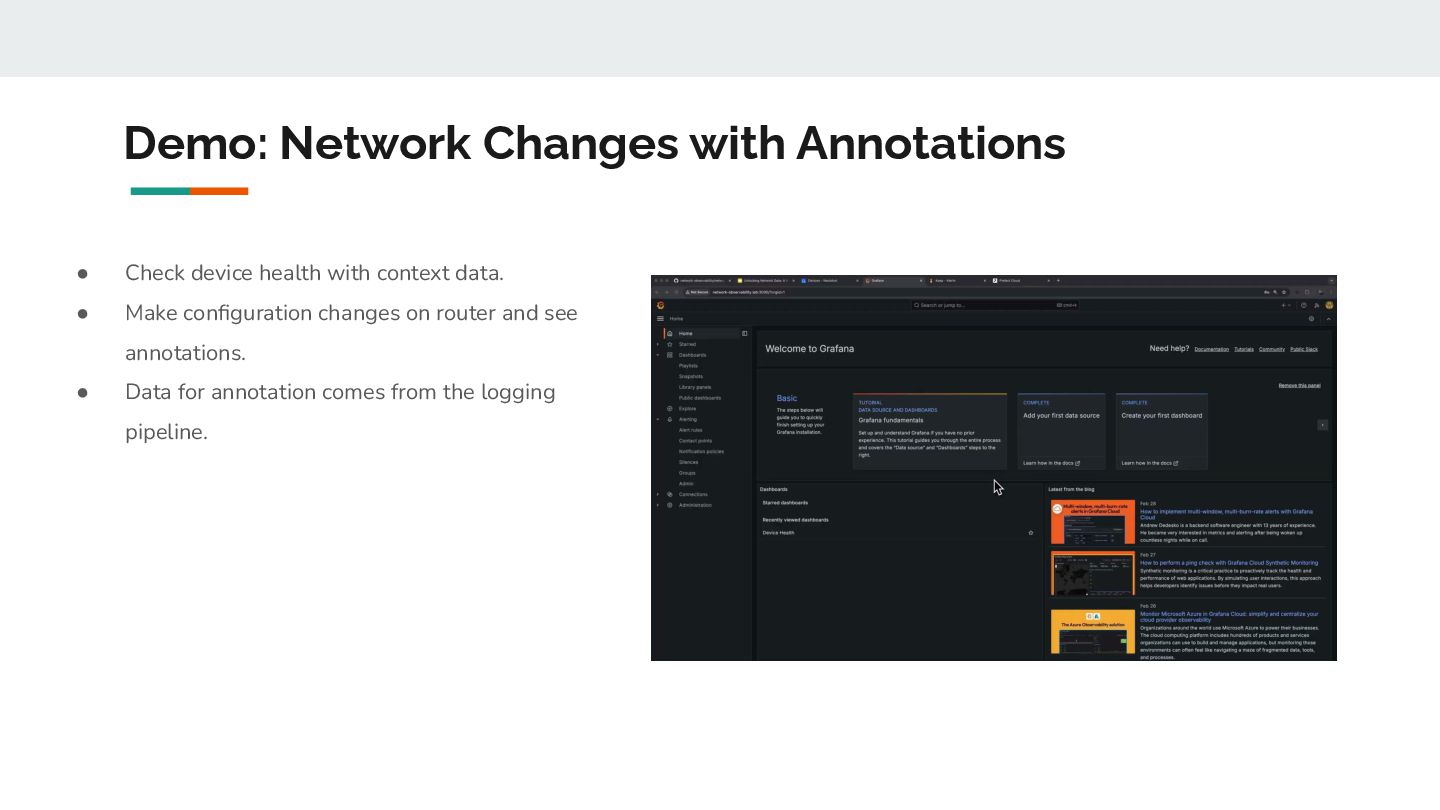
  10. Demo: Network Changes with Annotations • Check device health with

    context data. • Make configuration changes on router and see annotations. • Data for annotation comes from the logging pipeline.
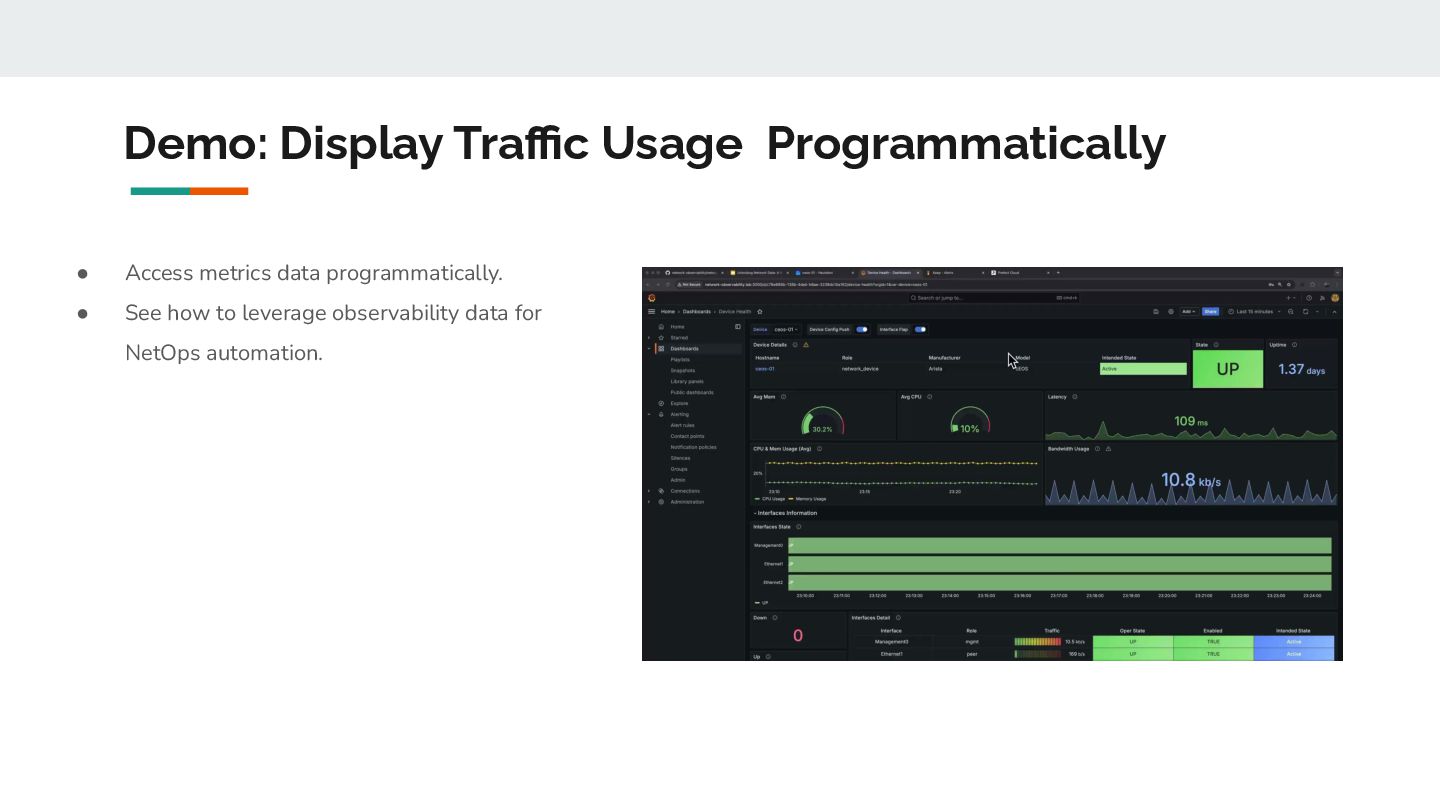
  11. Demo: Display Traffic Usage Programmatically • Access metrics data programmatically.

    • See how to leverage observability data for NetOps automation.
  12. Demo: Alerts using Logs and Automation • Create alerts out

    of log events (i.e. interface flaps) • Search through logs in a powerful way. • Send you alerts to your Alerts and Incident Management (i.e. KeepHQ). • Automate Operations ◦ Execute automated workflows from alerts coming from your system. ◦ Leverage workflow orchestrators (i.e. Prefect, Ansible EDA)
  13. But wait….. • Scale: Great for PoC, but what about

    hundreds/thousand of devices…. • Management Overhead: Do I need to manage now all of this? • Expertise: What do I need to learn now?
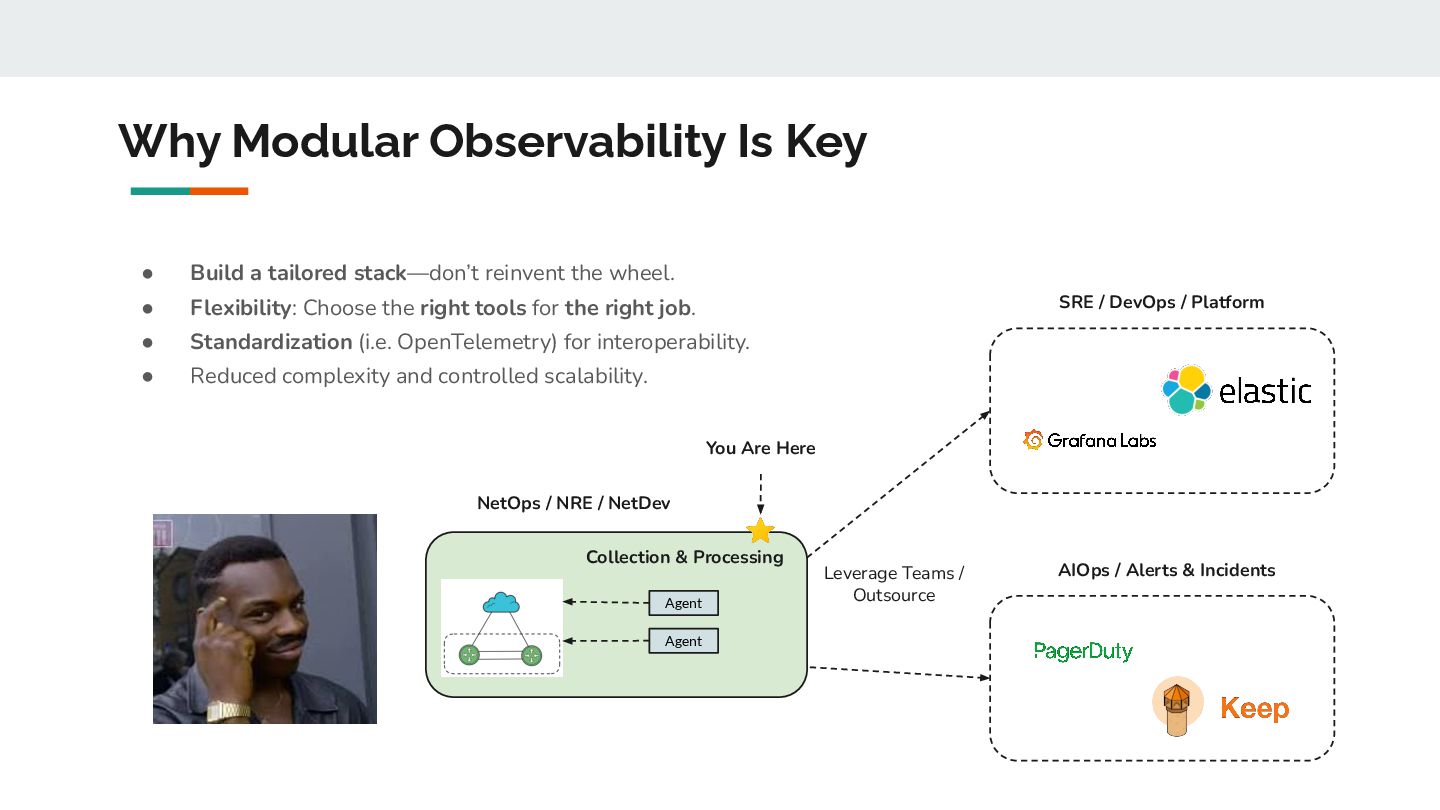
  14. Why Modular Observability Is Key • Build a tailored stack—don’t

    reinvent the wheel. • Flexibility: Choose the right tools for the right job. • Standardization (i.e. OpenTelemetry) for interoperability. • Reduced complexity and controlled scalability. SRE / DevOps / Platform AIOps / Alerts & Incidents NetOps / NRE / NetDev Collection & Processing Agent Agent Leverage Teams / Outsource You Are Here
  15. Do you want to test it? • Setup a PoC

    https://github.com/network-observability/network-observability-lab