Embedding for Contrasting Meaning Zhigang Chen, Wei Lin, Qian Chen, Ziaoping Chen, Si Wei, Hui Jiang and Xiaodan Zhu Proceedings of the 53th Annual Meeting of the Association for Computational Linguistics and the 7th International Joint Conference on Natural language processing, p106-115
semantics • This embedding models achieve 92% F-score on the GRE dataset, which is “most contrasting word” questions (Mohammad et al.,2008) • Direction for this basic semantics modeling problem.
have different definitions in the literature. – Contrasting word pairs having some non-zero degree of binary incompatibility • Word Embedding • Modeling Contrasting Meaning – PILSA (Yih et al., 2012) get a further improvement on the GRE benchmark, where an 81% of F-score – Bayesian probabilistic tensor factorization (Zhang et al., 2014)
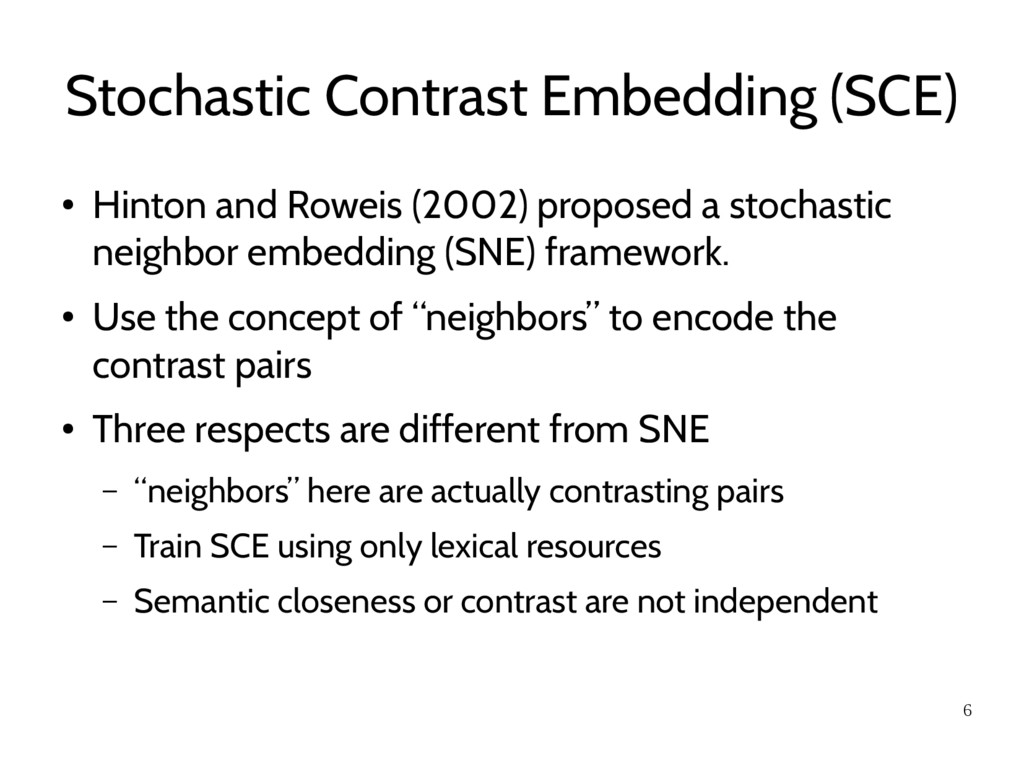
proposed a stochastic neighbor embedding (SNE) framework. • Use the concept of “neighbors” to encode the contrast pairs • Three respects are different from SNE – “neighbors” here are actually contrasting pairs – Train SCE using only lexical resources – Semantic closeness or contrast are not independent
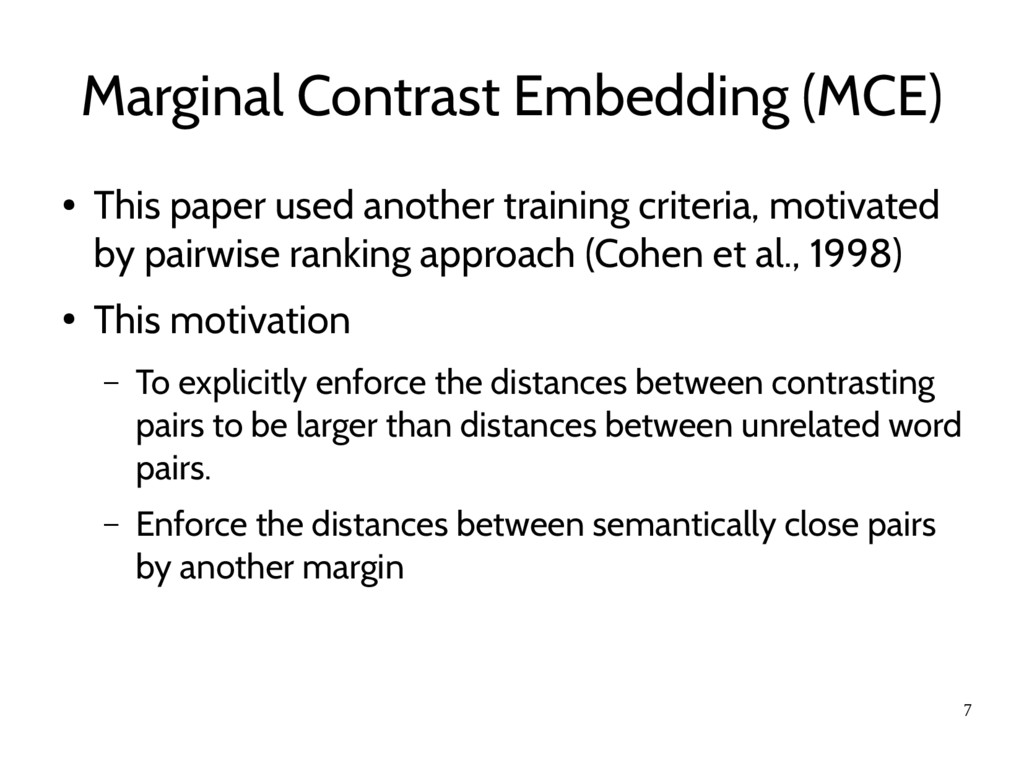
training criteria, motivated by pairwise ranking approach (Cohen et al., 1998) • This motivation – To explicitly enforce the distances between contrasting pairs to be larger than distances between unrelated word pairs. – Enforce the distances between semantically close pairs by another margin
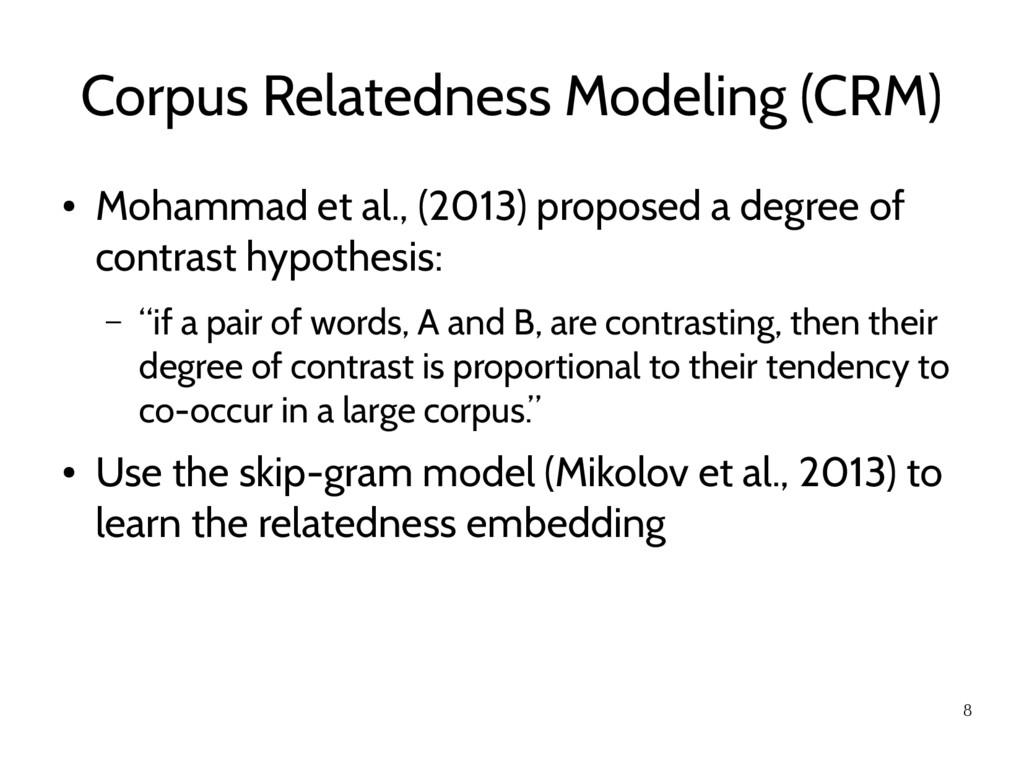
proposed a degree of contrast hypothesis: – “if a pair of words, A and B, are contrasting, then their degree of contrast is proportional to their tendency to co-occur in a large corpus.” • Use the skip-gram model (Mikolov et al., 2013) to learn the relatedness embedding
et al.,(1957) identified three dimensions of semantic that account for most of the variation in the connotative meaning of adjective. • Three dimensions – Evaluative: good-bad – Potency: strong-weak – Activity: active-passive
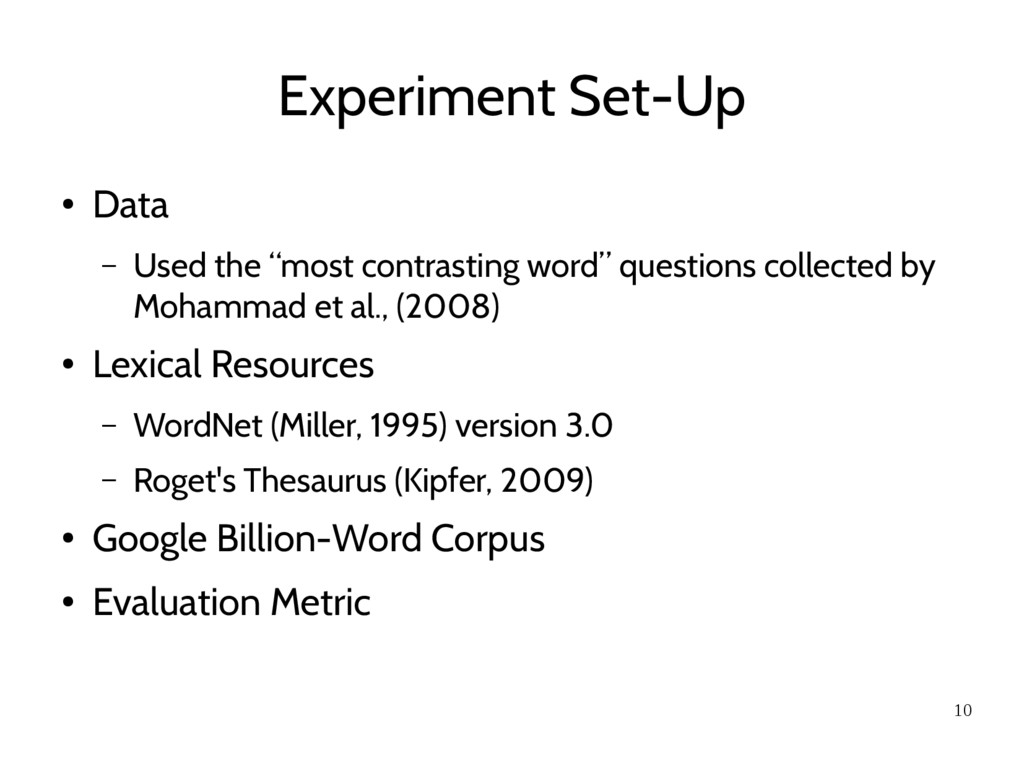
word” questions collected by Mohammad et al., (2008) • Lexical Resources – WordNet (Miller, 1995) version 3.0 – Roget's Thesaurus (Kipfer, 2009) • Google Billion-Word Corpus • Evaluation Metric
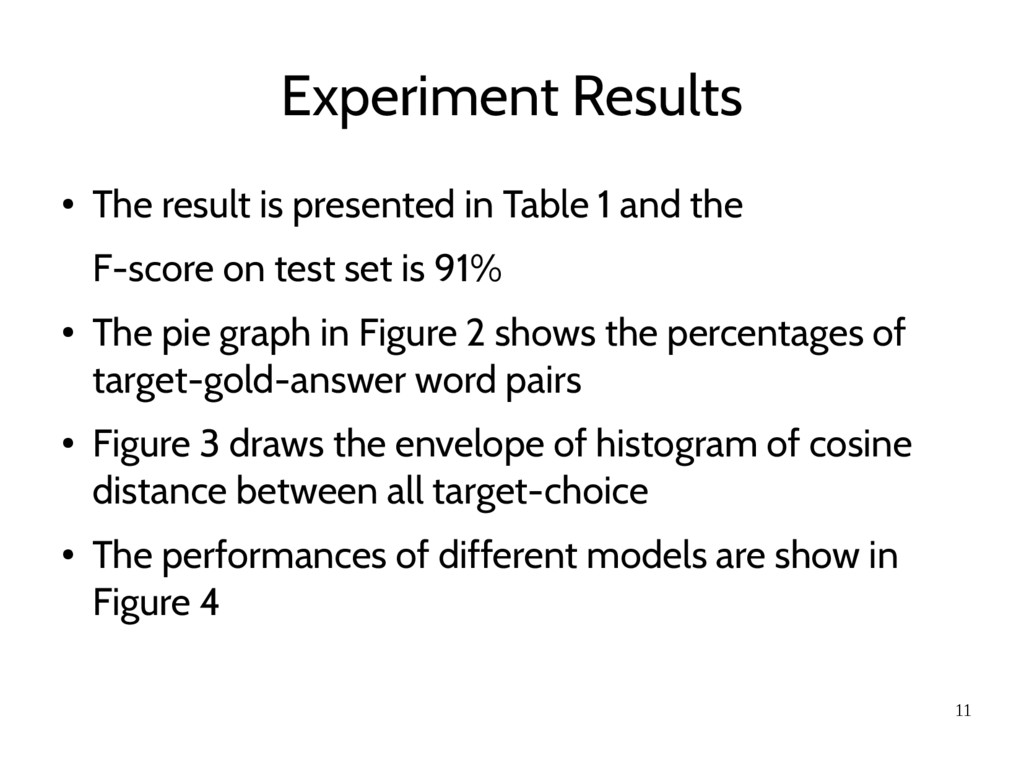
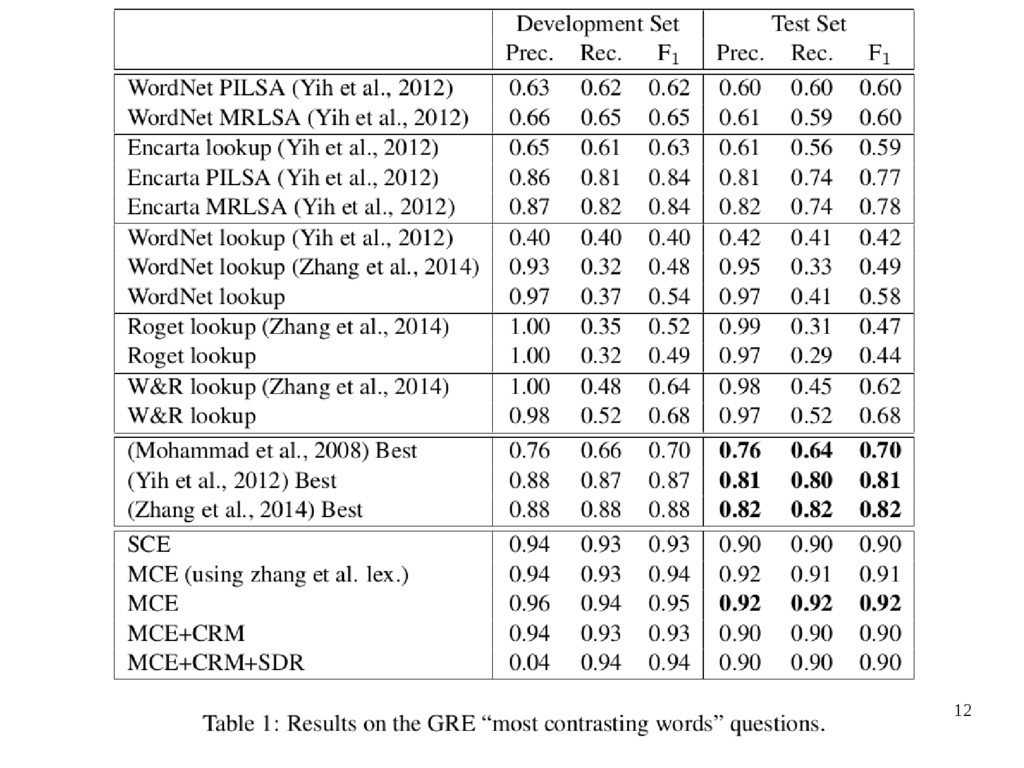
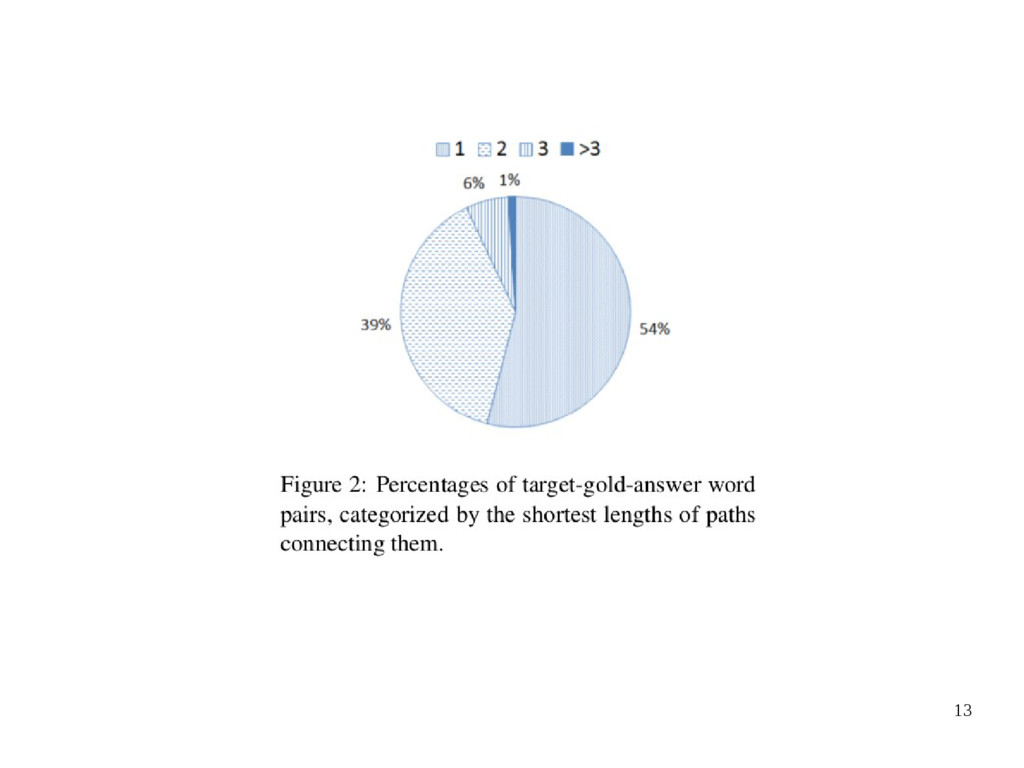
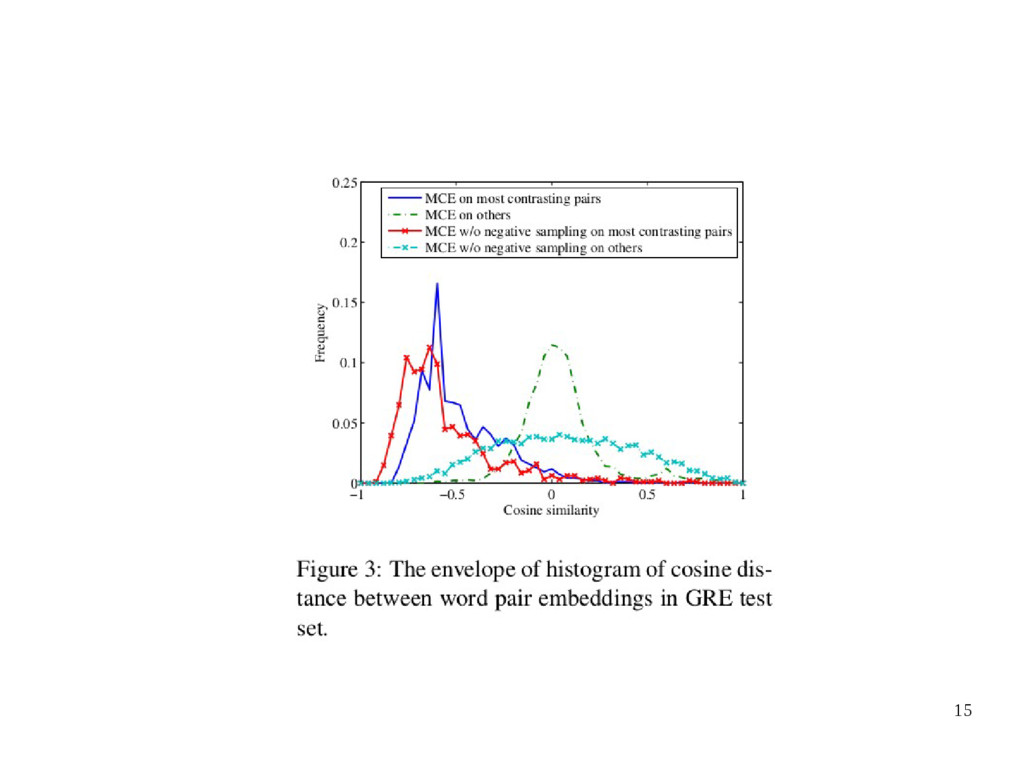
1 and the F-score on test set is 91% • The pie graph in Figure 2 shows the percentages of target-gold-answer word pairs • Figure 3 draws the envelope of histogram of cosine distance between all target-choice • The performances of different models are show in Figure 4