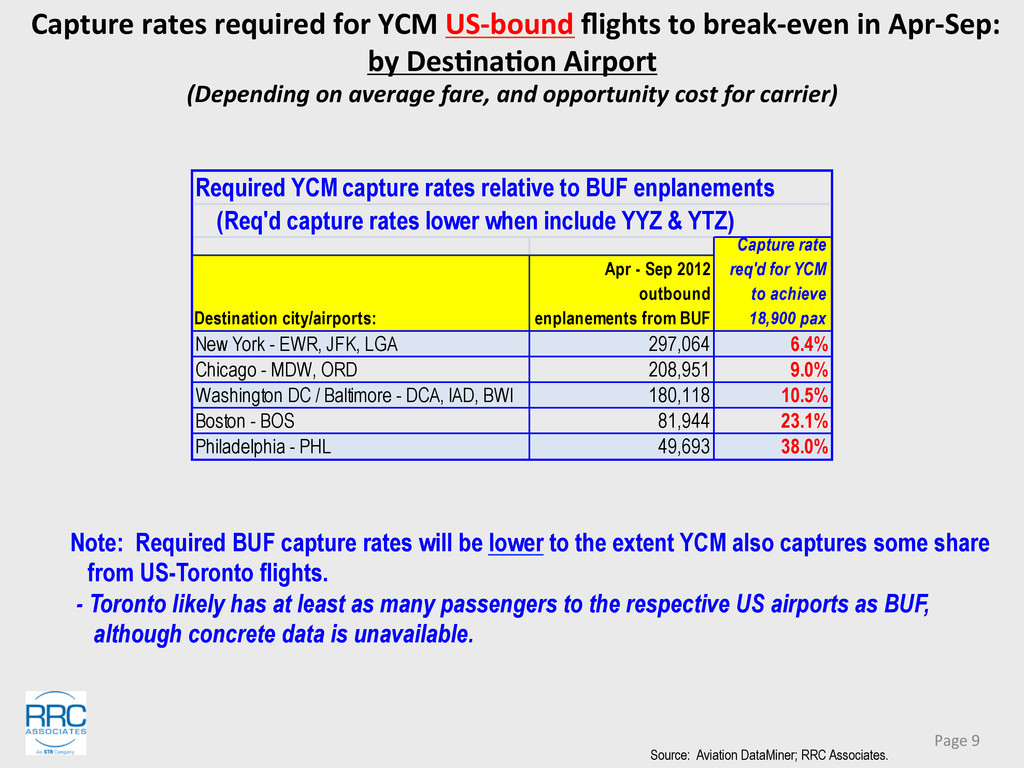
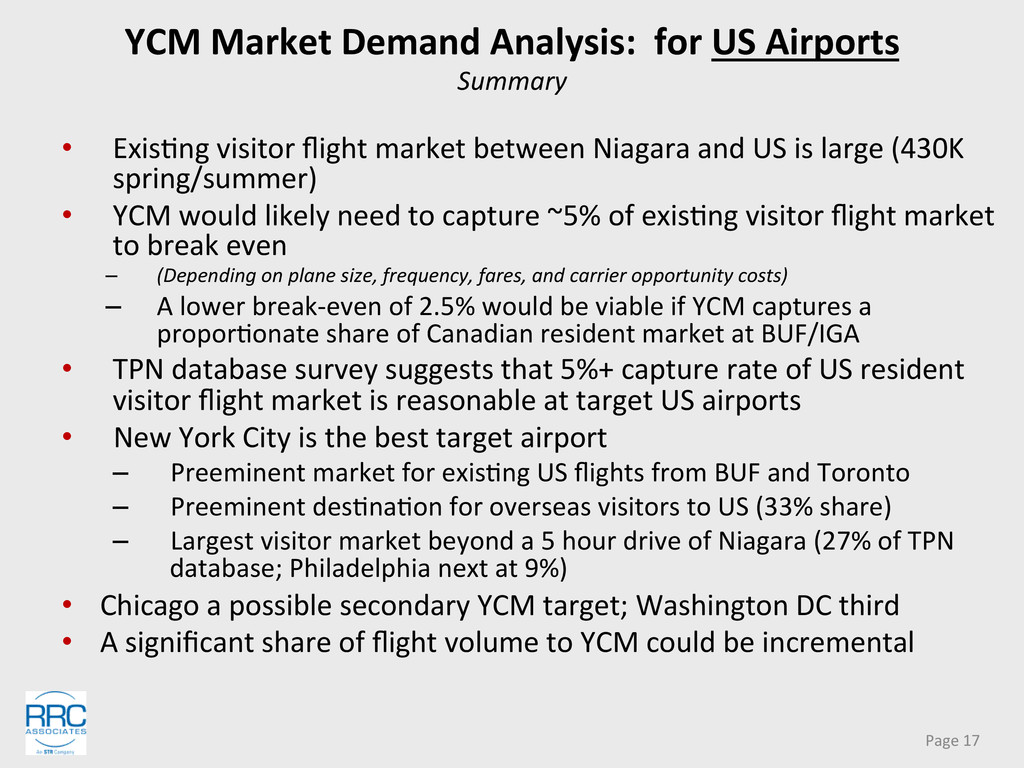
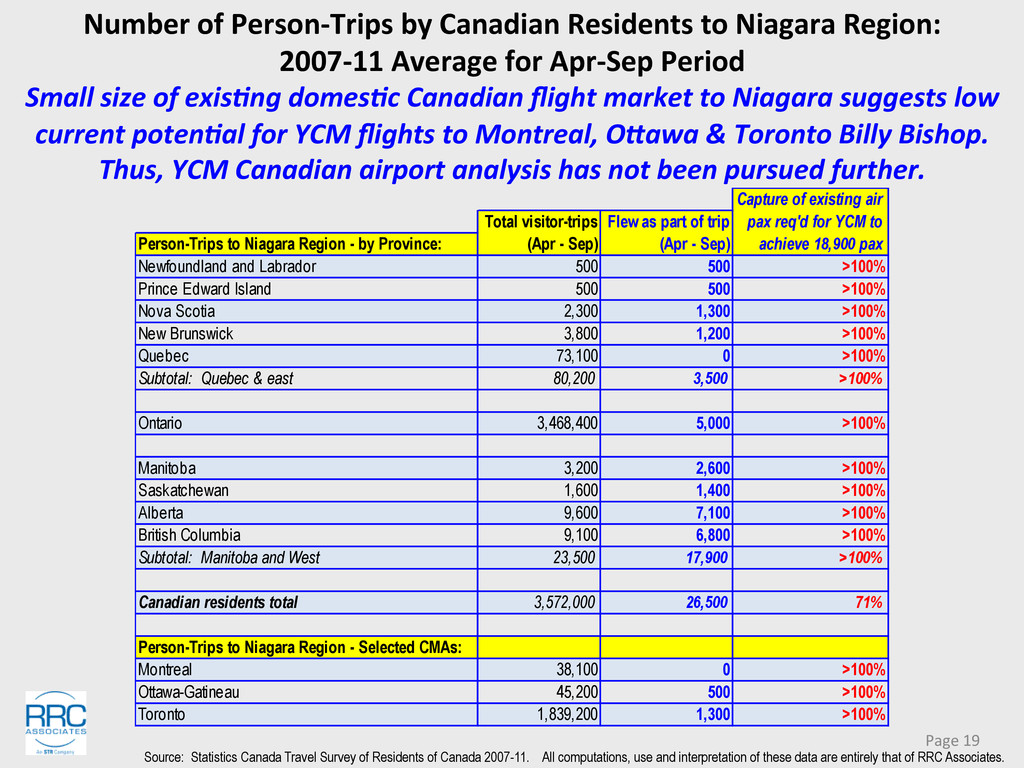
Upgrade to Pro — share decks privately, control downloads, hide ads and more …

Air Flight Feasibility Research for YCM

niagararto
May 02, 2013
130

Air Flight Feasibility Research for YCM

niagararto

May 02, 2013
Tweet

Transcript

  1. YCM  Market  Analysis:  Objec5ves   •  Evaluate  the  demand  for

     flight  service  to   Niagara  District  Airport  (YCM).   •  Analyze  the  potenAal  for  flight  use  to  YCM   from  airports  within  an  800km  radius.    IniAal   target  markets  include  OHawa,  Montreal  and   New  York  City.   •  Evaluate  the  tourism  industry’s  capacity  to   support  flight  service  including  visitor  services   such  as  ground  transportaAon;  compelling   experiences;  and  markeAng.     Page  1  
  2. Background:    How  do  people  travel?   (Generally  –  not

     Niagara  specific)   Page  2   97.2% 94.3% 85.9% 61.8% 42.3% 31.5% 14.8% 0.2% 1.5% 10.3% 33.7% 55.2% 65.6% 82.1% 2.7% 4.2% 3.8% 4.4% 2.5% 2.9% 3.2% 0% 10% 20% 30% 40% 50% 60% 70% 80% 90% 100% 50 - 150 miles 150 -250 miles 250 -500 miles 500-749 miles 750-999 miles 1,000-1,499 miles 1,500+ miles One-Way Travel Distance US Residents: Mode of Travel by One-Way Travel Distance, 2001 Personal vehicle Air Bus, train, other Source: 2001 National Travel Survey, US Department of Transportation; RRC Associates.
  3. Exploratory  YCM  target  airports  in  250-­‐500  mi  radius   (Plus

     YTZ  –  Toronto  Billy  Bishop)   Page  3   Source: ESRI; RRC Associates.
  4. YCM  Market  Analysis:  Outline   •  Evaluate  potenAal  for  flights

     between  YCM  and  US   airports  (market  share  approach):   1.  IdenAfy  overall  size  of  exisAng  flight  market   2.  Evaluate  YCM  capture  rates  required  for  flights  to   break  even  financially   3.  Evaluate  interest  by  exisAng  Niagara  visitors/   prospects  in  YCM  flights  (survey)   4.  Evaluate  potenAal  incremental  demand  sAmulated  by   YCM  flights  (survey)   •  Evaluate  potenAal  for  flights  between  YCM  and   Canadian  airports:       –  (Similar  process  as  for  US  airports)   Page  4  
  5. Page  5   Size  of  Exis5ng  Niagara  Flight  Market  To/From

     US  Airports     Existing Enplanements (approx.) Market Annual Apr - Sep 1 US / overseas visitors to Niagara flying to BUF 300,000 230,000 2 US / overseas visitors to Niagara flying to Toronto from US 230,000 170,000 Subtotal: US / overseas visitors flying in US en route to Niagara 530,000 400,000 3 Canadian residents flying out of BUF & IAG 905,000 375,000 Grand total 1,435,000 775,000 Sources: 1. RRC Associates, based on several extrapolation methods 2. Stats Canada - Int'l Traveler Survey (2007-11 annual avg). (All computations, use and interpretation of these data are entirely that of RRC Associates.) 3. Canadian Airports Council, March 20, 2012; Stats Canada Canadian Resident Travel Survey 2007-11; RRC Associates.
  6. Size  of  Exis+ng  Niagara  Flight  Market     SUPPORTING  DETAIL

        Strong  inbound  pax  to  BUF  in  summer  à  Indicator  of  summer  visitors   Page  6   Source: US Department of Transportation, including Origin and Destination Survey; Aviation DataMiner; RRC Associates. 23% 25% 17% 26% 26% 27% 27% 25% 32% 24% 24% 24% 0% 5% 10% 15% 20% 25% 30% 35% 2011 Total US domestic and international enplanements 2011 BUF enplanements - originating in BUF 2011 BUF enplanements - originating at other airports Percent of Annual Enplanements 2011 Quarter 1 (Jan -Mar) 2011 Quarter 2 (Apr - Jun) 2011 Quarter 3 (Jul - Sep) 2011 Quarter 4 (Oct - Dec) }  U.S. overall: Moderate summer peak (vacation travel) }  BUF outbound: Moderate winter/spring peak (snowbirds) }  BUF inbound (above Q1 baseline): Niagara tourists (roughly) BUF inbound (below Q1 baseline): Year-round background traffic (business, etc.)
  7. YCM  Market  Analysis:  Outline   •  Evaluate  potenAal  for  flights

     between  YCM  and  US   airports:   1.  IdenAfy  overall  size  of  exisAng  flight  market   2.  Evaluate  YCM  capture  rates  required  for  flights  to   break  even   3.  Evaluate  interest  by  exisAng  Niagara  visitors/ prospects  in  YCM  flights  (survey)   4.  Evaluate  potenAal  incremental  demand  sAmulated  by   YCM  flights  (survey)   •  Evaluate  potenAal  for  flights  between  YCM  and   Canadian  airports:       –  (Similar  process  as  for  US  airports)   Page  7  
  8.  Capture  rates  required  for  YCM  US-­‐bound  flights  to  break  even

     in  Apr-­‐Sep   (Depending  on  plane  size  &  frequency,  average  fare,  and  opportunity  cost  for  carrier)   Page  8   Source: Statistics Canada International Travel Survey 2007-11; RRC Associates. All computations, use and interpretation of these data are entirely that of RRC Associates. YCM pax required to break-even: Days in Apr - Sep service period: 180 Seats / day (2 flights @ 75 seats each): 150 Target load factor: 70% Demand required to break even on Apr - Sep flights: 18,900 YCM capture rates required to break even: Existing Enplanements Market Apr - Sep US / overseas visitors to Niagara flying to BUF 230,000 8.2% US / overseas visitors to Niagara flying to Toronto from US 170,000 11.1% Subtotal: US / overseas visitors to Niagara 400,000 4.7% Canadian residents flying out of BUF & IAG 375,000 5.0% Grand total 775,000 2.4% Capture rate req'd for YCM to achieve 18,900 pax
  9.  Capture  rates  required  for  YCM  US-­‐bound  flights  to  break-­‐even  in

     Apr-­‐Sep:   by  Des5na5on  Airport   (Depending  on  average  fare,  and  opportunity  cost  for  carrier)   Page  9   Source: Aviation DataMiner; RRC Associates. Note: Required BUF capture rates will be lower to the extent YCM also captures some share from US-Toronto flights. - Toronto likely has at least as many passengers to the respective US airports as BUF, although concrete data is unavailable. Required YCM capture rates relative to BUF enplanements (Req'd capture rates lower when include YYZ & YTZ) Destination city/airports: Apr - Sep 2012 outbound enplanements from BUF New York - EWR, JFK, LGA 297,064 6.4% Chicago - MDW, ORD 208,951 9.0% Washington DC / Baltimore - DCA, IAD, BWI 180,118 10.5% Boston - BOS 81,944 23.1% Philadelphia - PHL 49,693 38.0% Capture rate req'd for YCM to achieve 18,900 pax
  10. YCM  Market  Analysis:  Outline   •  Evaluate  potenAal  for  flights

     between  YCM  and  US   airports:   1.  IdenAfy  overall  size  of  exisAng  flight  market   2.  Evaluate  capture  rates  required  for  flights  to  break   even   3.  Evaluate  interest  by  exisAng  Niagara  visitors/   prospects  in  YCM  flights  (survey)   4.  Evaluate  potenAal  incremental  demand  sAmulated  by   YCM  flights  (survey)   •  Evaluate  potenAal  for  flights  between  YCM  and   Canadian  airports:       –  (Similar  process  as  for  US  airports)   Page  10  
  11.  To  what  degree  might  the  following  factors  increase  or  decrease

     your  interest   in  flying  to  Niagara  District  Airport  on  a  future  trip  to  the  Niagara  area?   Base:      US  residents  living  more  than  5  hours’  drive  from  Niagara  (n=98)       Page  11   Source: RRC Associates survey of TPN database, April 2013. - Sample frame: TPN email database, excluding southern Ontario (except including Toronto FSA). - Total response: n=904. (US – 398, Canada – 501, other countries – 5.) 3% 4% 6% 6% 8% 12% 17% 2% 7% 9% 19% 19% 18% 51% 72% 58% 71% 59% 48% 51% 17% 12% 20% 9% 9% 11% 9% 29% 9% 8% 4% 5% 9% 5% -40% -20% 0% 20% 40% 60% 80% 100% Airport is approximately 15 minutes drive from primary attractions in the Niagara, Canada region Airport is located on the Canadian side of the Canada/US border Small size of airport (less busy, but limited services) Passengers may need to walk across the tarmac between the terminal building and the plane (no passenger boarding bridges) Limited selection of flights (e g 1 or 2 flights per day) Round-trip airfare to YCM may be $50-$75 higher than airfare to other airports in the region (e g Buffalo, Toronto, etc ) Flights might be on 20-70 seat turboprop (propeller) planes Greatly decreases my interest in using YCM Slightly decreases my interest in using YCM No impact on my interest in using YCM Slightly increases my interest in using YCM Greatly increases my interest in using YCM
  12.  Likelihood  of  Flying  to  YCM  from/through  Selected  Ci5es   on

     a  Future  Trip  to  Niagara   Page  12   Source: RRC Associates survey of TPN database, April 2013. Base: US residents living more than 5 hour drive from Niagara (n=98) Likelihood of using flight from YCM to City Newark Chicago Washington DC Boston 0 - Not at all likely 66% 69% 70% 72% Unlikely (1 - 4) 9% 7% 8% 10% Possibly (5, 6) 12% 11% 15% 10% Somewhat likely (7, 8) 7% 6% 5% 2% Very likely (9, 10 - extremely likely) 5% 6% 2% 5% Total 100% 100% 100% 100% % Very/somewhat likely (7 to 10) 12% 13% 7% 7%
  13. Likelihood  of  Flying  to  YCM  from/through  Selected  Ci5es   on

     a  Future  Trip  to  Niagara:     Page  13   Source: RRC Associates survey of TPN database, April 2013. Base: US residents very likely to fly* on future trip to Niagara (n=18) *9 or 10 on 0-10 likelihood scale Note: Caution required due to small sample size Likelihood of using flight from YCM to City Newark Chicago Washington DC Boston 0 - Not at all likely 50% 76% 59% 53% Unlikely (1 - 4) 6% 6% 6% 18% Possibly (5, 6) 11% 12% 18% 18% Somewhat likely (7, 8) 22% 6% 12% 6% Very likely (9, 10 - extremely likely) 11% 0% 6% 6% Total 100% 100% 100% 100% % Very/somewhat likely (7 to 10) 33% 6% 18% 12%
  14. YCM  Market  Analysis:  Outline   •  Evaluate  potenAal  for  flights

     between  YCM  and  US   airports:   1.  IdenAfy  overall  size  of  exisAng  flight  market   2.  Evaluate  YCM  capture  rates  required  for  flights  to   break  even   3.  Evaluate  interest  by  exisAng  Niagara  visitors/   prospects  in  YCM  flights  (survey)   4.  Evaluate  potenAal  incremental  demand  sAmulated  by   YCM  flights  (survey)   •  Evaluate  potenAal  for  flights  between  YCM  and   Canadian  airports:       –  (Similar  process  as  for  US  airports)   Page  14  
  15. Likelihood  of    Visi5ng  Niagara  Region  More  Frequently   or

     Taking  Longer  Trips  to  the  Niagara  Region   if  Flights  to  YCM  from  Newark/Chicago/DC/Boston  Were  Available     Page  15   Source: RRC Associates survey of TPN database, April 2013. Base: US residents living more than 5 hour drive from Niagara (n=98) Likelihood of visiting the Niagara region more frequently Likelihood of taking longer trips to the Niagara region 0 - Not at all likely 49% 49% Unlikely (1 - 4) 12% 10% Possibly (5, 6) 22% 22% Somewhat likely (7, 8) 7% 9% Very likely (9, 10 - extremely likely) 9% 11% Total 100% 100% % Very/somewhat likely (7 to 10) 16% 19%
  16. Likelihood  of    Visi5ng  Niagara  Region  More  Frequently   or

     Taking  Longer  Trips  to  the  Niagara  Region   if  Flights  to  YCM  from  Newark/Chicago/DC/Boston  Were  Available     Page  16   Source: RRC Associates survey of TPN database, April 2013. Base: US residents very likely to fly* on future trip to Niagara (n=18) *9 or 10 on 0-10 likelihood scale Note: Caution required due to small sample size Likelihood of visiting the Niagara region more frequently Likelihood of taking longer trips to the Niagara region 0 - Not at all likely 22% 24% Unlikely (1 - 4) 6% 6% Possibly (5, 6) 22% 24% Somewhat likely (7, 8) 28% 24% Very likely (9, 10 - extremely likely) 22% 24% Total 100% 100% % Very/somewhat likely (7 to 10) 50% 47%
  17. YCM  Market  Demand  Analysis:    for  US  Airports   Summary

      Page  17   •  ExisAng  visitor  flight  market  between  Niagara  and  US  is  large  (430K   spring/summer)   •  YCM  would  likely  need  to  capture  ~5%  of  exisAng  visitor  flight  market   to  break  even   –  (Depending  on  plane  size,  frequency,  fares,  and  carrier  opportunity  costs)       –  A  lower  break-­‐even  of  2.5%  would  be  viable  if  YCM  captures  a   proporAonate  share  of  Canadian  resident  market  at  BUF/IGA   •  TPN  database  survey  suggests  that  5%+  capture  rate  of  US  resident   visitor  flight  market  is  reasonable  at  target  US  airports   •  New  York  City  is  the  best  target  airport   –  Preeminent  market  for  exisAng  US  flights  from  BUF  and  Toronto   –  Preeminent  desAnaAon  for  overseas  visitors  to  US  (33%  share)   –  Largest  visitor  market  beyond  a  5  hour  drive  of  Niagara  (27%  of  TPN   database;  Philadelphia  next  at  9%)   •  Chicago  a  possible  secondary  YCM  target;  Washington  DC  third       •  A  significant  share  of  flight  volume  to  YCM  could  be  incremental  
  18. YCM  Market  Analysis:  Outline   •  Evaluate  potenAal  for  flights

     between  YCM  and  US   airports:   1.  IdenAfy  overall  size  of  exisAng  flight  market   2.  Evaluate  YCM  capture  rates  required  for  flights  to   break  even   3.  Evaluate  interest  by  exisAng  Niagara  visitors/ prospects  in  YCM  flights  (survey)   4.  Evaluate  potenAal  incremental  demand  sAmulated  by   YCM  flights  (survey)   •  Evaluate  potenAal  for  flights  between  YCM  and   Canadian  airports:       –  (Similar  process  as  for  US  airports)   Page  18  
  19. Number  of  Person-­‐Trips  by  Canadian  Residents  to  Niagara  Region:  

    2007-­‐11  Average  for  Apr-­‐Sep  Period   Small  size  of  exis+ng  domes+c  Canadian  flight  market  to  Niagara  suggests  low   current  poten+al  for  YCM  flights  to  Montreal,  OQawa  &  Toronto  Billy  Bishop.   Thus,  YCM  Canadian  airport  analysis  has  not  been  pursued  further.   Page  19   Total visitor-trips Flew as part of trip Person-Trips to Niagara Region - by Province: (Apr - Sep) (Apr - Sep) Newfoundland and Labrador 500 500 >100% Prince Edward Island 500 500 >100% Nova Scotia 2,300 1,300 >100% New Brunswick 3,800 1,200 >100% Quebec 73,100 0 >100% Subtotal: Quebec & east 80,200 3,500 >100% Ontario 3,468,400 5,000 >100% Manitoba 3,200 2,600 >100% Saskatchewan 1,600 1,400 >100% Alberta 9,600 7,100 >100% British Columbia 9,100 6,800 >100% Subtotal: Manitoba and West 23,500 17,900 >100% Canadian residents total 3,572,000 26,500 71% Person-Trips to Niagara Region - Selected CMAs: Montreal 38,100 0 >100% Ottawa-Gatineau 45,200 500 >100% Toronto 1,839,200 1,300 >100% Capture of existing air pax req'd for YCM to achieve 18,900 pax Source: Statistics Canada Travel Survey of Residents of Canada 2007-11. All computations, use and interpretation of these data are entirely that of RRC Associates.
  20. Niagara  Tourism  Industry’s  Capacity  to  Support   YCM  Flight  Service

      •  Industry  representaAves  expressed  high  confidence  in   area’s  capacity  to  support  YCM  flight  service:   –  Strong  belief  in  diversity  and  quality  of  tourism  product   (Falls  and  other  draws),  ability  to  provide  ground   transportaAon  services,  and  ability  of  industry  players  to   work  together   –  Strong  interest  and  support  for  air  service,  parAcularly  to   New  York  City  &  in  peak  season  (concern  about  off-­‐season)   –  Some  concern  expressed  about  ensuring  that  YCM  faciliAes   are  up  to  visitor  expectaAons  prior  to  flight  iniAaAon   –  Some  expressed  need  for  support  for  airport/air  service  at   upper  governmental  levels   –  Some  expressed  need  for  an  individual  person  or  commiHee   to  champion  air  service  to  ensure  it  occurs     Page  20  
  21. THANK YOU Niagara District Airport (YCM): Analysis of Potential Market

    Demand for Commercial Flight Service Tourism  Partnership  of  Niagara  –  Annual  MeeAng   Americana  Resort   May  1,  2013  
  22. Primary  YCM  target  air  market:    Beyond  5  hour  drive

     5me   Page  22   Source: ESRI; RRC Associates.
  23. Size  of  Exis+ng  Niagara  Flight  Market  To/From  US  Airports  

    SUPPORTING  DETAIL     Page  23   •  US/Overseas  flight  market  from  US  to  BUF/ Toronto  inferred  from:   1.  Niagara  Falls  US:    US  Visitor  Survey     2.  StaAsAcs  Canada  US  Traveler  Survey   3.  StaAsAcs  Canada  Overseas  Traveler  Survey   4.  Buffalo/Niagara  Airport  enplanement  paHerns   (incorporaAng  both  US  &  overseas  visitors)   •  Canadian  resident  leakage  to  Buffalo-­‐area   airports:    data  from  Canadian  Airports  Council   •  SupporAng  data  from  each  source  is  provided  in   the  slides  to  follow    
  24. Size  of  Exis+ng  Niagara  Flight  Market  To/From  US  Airports  

    SUPPORTING  DETAIL     Visitors  extrapola5on  method  #2  (Stats  Canada  US  Traveler  Survey):   Likely  268,000+  US  Resident  Person-­‐Trips  to  Niagara  Canada  via  Air   Page  24   Source: Statistics Canada Travel Survey of Residents of Canada 2007-11. All computations, use and interpretation of these data are entirely that of RRC Associates. 2007-11 Avg Annual US Person-Trips 3,177,000 Total Average Annual Person-Trips to Niagara by US Residents, 2007-11 DEFINITELY FLEW EN ROUTE TO NIAGARA: 132,600 Entered Canada via Toronto airports (Pearson and City Center) 2,800 Entered Canada via other Canadian airports 135,400 Total flew to Canadian airport LIKELY FLEW EN ROUTE TO NIAGARA: 111,600 Entered Canada via rental car via Niagara crossings (Port Erie, Rainbow, Whirlpool, Queenston) 19,200 Entered Canada via rental car via Windsor and Sarnia 2,600 Entered Canada via rental car via other crossing 133,400 Total entered Canada via rental car 268,800 Total definitely or likely flew en route to Niagara SOME PORTION POSSIBLY FLEW EN ROUTE TO NIAGARA: 1,726,900 Same day automobile 1,075,300 Private automobile 79,800 Bus 19,000 Other 4,200 Train 2,905,200 Total
  25. Size  of  Exis+ng  Niagara  Flight  Market  To/From  US  Airports  

    SUPPORTING  DETAIL     Visitors  extrapola5on  method  #3  (Stats  Canada  Overseas  Traveler  Survey):   Likely  145,700  Overseas  Resident  Person-­‐Trips  to  Niagara  Canada  that  are  candidates  for  YCM  service   Page  25   Source: Statistics Canada International Travel Survey 2007-11. All computations, use and interpretation of these data are entirely that of RRC Associates. Overseas Visitors to Niagara: 2007-11 Average Annual Person-Trips Route used to Route used to ENTER Canada EXIT Canada Direct from overseas: 564,700 646,700 - Flew to Toronto 458,100 521,200 - Flew to Montreal* 35,400 65,900 - Flew to Ottawa* 3,500 1,700 - Flew to Vancouver 46,400 39,500 - Other port 21,300 18,500 Via the US: 204,800 122,800 - Flew to Toronto** 98,000 43,000 - Flew to Montreal* 3,900 5,200 - Flew to Ottawa* 100 1,100 - On land: Niagara ports (Erie, Rainbow, etc.)** 47,700 58,100 - Other 55,000 15,300 Total overseas person-visits to Niagara region 769,500 769,500 *Possible candidates for YCM flights from Canadian airports **Possible candidates for YCM flights from US airports
  26. Size  of  Exis+ng  Niagara  Flight  Market  To/From  US  Airports  

      SUPPORTING  DETAIL     Extrapola5on  method  #4  (cont’d):    Analysis  of  BUF  enplanements   Est.  approx.  300,000  –  400,000  inbound  tourist  fliers  to  BUF  annually   (Inclusive  of  US  and  overseas  travelers)     Page  26   Source: US Department of Transportation, including Origin and Destination Survey; Aviation DataMiner; RRC Associates. 2011 passengers inbound to BUF (originating at other airports) 2011 Q1 baseline Quarter vs. Q1 baseline Quarter 1 (Jan - Mar) 181,000 181,000 0 Quarter 2 (Apr - Jun) 282,000 181,000 101,000 Quarter 3 (Jul - Sep) 341,000 181,000 160,000 Quarter 4 (Oct - Dec) 257,000 181,000 76,000 Total 1,061,000 724,000 337,000 <-- BUF incremental seasonal inbound enplanements (Rough indicator of tourist flight traffic)
  27. Size  of  Exis+ng  Niagara  Flight  Market  To/From  US  Airports  

      SUPPORTING  DETAIL   Canadian  Resident  Leakage  to  BUF  &  IAG   Page  27   •  Causes  of  Canadian  resident  leakage  to  US:   –  Price-­‐driven:    base  fare  &  taxes/fees/charges;  strength  of  Canadian  dollar  vs.  US   –  Low-­‐cost  carriers  at  US  border  airports   –  Aggressive  markeAng  and  airport  improvements  by  US  border  airports  &  airlines   –  (Anecdotal,  in  Niagara  region:  Toronto  InternaAonal  Airport  issues:    high  parking   costs,  long  lines  &  immigraAon  processing  Ame,  traffic  congesAon  on  roads)   Annual enplanements attributable to Canadians Share of total airport enplanements attributable to Canadians BUF 837,500 33% IAG (Niagara Falls Int'l) 67,500 85% Total 905,000 35% Source: "Why are Canadians Driving to US Airports? The Issue for Canada," March 20, 2012, Canadian Airports Council, Leakage Working Group Air Policy Committee. Note: BUF was cited as deriving a similar 36% of its passengers from Canada in 2009, per "An ominous flight pattern: Canadians opting for US airports," The Globe and Mail, Nov. 26, 2010.
  28. Size  of  Exis+ng  Niagara  Flight  Market     SUPPORTING  DETAIL

        Niagara  US:    23%  of  US  Overnight  Visitors  Fly  (2008)   Page  28   US resident overnight person-trips to Niagara, Canada: (If assume same air usage as Niagara Falls USA) 1,241,000 US resident overnight visitor person-trips to Niagara, Canada (2010 - Statistics Canada) 23% Travel by commercial air (if same as Niagara Falls, USA; per 2008 - Longwoods) 285,000 Approx. US resident overnight person-trips to Niagara CA by commercial air - if same share as Niagara US Note: Estimates exclude overseas visitors. Note: In 2010, there were an additional 1,850,400 same-day person trips to Niagara, Canada by US residents. Some portion (likely smaller) of these same-day US visitors likely flew to region as well. Note: 2002 DK Shifflet Top Line Travel Profile for Niagara Falls, US, found 20% of US visitors flew - similar to 23% Longwoods 2008 finding.