on the human dorsolateral prefrontal cortex Introduction Marker Finding Conclusions Acknowledgements We chose training genes for each method that were highly specific for each cell type using “Mean Ratio” 𝑀𝑒𝑎𝑛 𝑅𝑎𝑡𝑖𝑜 = 𝑚𝑒𝑎𝑛 𝐸𝑥𝑝𝑟𝑒𝑠𝑠𝑖𝑜𝑛 𝑜𝑓 𝑡𝑎𝑟𝑔𝑒𝑡 𝑐𝑒𝑙𝑙 𝑡𝑦𝑝𝑒 𝑚𝑒𝑎𝑛(𝐸𝑥𝑝𝑟𝑒𝑠𝑠𝑖𝑜𝑛 𝑖𝑛 ℎ𝑖𝑔ℎ𝑒𝑠𝑡 𝑛𝑜𝑛 − 𝑡𝑎𝑟𝑔𝑒𝑡 𝑐𝑒𝑙𝑙 𝑡𝑦𝑝𝑒) Establishing a Ground-Truth for Benchmarking Software Selection • Biancalani et al., Nature Methods, 2021, 10.1038/s41592-021-01264-7 • Kleshchevnikov et al., Nature Biotechnology, 2022, 10.1038/s41587-021-01139-4 • Elosua-Bayes et al., Nucleic Acids Res, 2021, 10.1093/nar/gkab043 • Carsen Stringer et al., Nature Methods, 2020, 10.1038/s41592-020-01018-x • Sriworarat et al., Manuscript in preparation, 2022. https://loopybrowser.com/ Method Output Tangram Biancalani et al., Nature Methods, 2021 Integer cell counts cell2location Kleshchevnikov et al., Nat Biotechnol, 2022 Mean abundance estimates SPOTlight Elosua-Bayes et al., Nucleic Acids Res, 2021 Proportion estimates Methods Deconvolution was performed with Tangram 1.0.2, cell2location 0.8a, and SPOTlight 1.0.0 following their respective tutorials, using training genes found by the mean ratio method. Cellpose 2.0 was used to segment IF images and sckit-learn 1.1.1 was used to quantify mean fluorescence and train the decision-tree classifier. • Different methods perform better on different metrics, with no conclusive overall winner • Cell-type composition of Visium spots may be accurately estimated by training a decision-tree-based model to classify segmented cells on IF images, using a few hundred manually labelled cells
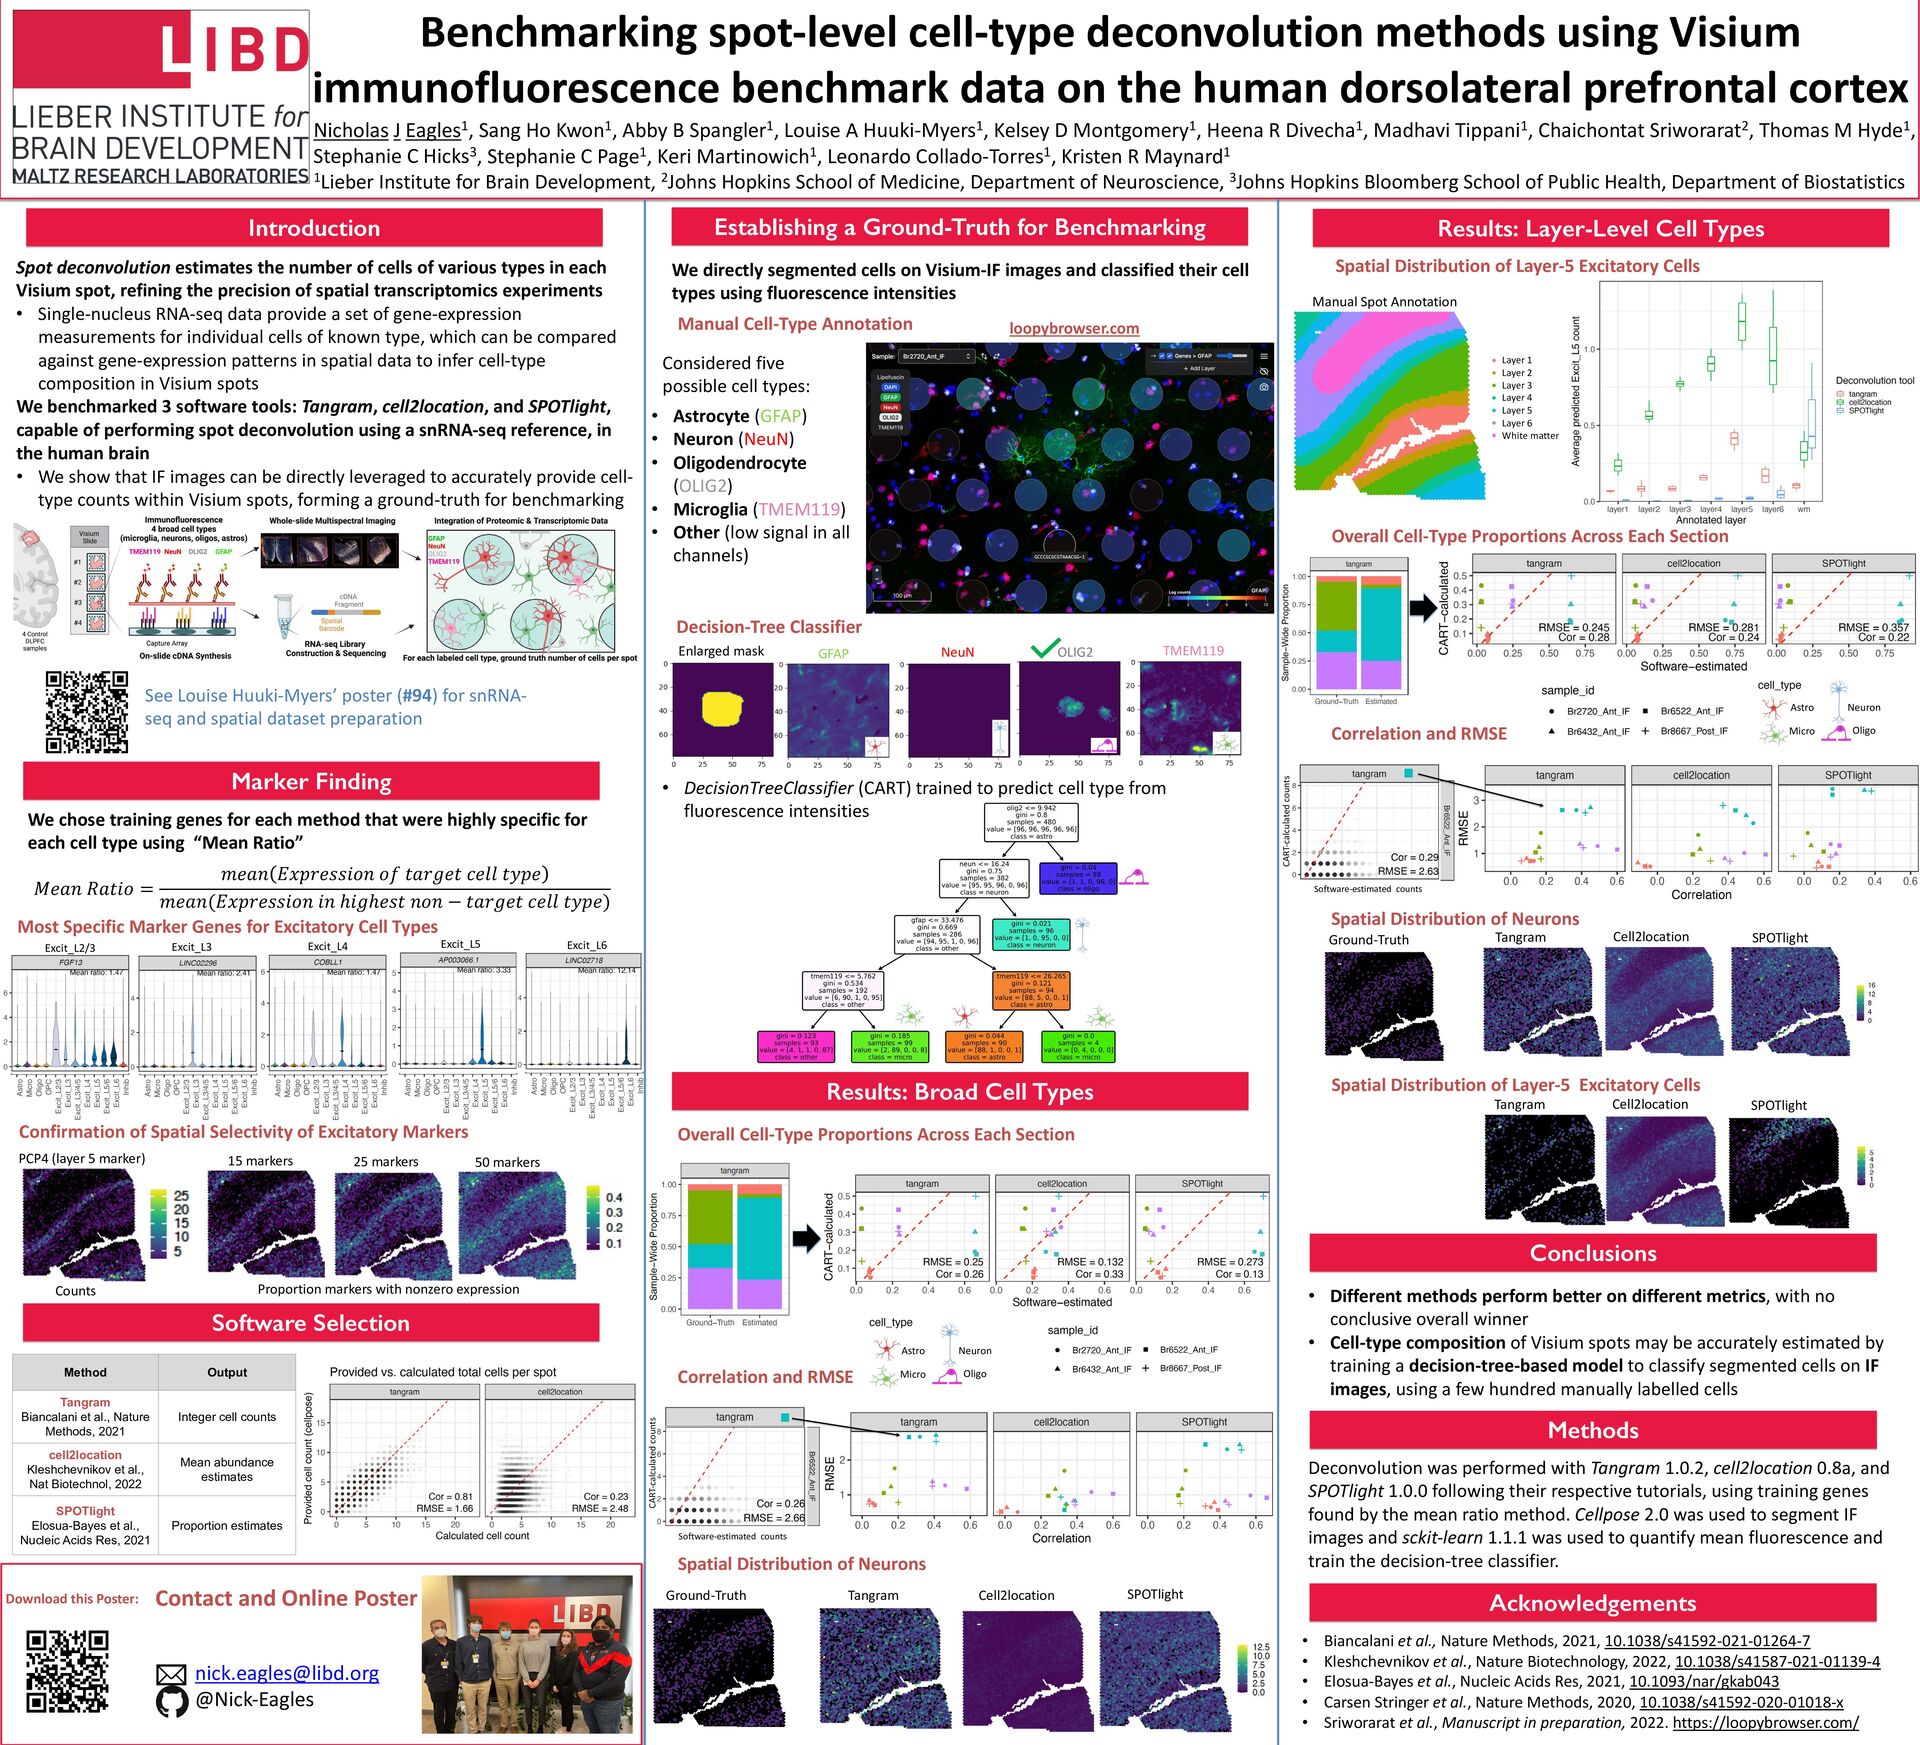
[email protected] @Nick-Eagles Download this Poster: Spot deconvolution estimates the number of cells of various types in each Visium spot, refining the precision of spatial transcriptomics experiments • Single-nucleus RNA-seq data provide a set of gene-expression measurements for individual cells of known type, which can be compared against gene-expression patterns in spatial data to infer cell-type composition in Visium spots We benchmarked 3 software tools: Tangram, cell2location, and SPOTlight, capable of performing spot deconvolution using a snRNA-seq reference, in the human brain • We show that IF images can be directly leveraged to accurately provide cell- type counts within Visium spots, forming a ground-truth for benchmarking We directly segmented cells on Visium-IF images and classified their cell types using fluorescence intensities Enlarged mask GFAP NeuN OLIG2 TMEM119 Considered five possible cell types: • Astrocyte (GFAP) • Neuron (NeuN) • Oligodendrocyte (OLIG2) • Microglia (TMEM119) • Other (low signal in all channels) Nicholas J Eagles1, Sang Ho Kwon1, Abby B Spangler1, Louise A Huuki-Myers1, Kelsey D Montgomery1, Heena R Divecha1, Madhavi Tippani1, Chaichontat Sriworarat2, Thomas M Hyde1, Stephanie C Hicks3, Stephanie C Page1, Keri Martinowich1, Leonardo Collado-Torres1, Kristen R Maynard1 1Lieber Institute for Brain Development, 2Johns Hopkins School of Medicine, Department of Neuroscience, 3Johns Hopkins Bloomberg School of Public Health, Department of Biostatistics Results: Layer-Level Cell Types Most Specific Marker Genes for Excitatory Cell Types Confirmation of Spatial Selectivity of Excitatory Markers PCP4 (layer 5 marker) 15 markers 25 markers 50 markers Counts Proportion markers with nonzero expression • DecisionTreeClassifier (CART) trained to predict cell type from fluorescence intensities Manual Cell-Type Annotation Decision-Tree Classifier Spatial Distribution of Layer-5 Excitatory Cells Overall Cell-Type Proportions Across Each Section Layer 1 Layer 2 Layer 3 Layer 4 Layer 5 Layer 6 White matter Contact and Online Poster Spatial Distribution of Layer-5 Excitatory Cells SPOTlight Cell2location Tangram Ground-Truth Spatial Distribution of Neurons Results: Broad Cell Types Overall Cell-Type Proportions Across Each Section Spatial Distribution of Neurons SPOTlight Cell2location Tangram Ground-Truth See Louise Huuki-Myers’ poster (#94) for snRNA- seq and spatial dataset preparation Manual Spot Annotation SPOTlight Cell2location Tangram Excit_L2/3 Excit_L3 Excit_L4 Excit_L5 Excit_L6 Correlation and RMSE Correlation and RMSE loopybrowser.com CART-calculated counts Software-estimated counts CART-calculated counts Software-estimated counts Astro Micro Neuron Oligo Astro Micro Neuron Oligo