This presentation discusses the meaning of the q-value in statistics and covers appropriate ways to compare differential-expression results in genomics across datasets.
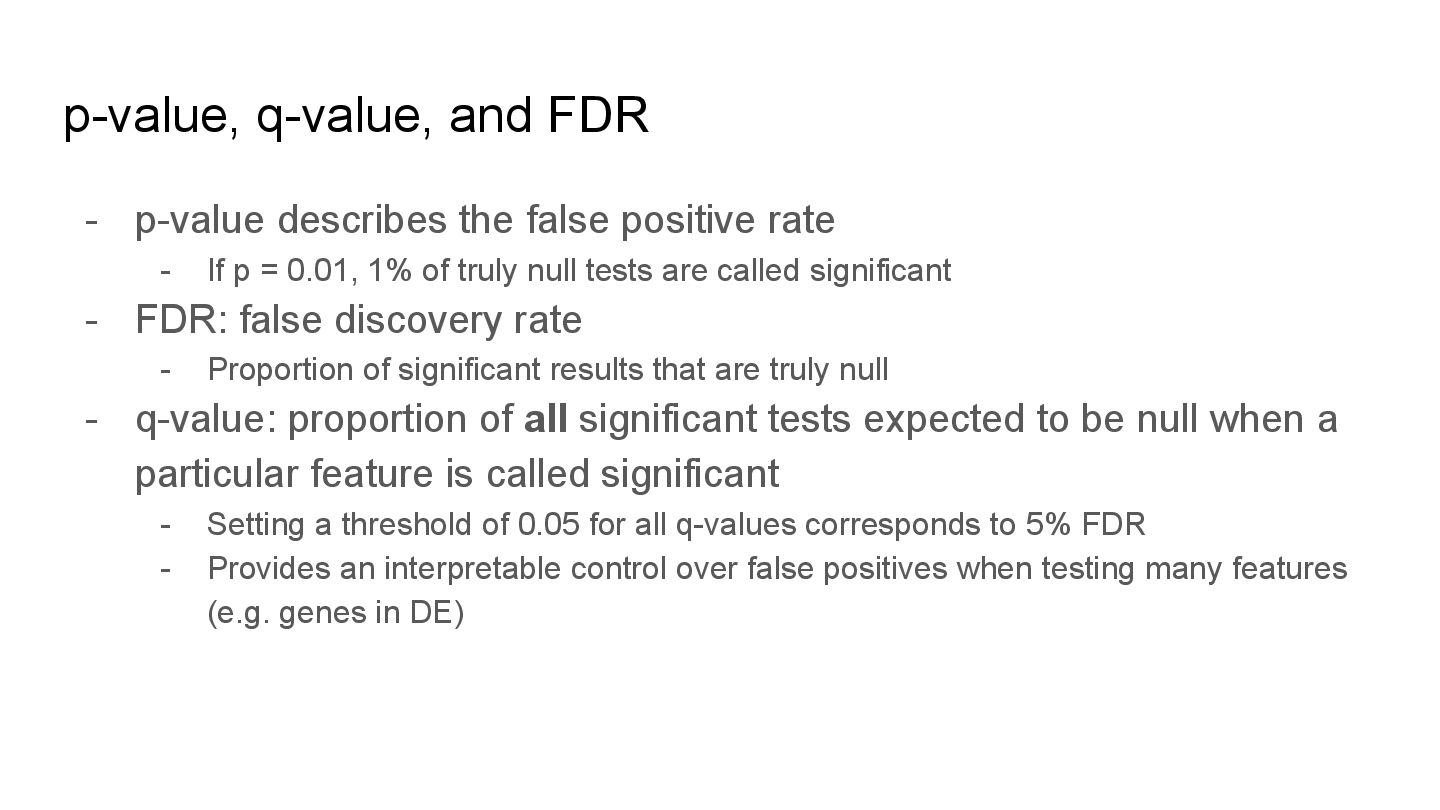
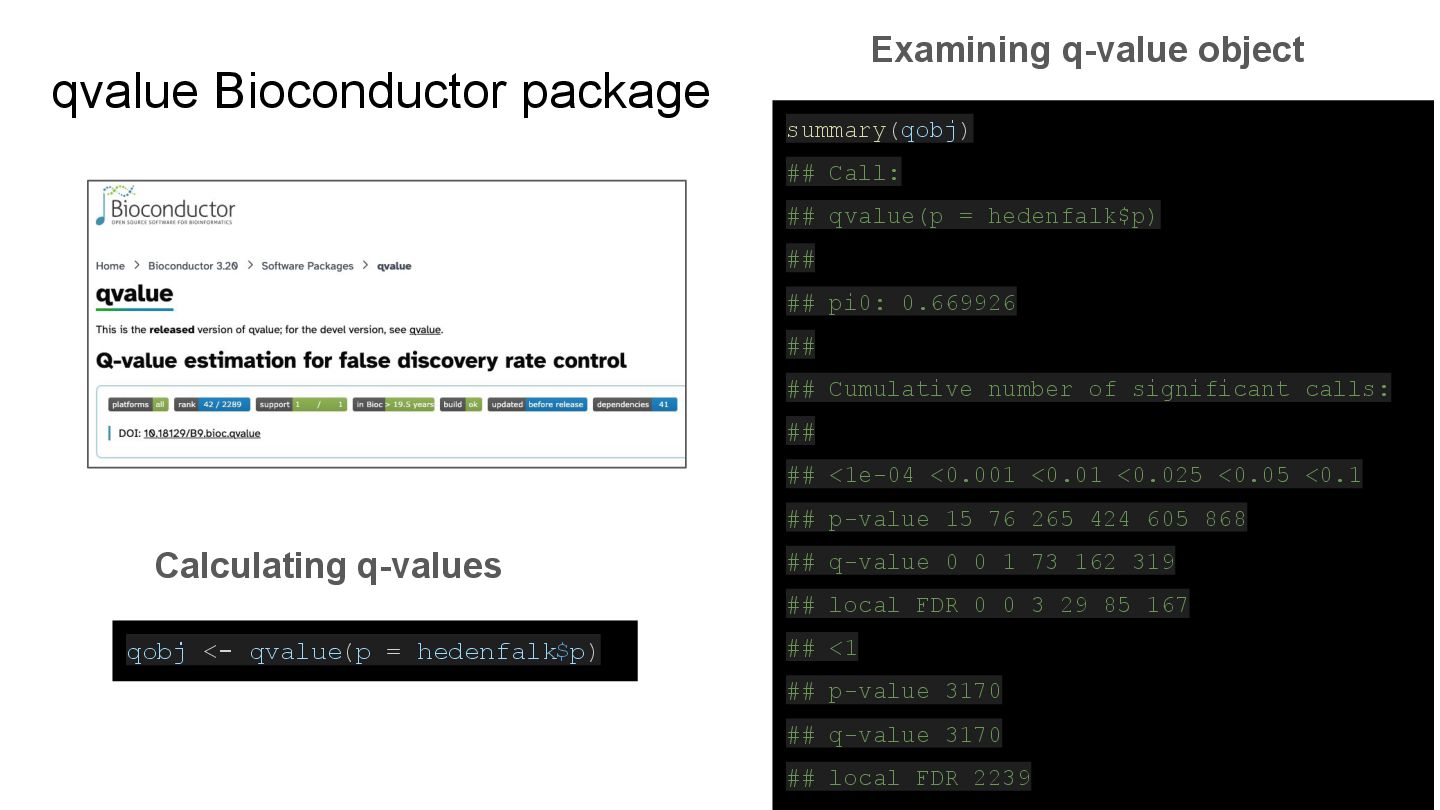
rate - If p = 0.01, 1% of truly null tests are called significant - FDR: false discovery rate - Proportion of significant results that are truly null - q-value: proportion of all significant tests expected to be null when a particular feature is called significant - Setting a threshold of 0.05 for all q-values corresponds to 5% FDR - Provides an interpretable control over false positives when testing many features (e.g. genes in DE)
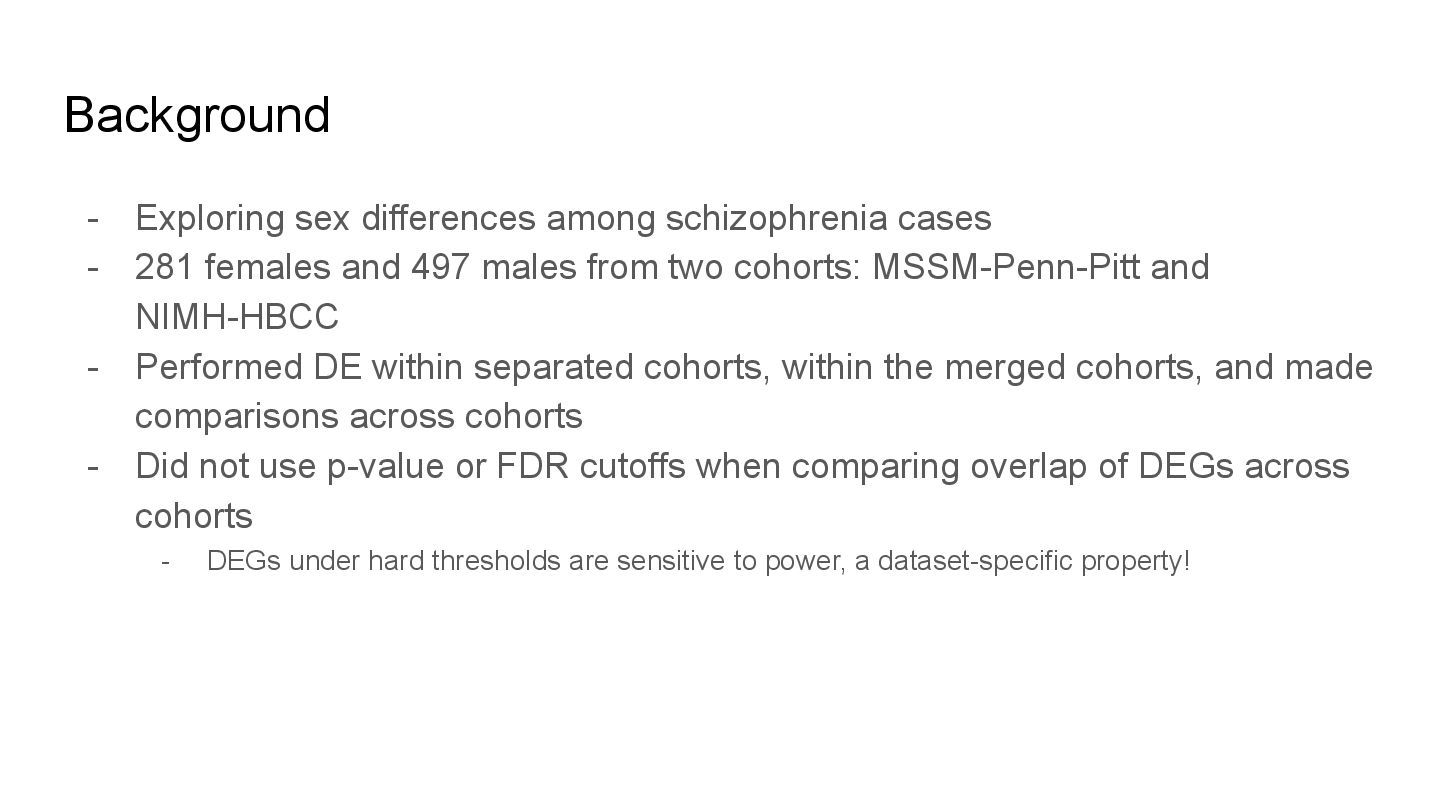
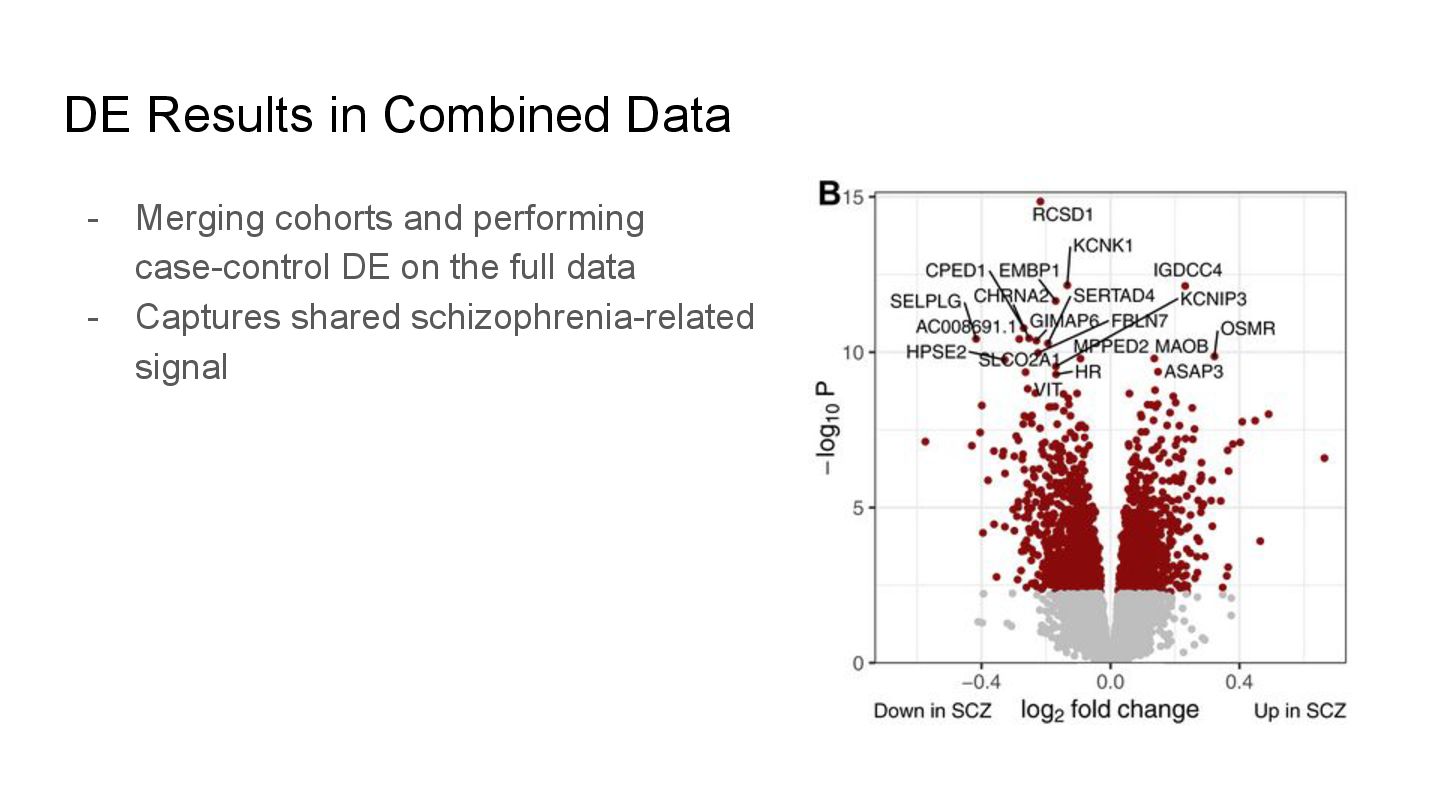
females and 497 males from two cohorts: MSSM-Penn-Pitt and NIMH-HBCC - Performed DE within separated cohorts, within the merged cohorts, and made comparisons across cohorts - Did not use p-value or FDR cutoffs when comparing overlap of DEGs across cohorts - DEGs under hard thresholds are sensitive to power, a dataset-specific property!