Upgrade to Pro — share decks privately, control downloads, hide ads and more …

LIBD Seminar: Spot Deconvolution

LIBD Seminar: Spot Deconvolution

An LIBD (https://www.libd.org/) talk about spot deconvolution in the post-mortem human DLPFC

Nicholas Eagles

June 27, 2023
Tweet

More Decks by Nicholas Eagles

Other Decks in Research

Transcript

  1. Spot Deconvolution in the Post-Mortem Human DLPFC Nicholas J. Eagles

    Research Associate nick-eagles.github.io @Nick-Eagles 1 https://speakerdeck.com/nickeagles
  2. About Me - B.S. Mathematics, 2018 (UMBC) - Programming background

    - Interest in neuroscience, psychiatry, pharmacology 2
  3. My Work at LIBD - Research Associate (Data Science) in

    Leo’s group - Fifth year at LIBD - Develop computational pipelines for preprocessing of bulk RNA-seq data (SPEAQeasy) and whole-genome bisulfite sequencing data (BiocMAP) - Install and maintain software at JHPCE for LIBD and collaborators - Projects - VA PTSD WGBS (2597 samples) - LIBD SCZD-control PsychENCODE WGBS (664 samples) - LIBD PsychENCODE Prenatal WGBS (20 samples) - spatialDLPFC (30 samples) - 2 first-author manuscripts, 3 middle-author, 4 other preprints 3
  4. SPEAQeasy (2021) Bulk RNA-seq preprocessing pipeline Raw sequencing reads ->

    Analysis-ready R objects (.fastq) (.Rdata) https://doi.org/10.1186/s12859-021-04142-3 http://research.libd.org/SPEAQeasy/ 4
  5. TL;DR Raw sequencing reads (.fastq) R objects, ready for statistical

    analysis (.Rdata) https://github.com/LieberInstitute/BiocMAP BiocMAP (2022 preprint) 5
  6. DOI: 10.1038/s41593-020-00787-0 twitter.com/lcolladotor/status/1233661576433061888 from 2020-02-29 DOI 10.1093/bioinformatics/btac299 Since Feb 2020

    spatialLIBD::fetch_data() provides access to SpatialExperiment R/Bioconductor objects Stephanie C Hicks @stephaniehicks Lukas M Weber @lmweber
  7. Spatial DLPFC Intro - Major study using the Visium platform

    to study paired snRNA-seq and spatial gene expression in the post-mortem DLPFC from 10 neurotypical donors (n = 30 samples) 13
  8. 14 Study Design • Neurotypical Adults • High quality RNA

    (RIN > 7) • 30 Visium samples (10 donors x 3 positions) • 19 snRNA-seq samples (10 donors x 2 positions) • 4 Visium-SPG samples (separate donors) -SPG (SRT + IF)
  9. Visium-SPG = Visium SRT + immunofluorescence (using identical tissue samples)

    Sang Ho Kwon @sanghokwon17 Visium Spatially Resolved Transcriptomics (Visium SRT)
  10. Visium Spatial Proteogenomics (Visium-SPG) - Gene expression captured like ordinary

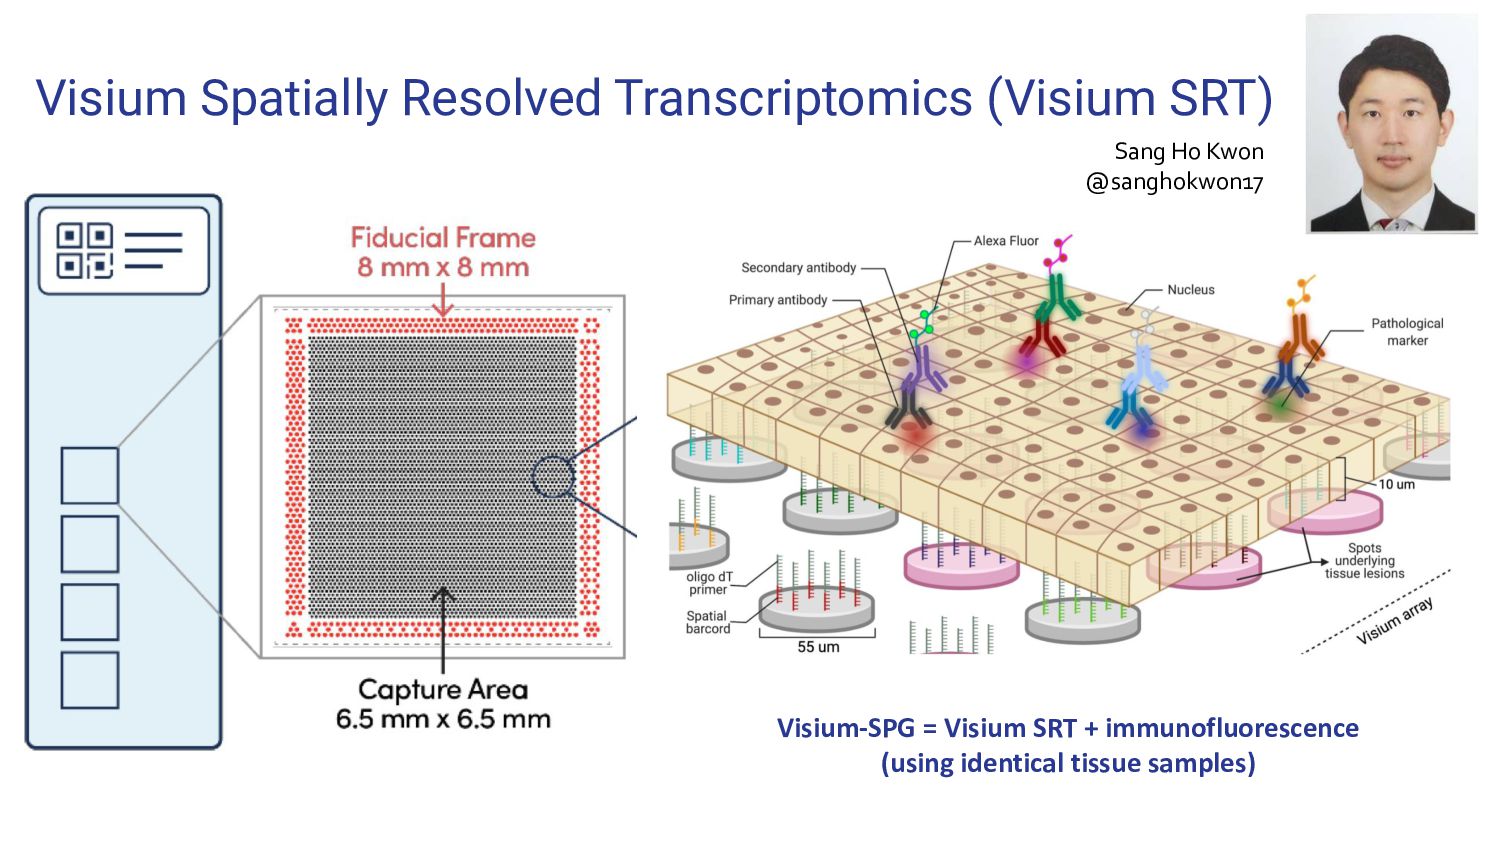
    Visium - Multi-channel fluorescent images captured of the same tissue - Channels measure proteins marking for specific cell types Kristen R. Maynard 16 Sang Ho Kwon Visium-SPG = Visium SRT + immunofluorescence (using identical tissue samples) Fluorescent Protein Cell Type TMEM119 Microglia Neun Neurons OLIG2 Oligodendrocytes GFAP Astrocytes
  11. Integrating SRT and Single-Cell Data to Map Cell Types Spatially

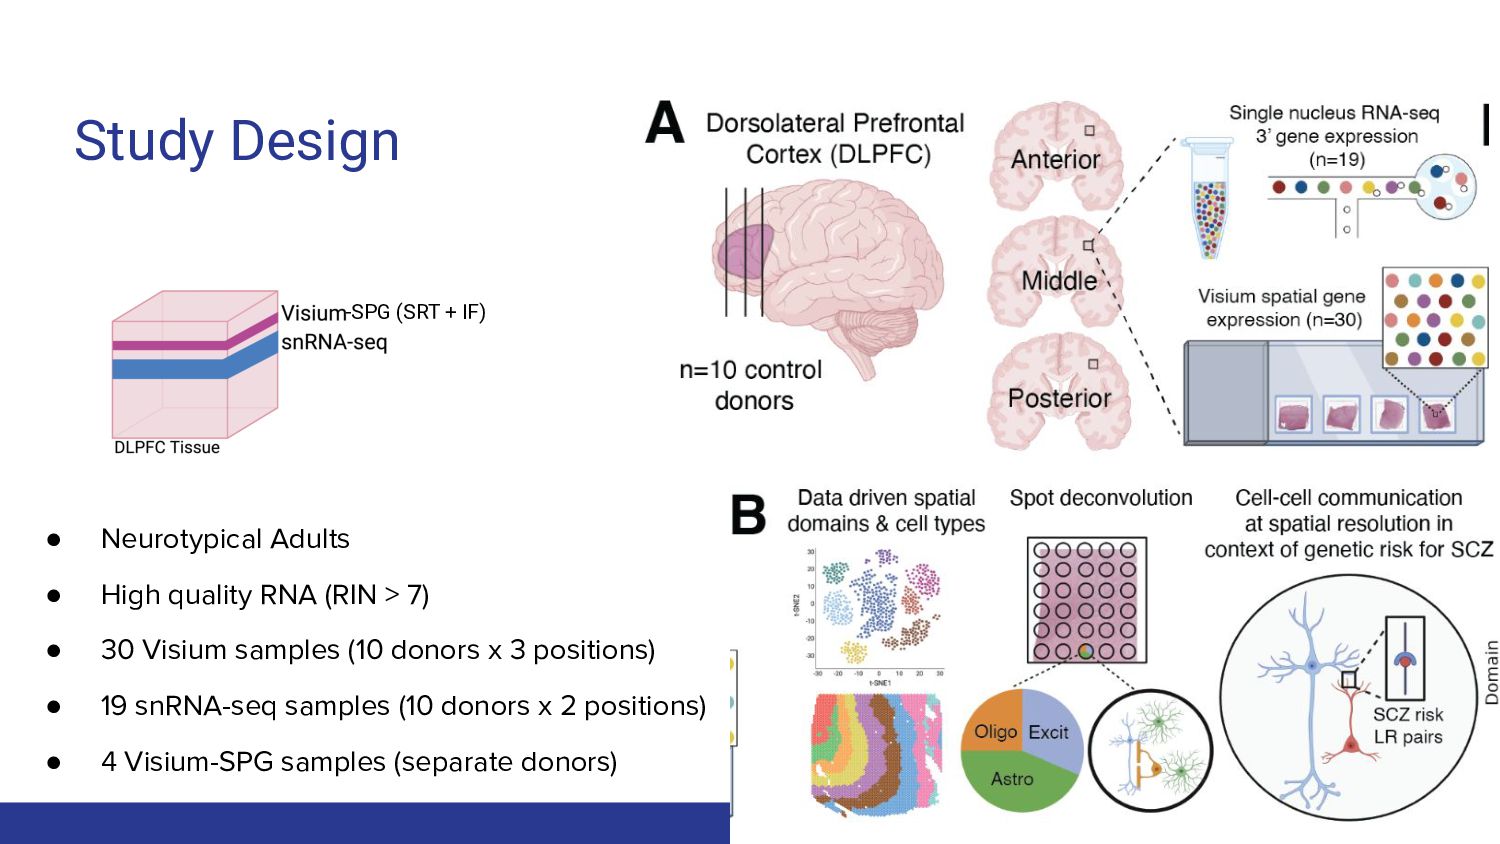
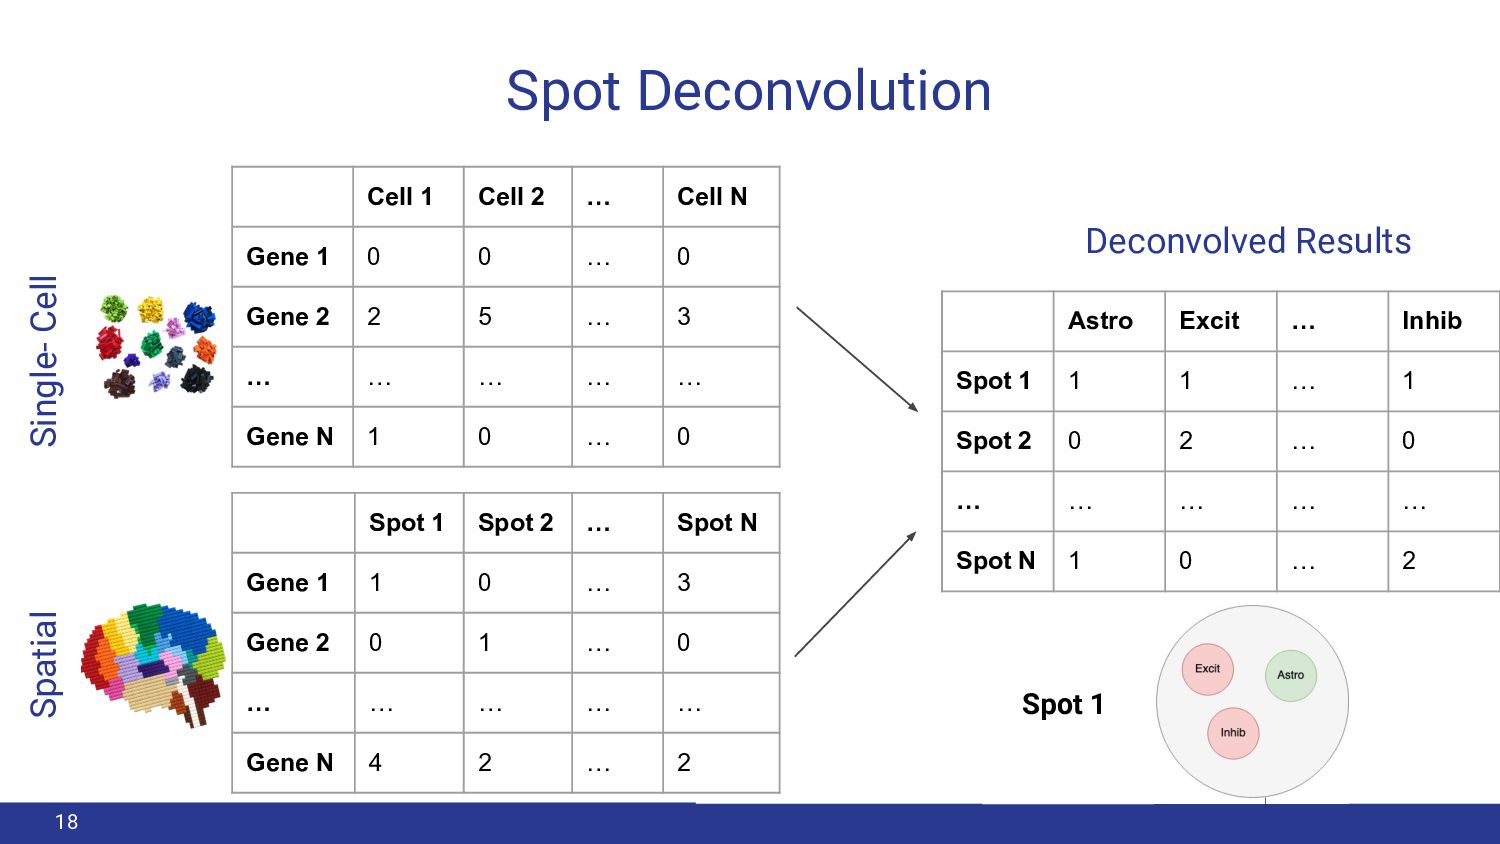
    - Single-cell data lacks spatial information, and SRT data lacks cell-type-composition information single-cell spatial Questions we can’t answer from SRT data alone: How are cellular populations distributed spatially? Which cell types are communicating in ligand-receptor interactions associated with schizophrenia? Image from Bo Xia: https://twitter.com/BoXia7/status/1261464021322137600?s=12 17 spot deconvolution
  12. Spot Deconvolution 18 Cell 1 Cell 2 … Cell N

    Gene 1 0 0 … 0 Gene 2 2 5 … 3 … … … … … Gene N 1 0 … 0 Spot 1 Spot 2 … Spot N Gene 1 1 0 … 3 Gene 2 0 1 … 0 … … … … … Gene N 4 2 … 2 Astro Excit … Inhib Spot 1 1 1 … 1 Spot 2 0 2 … 0 … … … … … Spot N 1 0 … 2 Single- Cell Spatial Deconvolved Results Spot 1
  13. Benchmark existing spot deconvolution methods, and choose the best to

    estimate cell-type composition in our spatial data 21 My Goal
  14. Existing Spot Deconvolution Software - Explored 3 novel software methods

    Software name Overall approach Input Cell Counts Output Tangram (Biancalani et al.) Mapping individual cells Every spot Integer counts Cell2location (Kleshchevnikov et al.) Matching gene-expression profile Average across spots Decimal counts SPOTlight (Elosua-Bayes et al.) Matching gene-expression profile Not used Proportions 22 Excit L5 Counts PCP4 Counts
  15. Benchmarking Spot Deconvolution Software: Theory - How do we measure

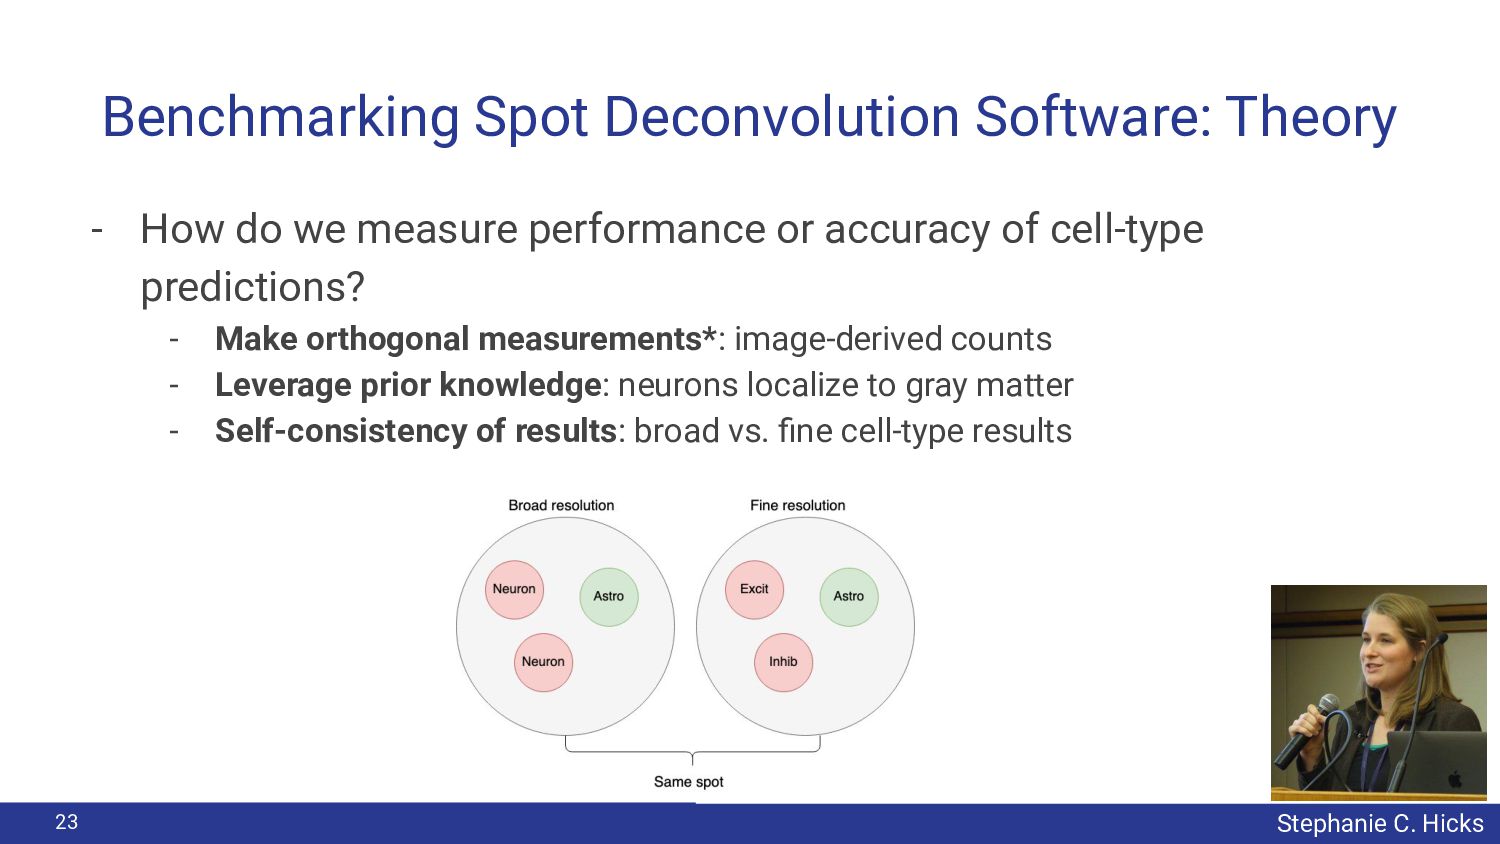
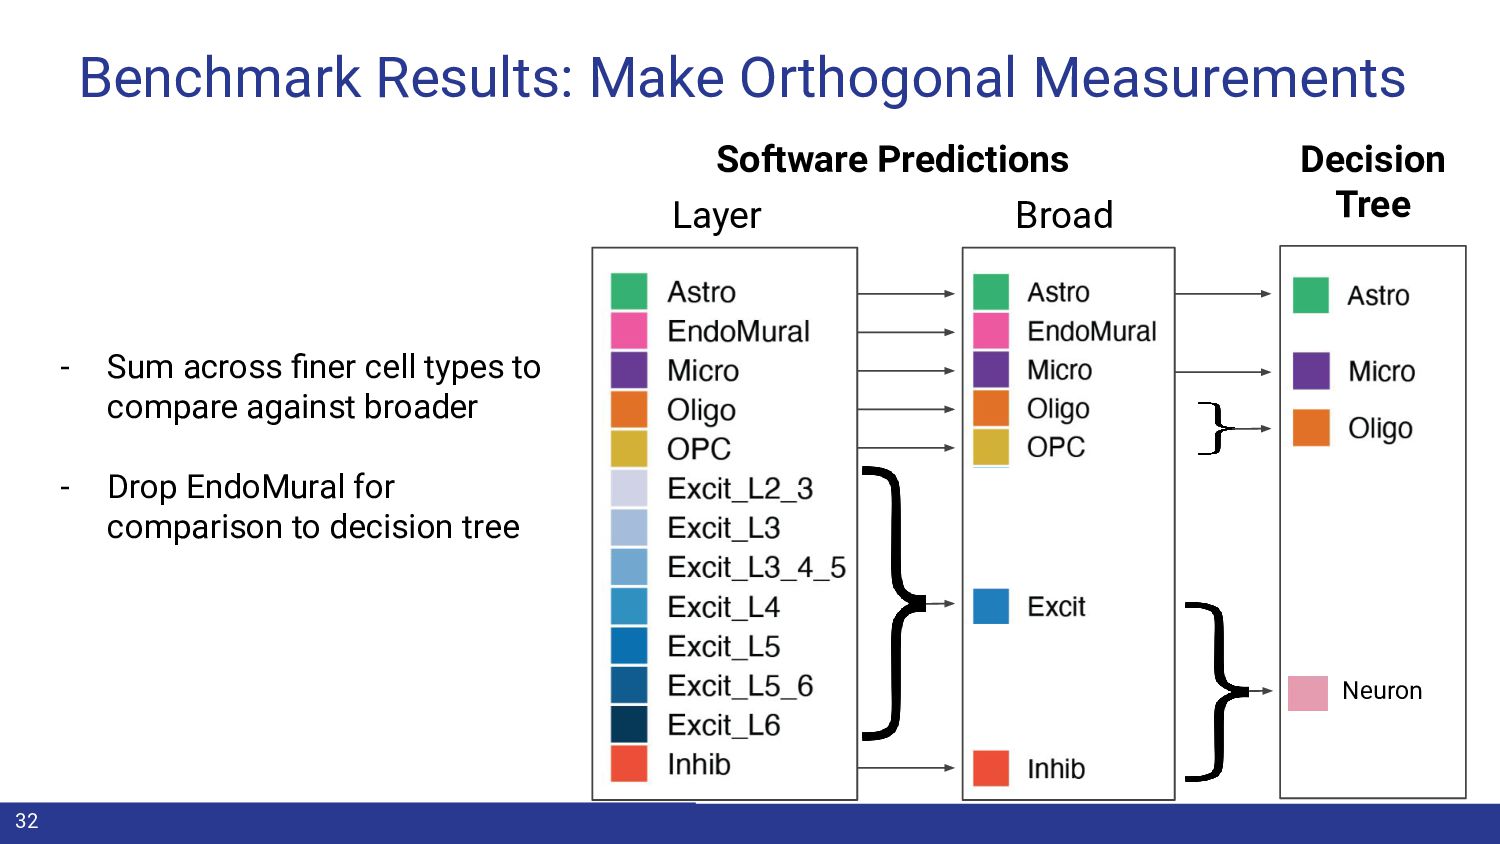
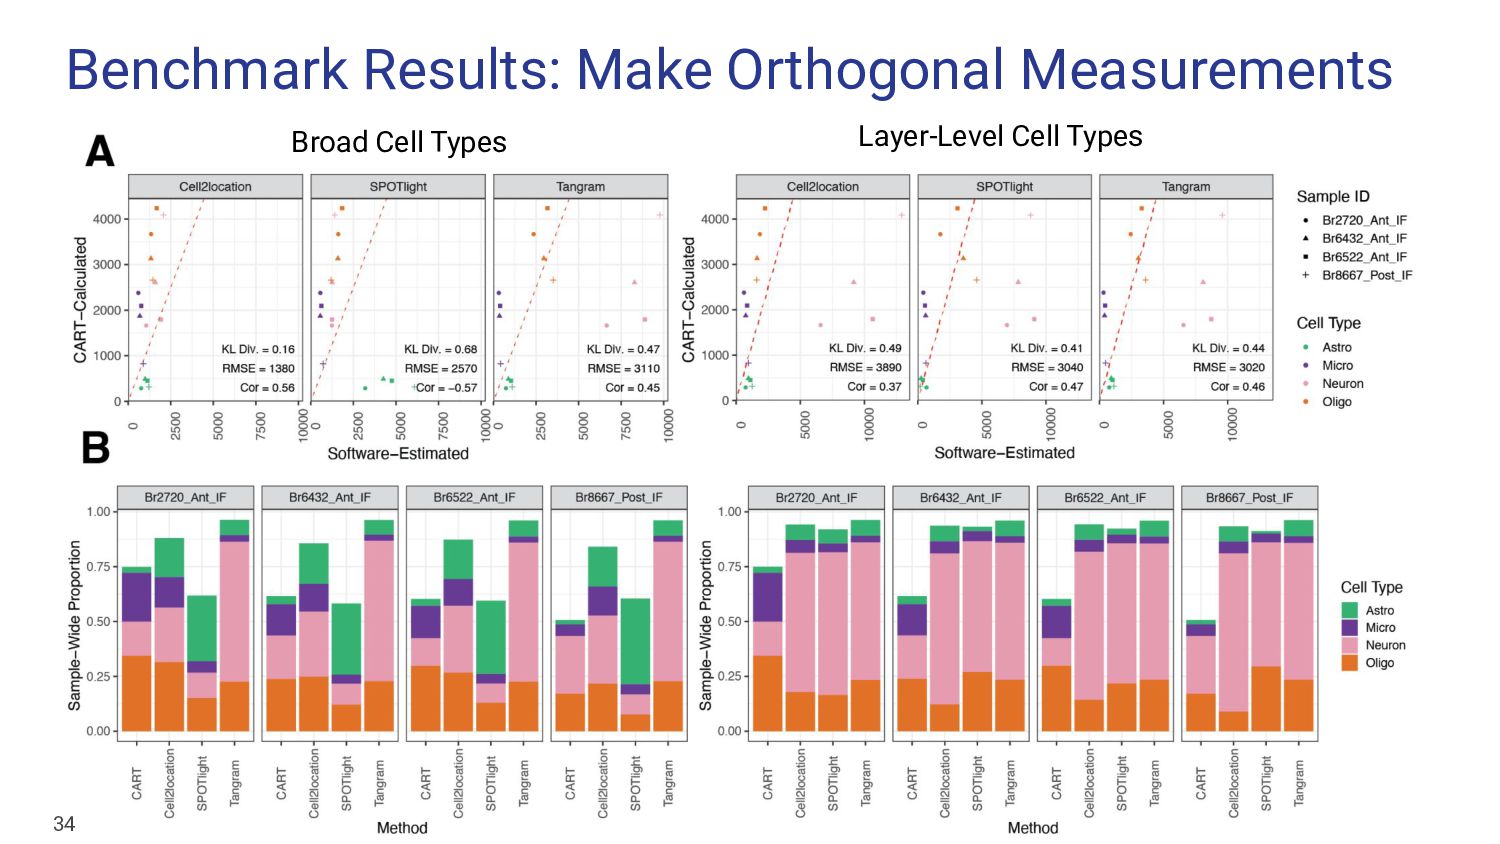
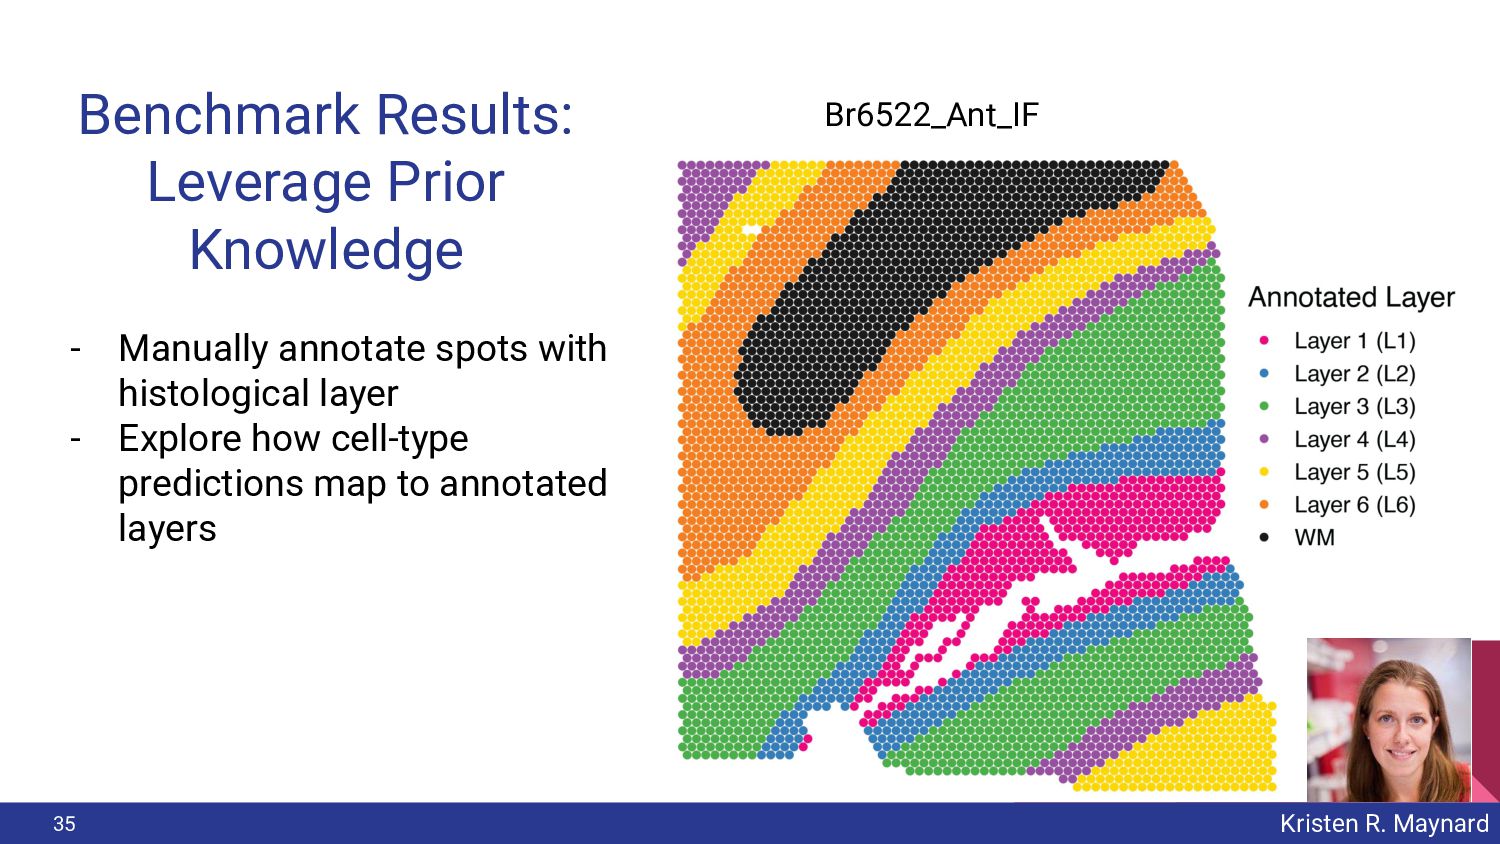
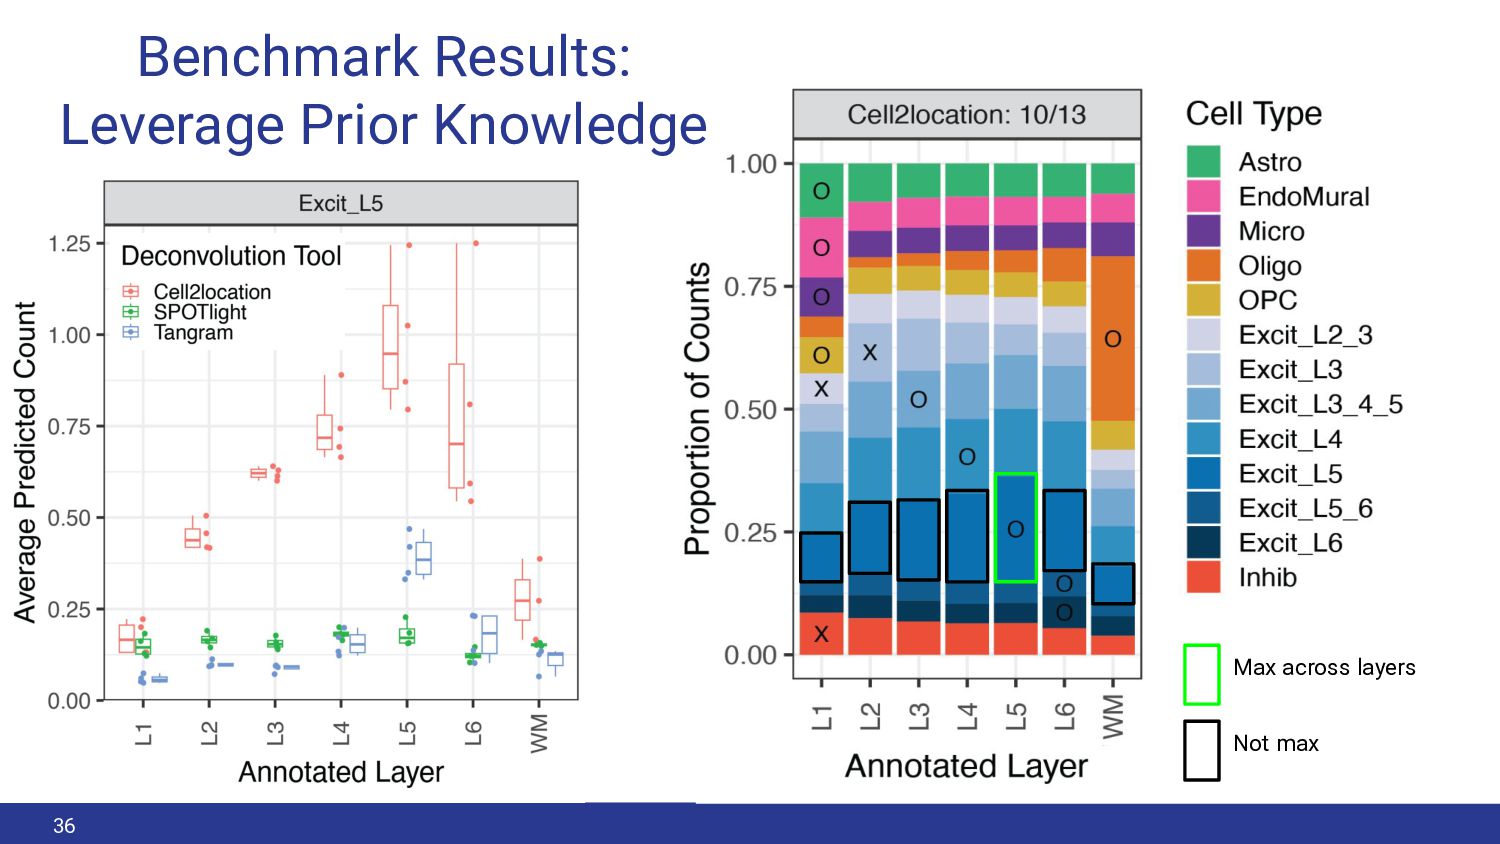
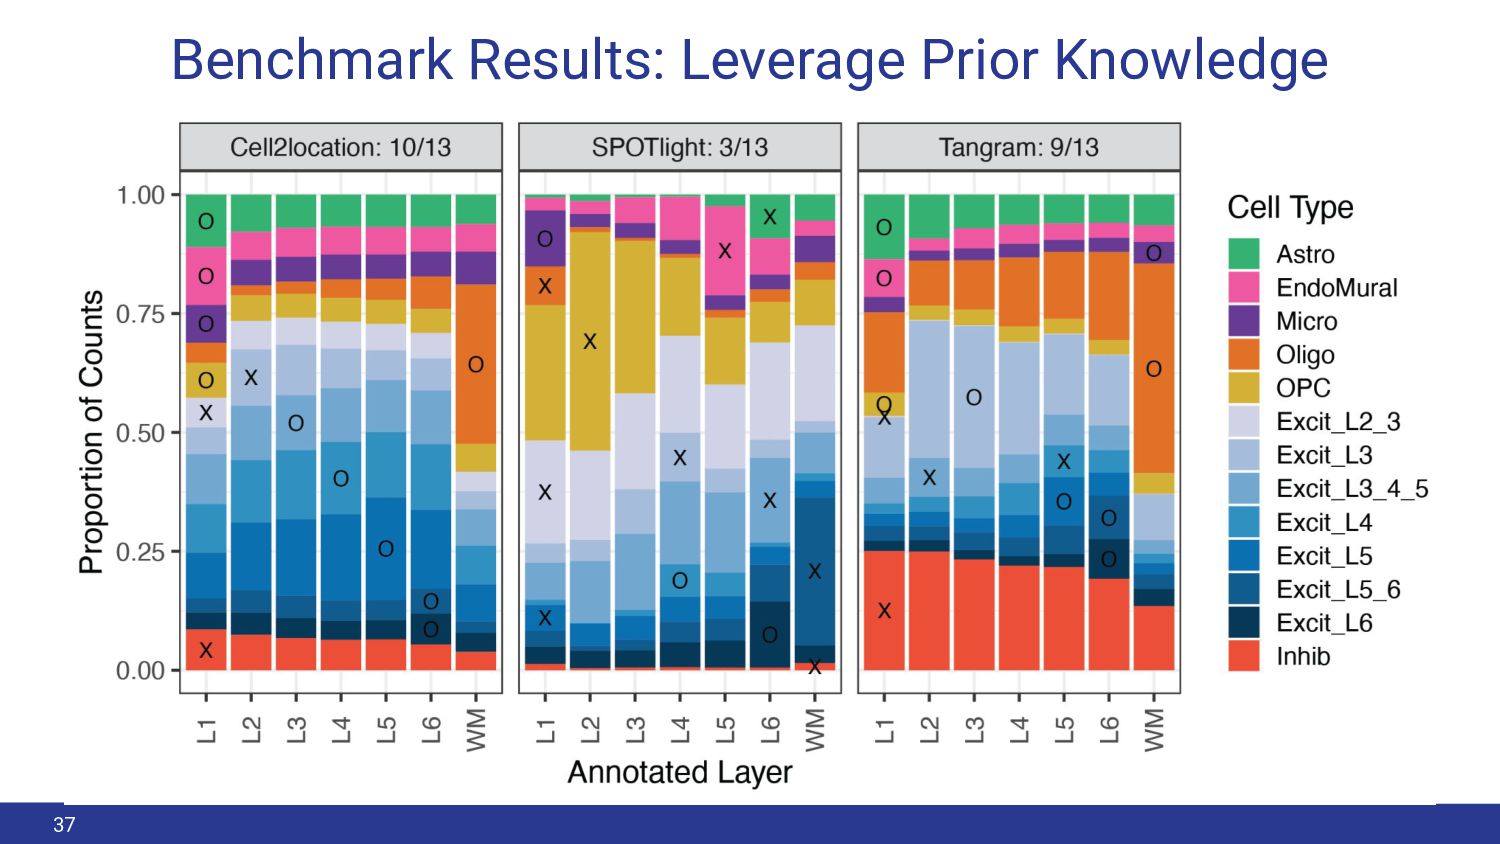
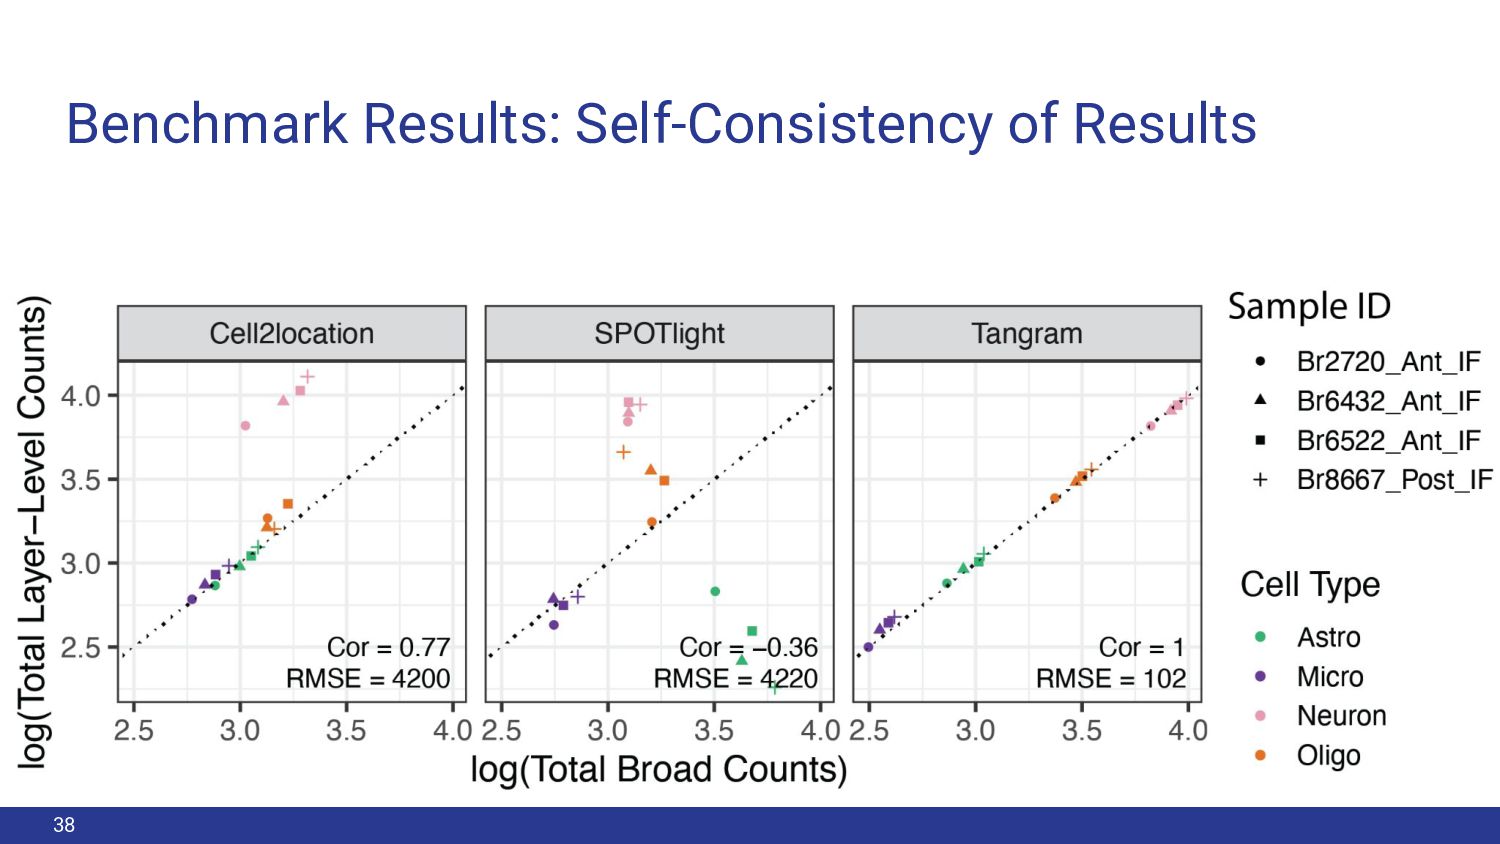
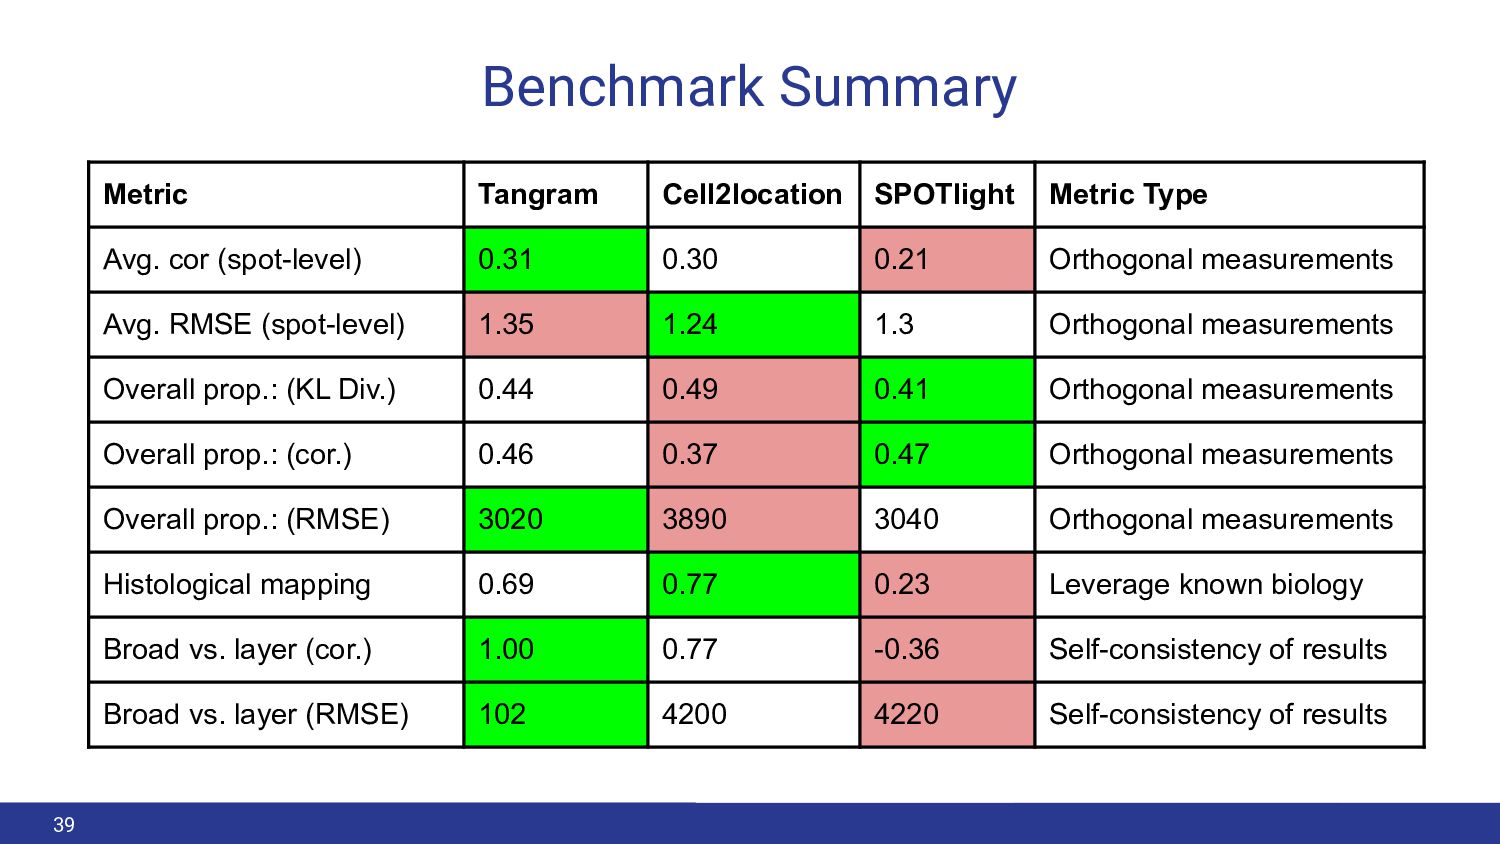
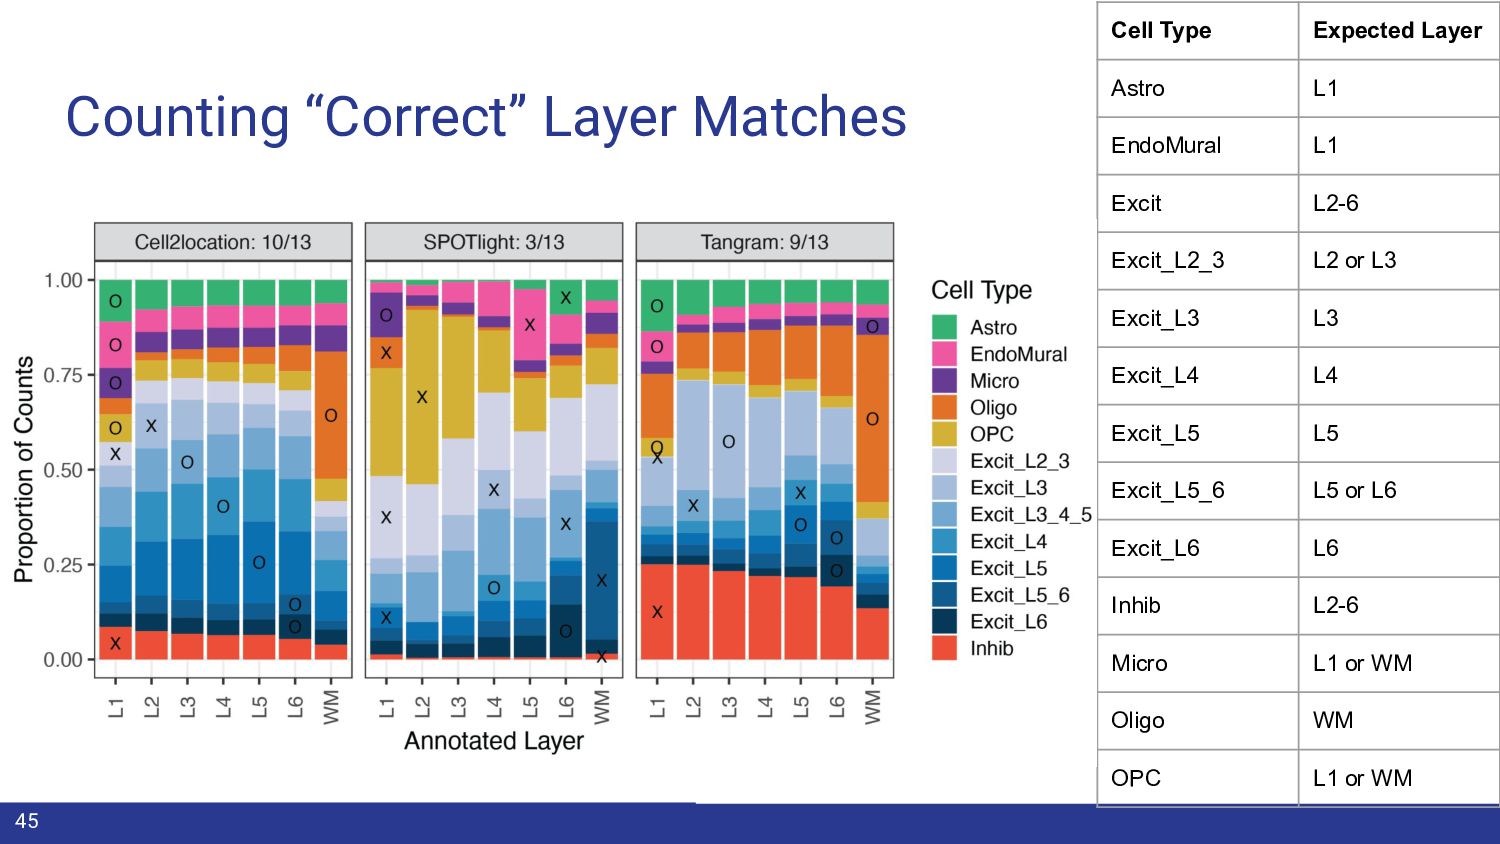
    performance or accuracy of cell-type predictions? - Make orthogonal measurements*: image-derived counts - Leverage prior knowledge: neurons localize to gray matter - Self-consistency of results: broad vs. fine cell-type results 23 Stephanie C. Hicks
  16. Using IF to Quantify Cell Types - Visium-SPG IF images

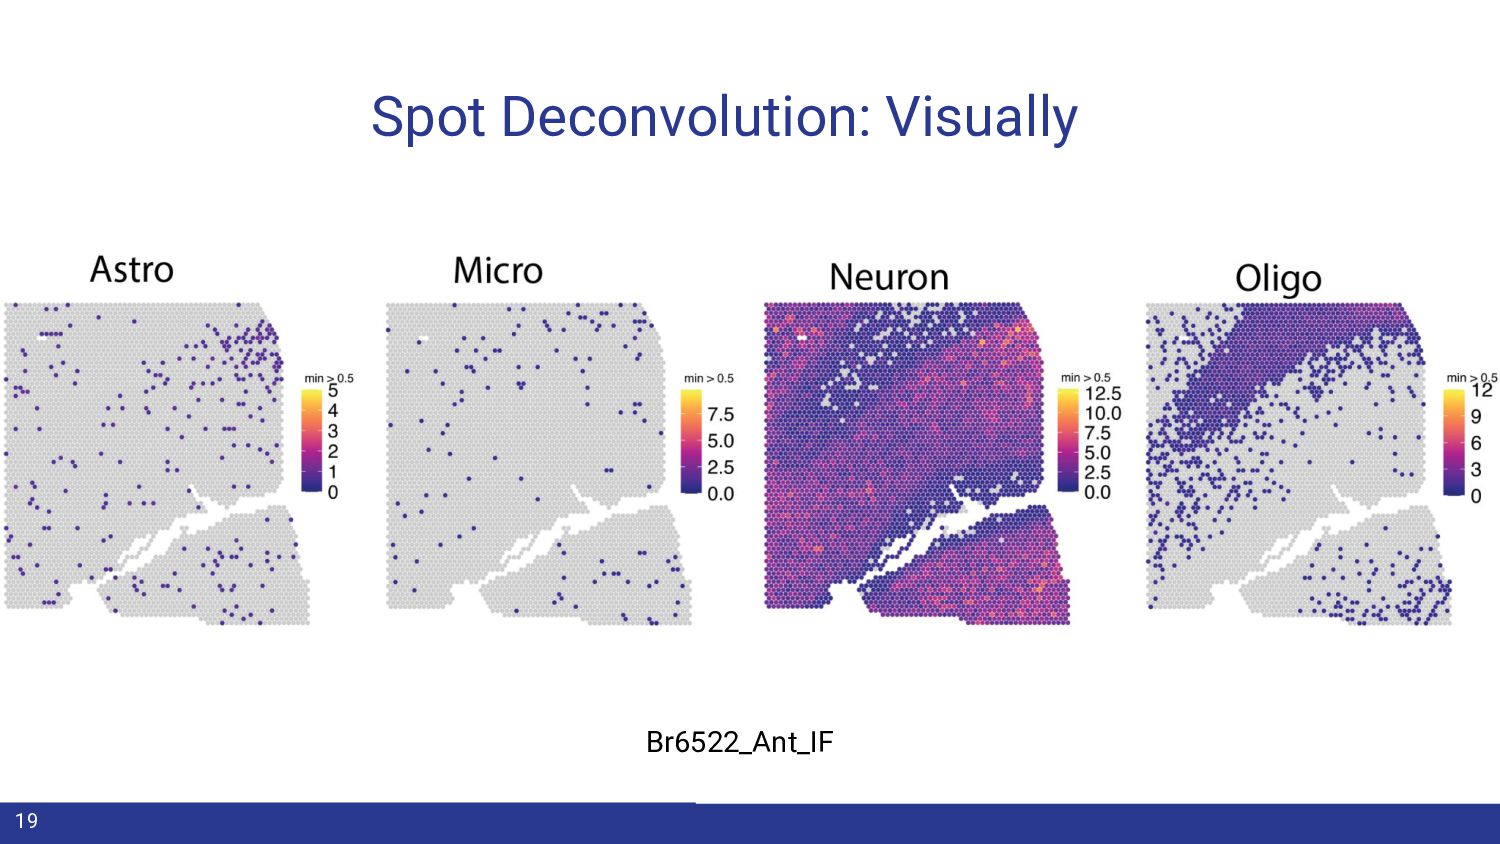
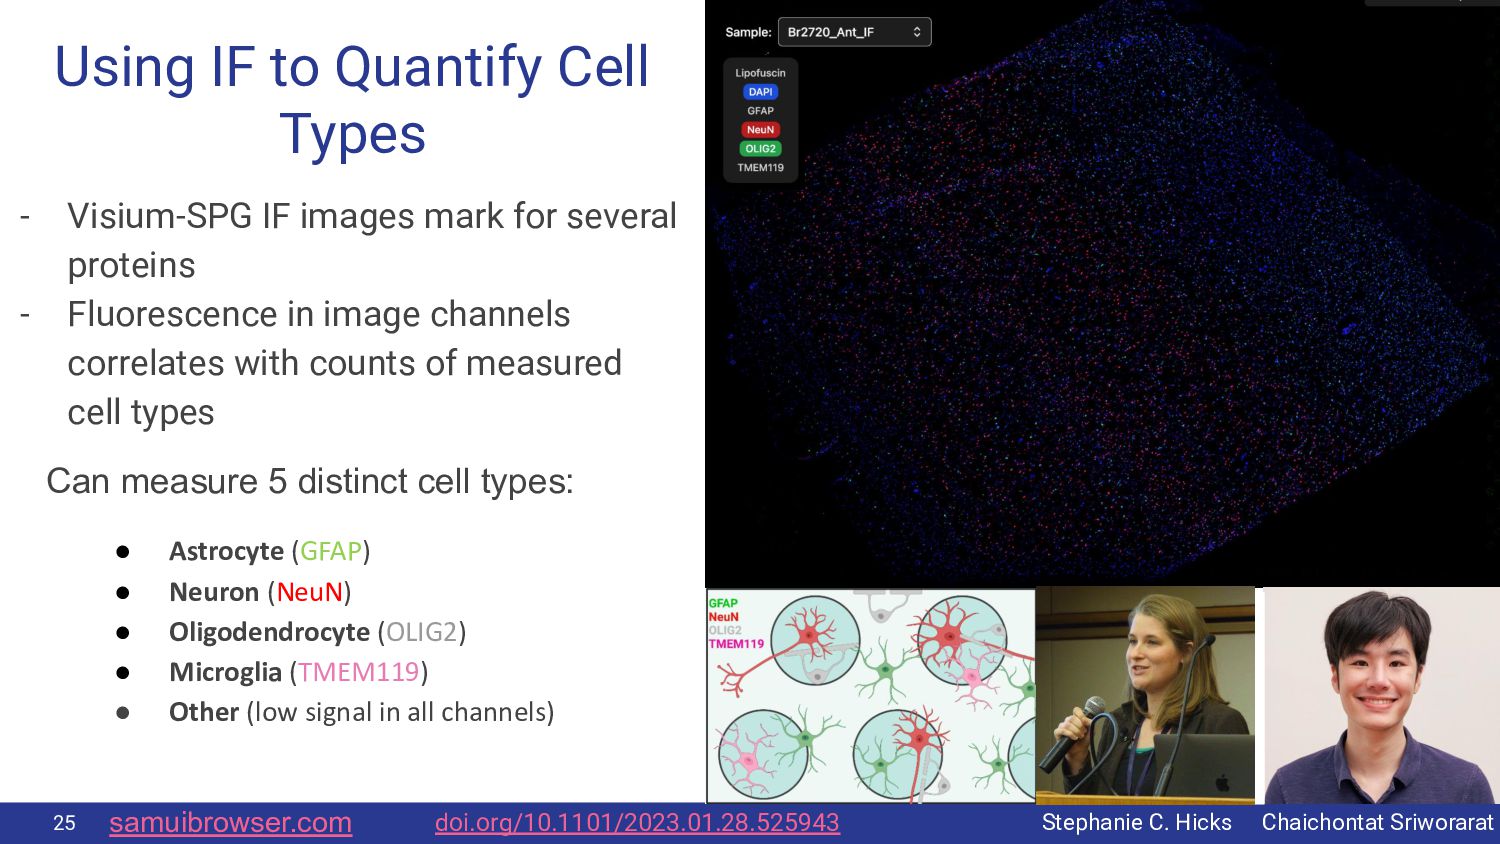
    mark for several proteins - Fluorescence in image channels correlates with counts of measured cell types Can measure 5 distinct cell types: 25 • Astrocyte (GFAP) • Neuron (NeuN) • Oligodendrocyte (OLIG2) • Microglia (TMEM119) • Other (low signal in all channels) samuibrowser.com Chaichontat Sriworarat Stephanie C. Hicks doi.org/10.1101/2023.01.28.525943
  17. Segmenting Cells on Visium-SPG IF Images 1. Segment cells on

    IF image 2. Manually label example cells 3. Train cell-type classifier and apply on remaining data 26
  18. Constructing Dataset of Labeled Cells 1. Segment cells on IF

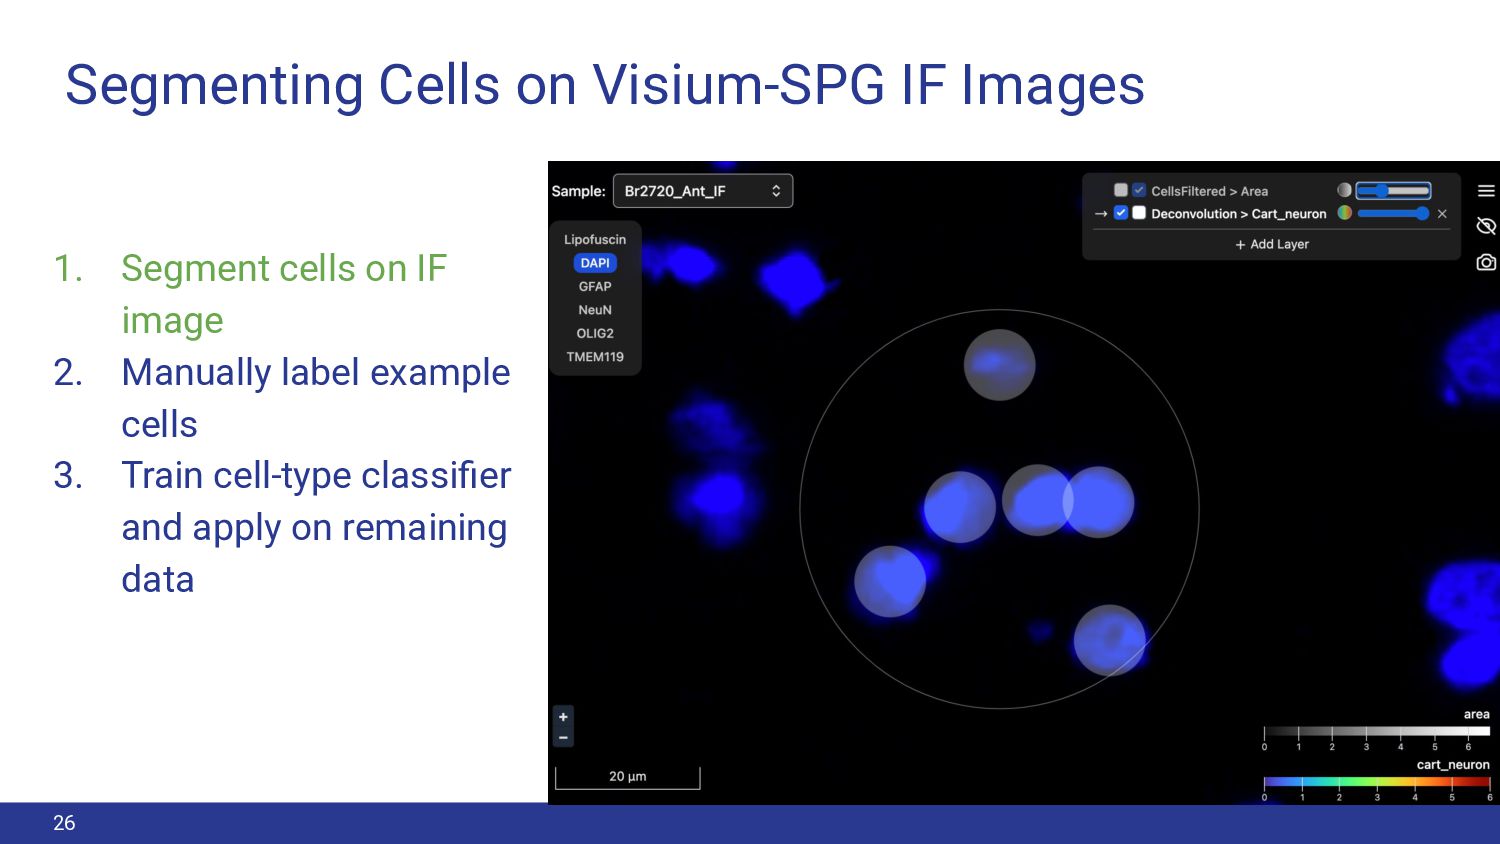
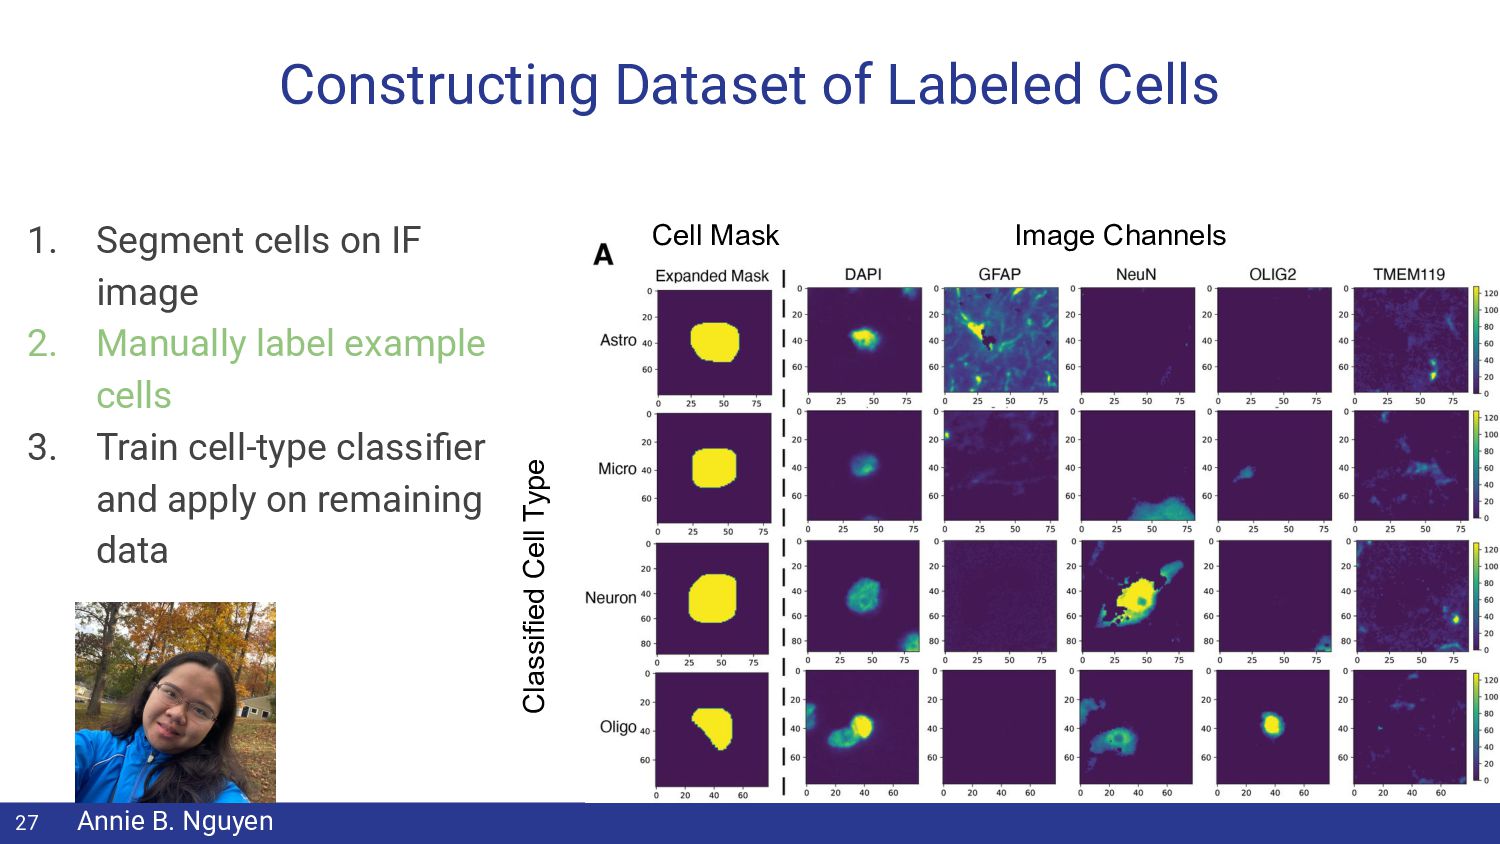
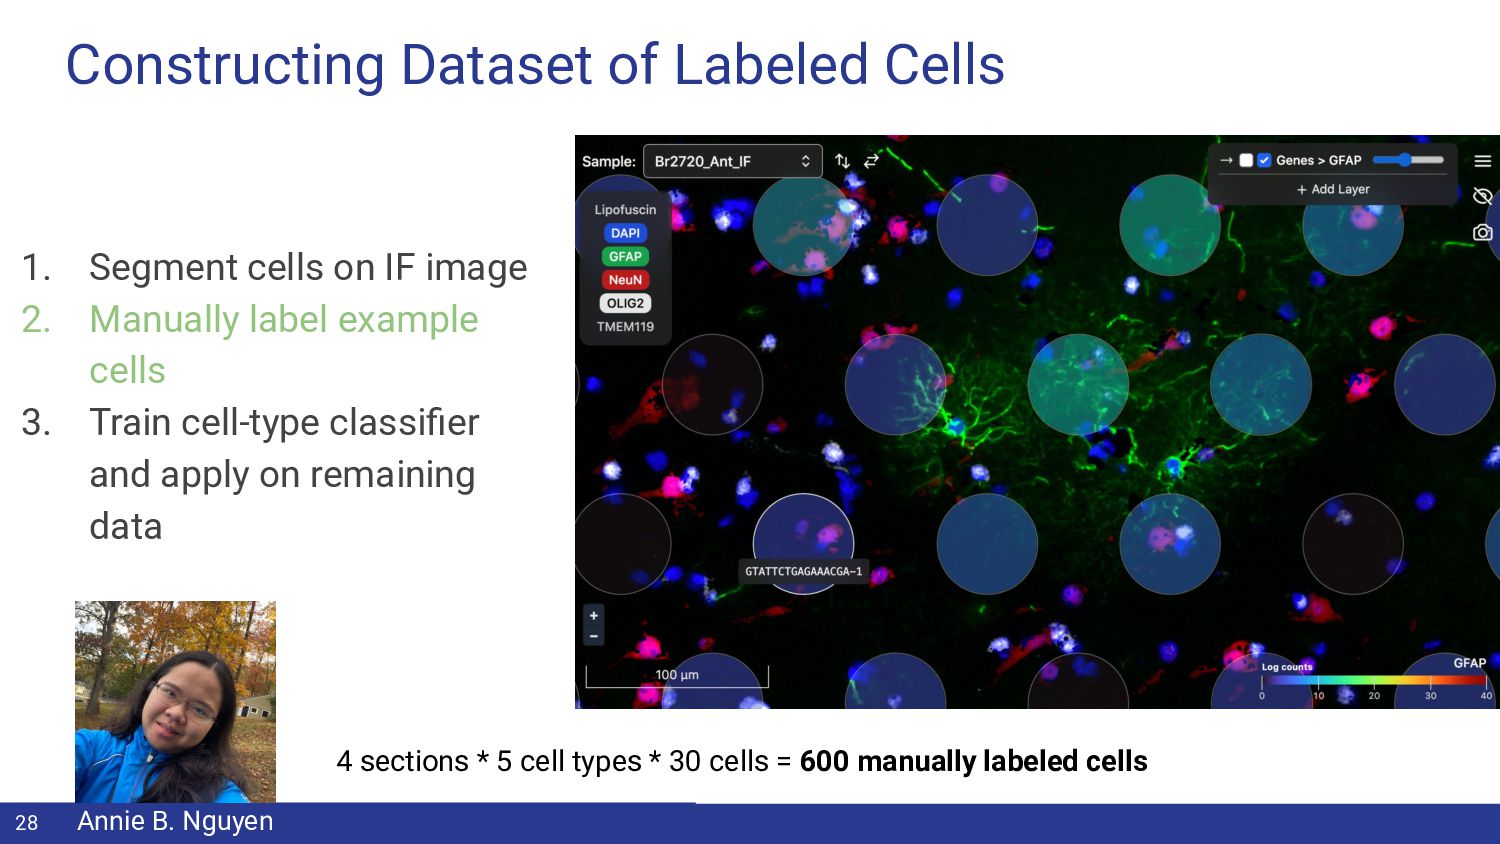
    image 2. Manually label example cells 3. Train cell-type classifier and apply on remaining data Image Channels Classified Cell Type Cell Mask 27 Annie B. Nguyen
  19. Constructing Dataset of Labeled Cells 28 1. Segment cells on

    IF image 2. Manually label example cells 3. Train cell-type classifier and apply on remaining data 4 sections * 5 cell types * 30 cells = 600 manually labeled cells Annie B. Nguyen
  20. Addressing Bias in Cell Selection - Trained logistic regression model

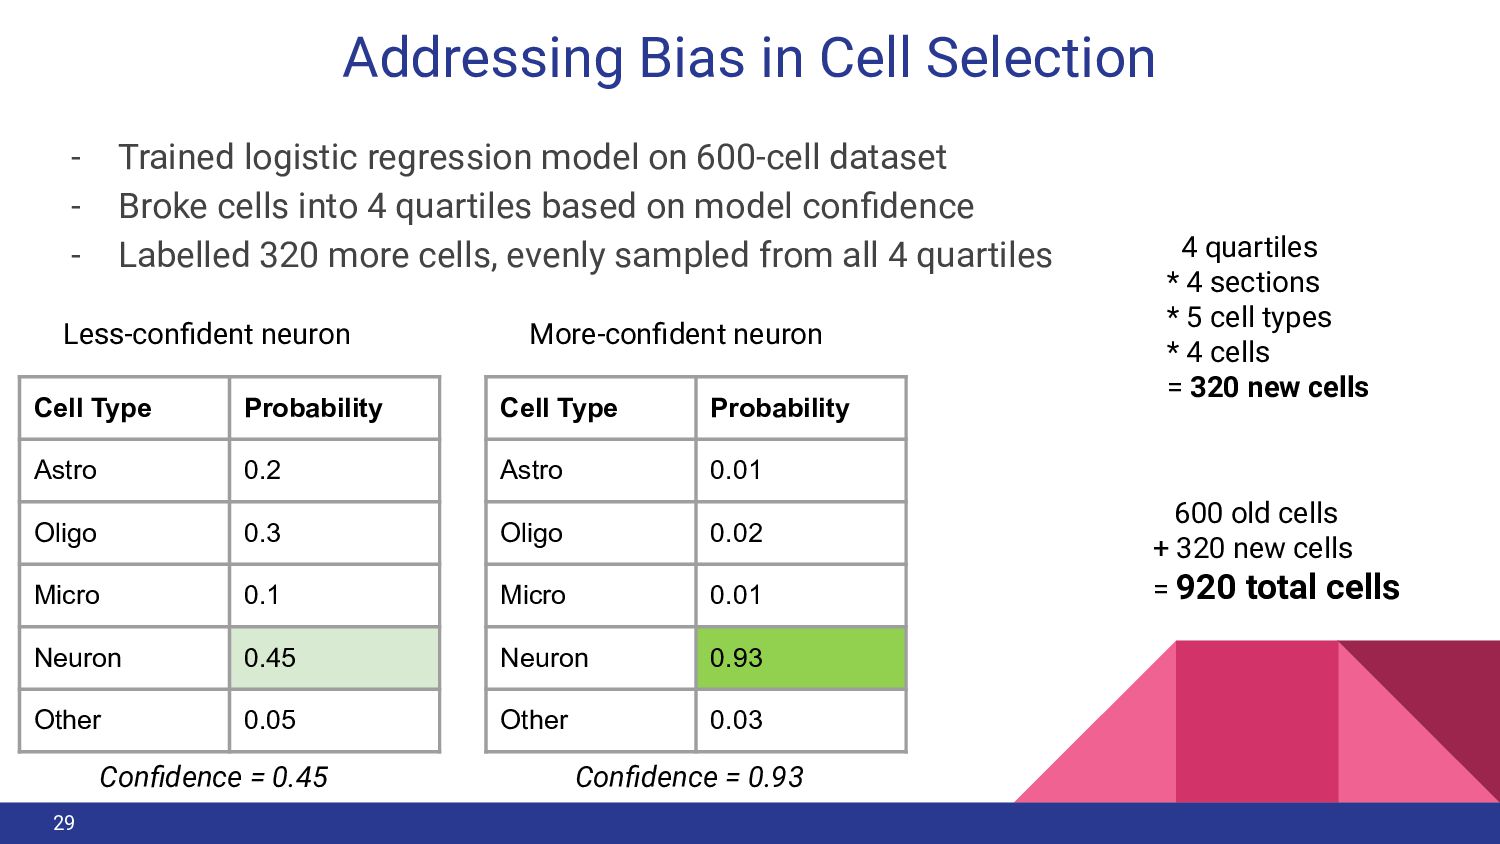
    on 600-cell dataset - Broke cells into 4 quartiles based on model confidence - Labelled 320 more cells, evenly sampled from all 4 quartiles 29 Cell Type Probability Astro 0.2 Oligo 0.3 Micro 0.1 Neuron 0.45 Other 0.05 4 quartiles * 4 sections * 5 cell types * 4 cells = 320 new cells 600 old cells + 320 new cells = 920 total cells Cell Type Probability Astro 0.01 Oligo 0.02 Micro 0.01 Neuron 0.93 Other 0.03 Less-confident neuron More-confident neuron Confidence = 0.45 Confidence = 0.93
  21. Training Cell-Type Classifier 30 Model Test Precision Test Recall Decision

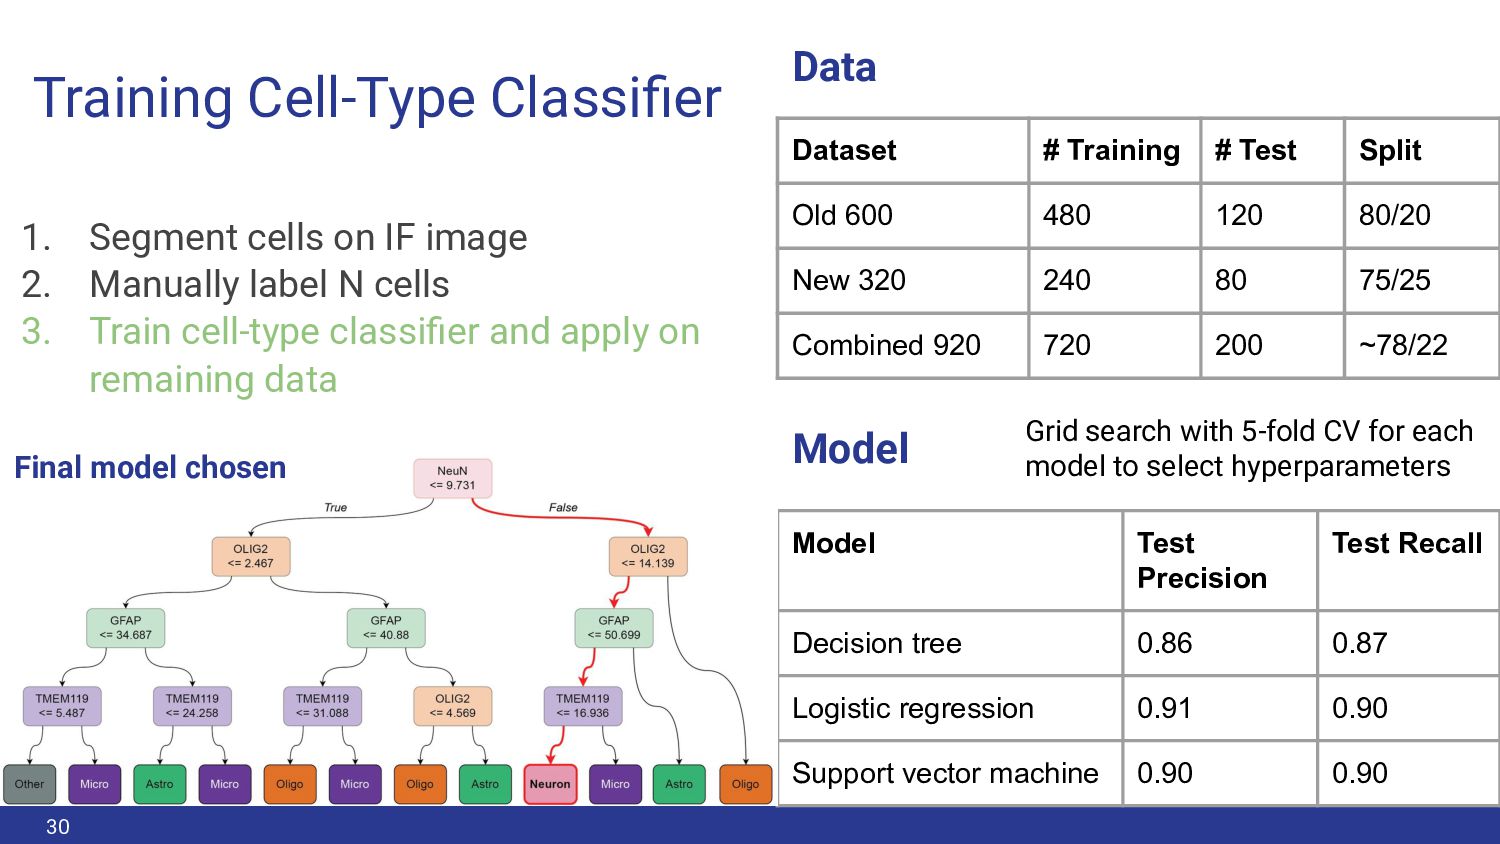
    tree 0.86 0.87 Logistic regression 0.91 0.90 Support vector machine 0.90 0.90 Dataset # Training # Test Split Old 600 480 120 80/20 New 320 240 80 75/25 Combined 920 720 200 ~78/22 1. Segment cells on IF image 2. Manually label N cells 3. Train cell-type classifier and apply on remaining data Grid search with 5-fold CV for each model to select hyperparameters Data Model Final model chosen
  22. Benchmark Results: Make Orthogonal Measurements 32 Neuron Layer Broad Decision

    Tree - Sum across finer cell types to compare against broader - Drop EndoMural for comparison to decision tree Software Predictions
  23. Benchmark Results: Leverage Prior Knowledge - Manually annotate spots with

    histological layer - Explore how cell-type predictions map to annotated layers Kristen R. Maynard Br6522_Ant_IF 35
  24. Benchmark Summary 39 Metric Tangram Cell2location SPOTlight Metric Type Avg.

    cor (spot-level) 0.31 0.30 0.21 Orthogonal measurements Avg. RMSE (spot-level) 1.35 1.24 1.3 Orthogonal measurements Overall prop.: (KL Div.) 0.44 0.49 0.41 Orthogonal measurements Overall prop.: (cor.) 0.46 0.37 0.47 Orthogonal measurements Overall prop.: (RMSE) 3020 3890 3040 Orthogonal measurements Histological mapping 0.69 0.77 0.23 Leverage known biology Broad vs. layer (cor.) 1.00 0.77 -0.36 Self-consistency of results Broad vs. layer (RMSE) 102 4200 4220 Self-consistency of results
  25. How Spot Deconvolution Results Were Used A. Better characterize unsupervised

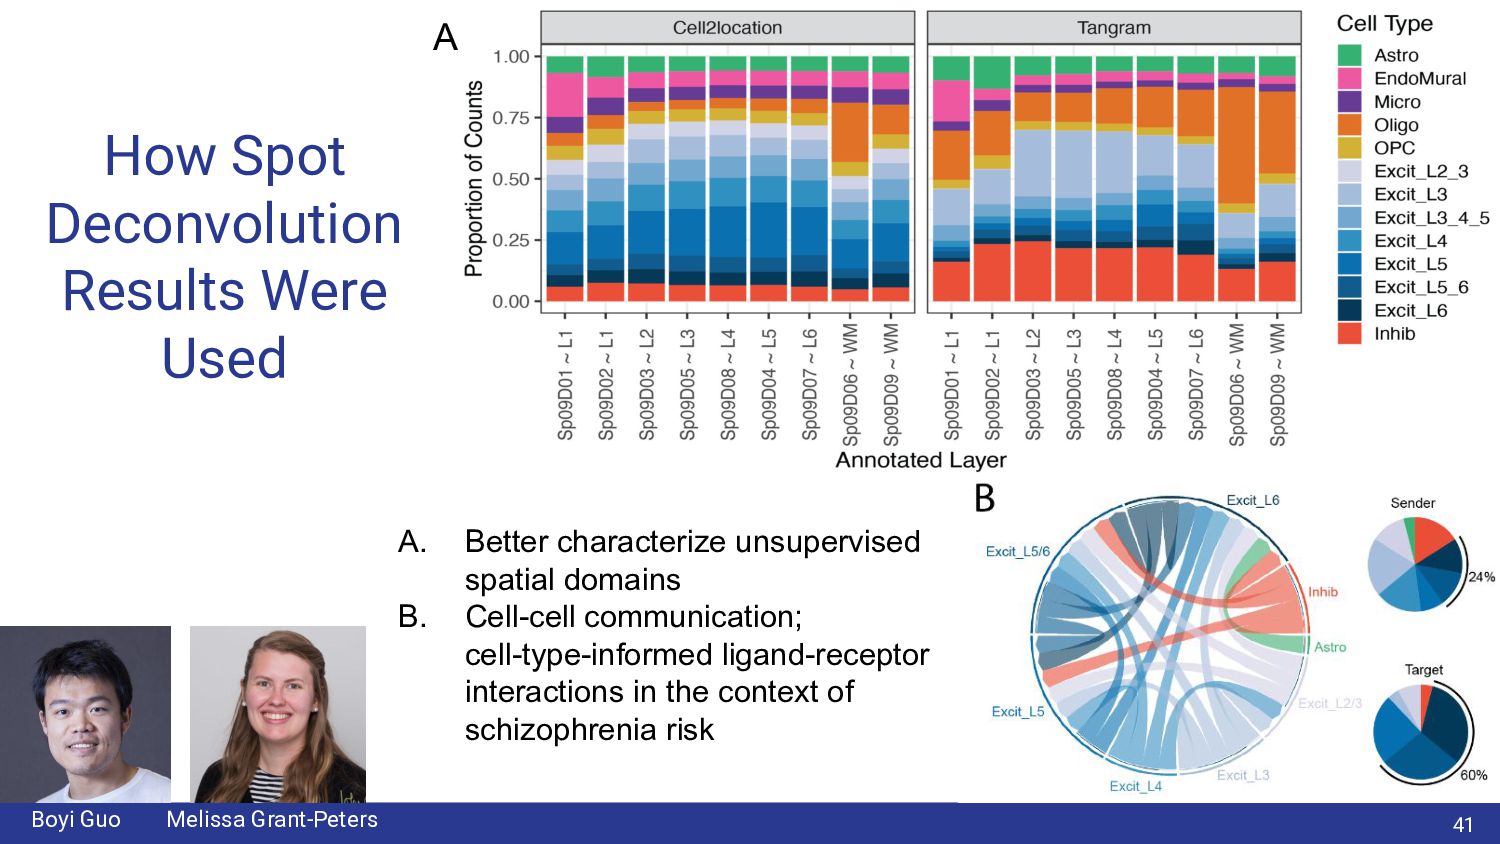
    spatial domains B. Cell-cell communication; cell-type-informed ligand-receptor interactions in the context of schizophrenia risk A 41 Boyi Guo Melissa Grant-Peters
  26. Conclusions - Imaging data can be leveraged to infer cell-type

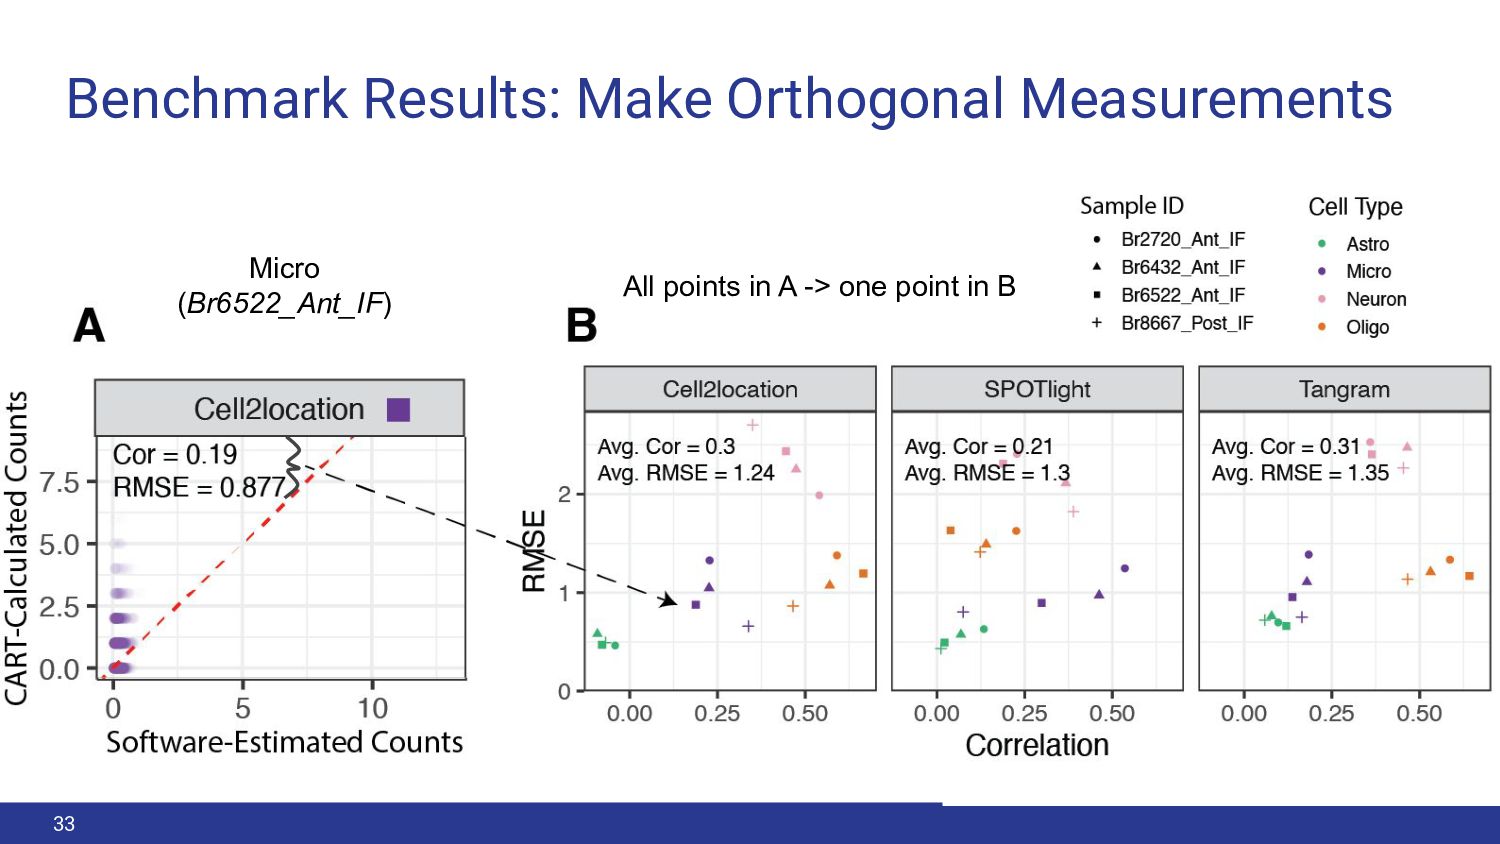
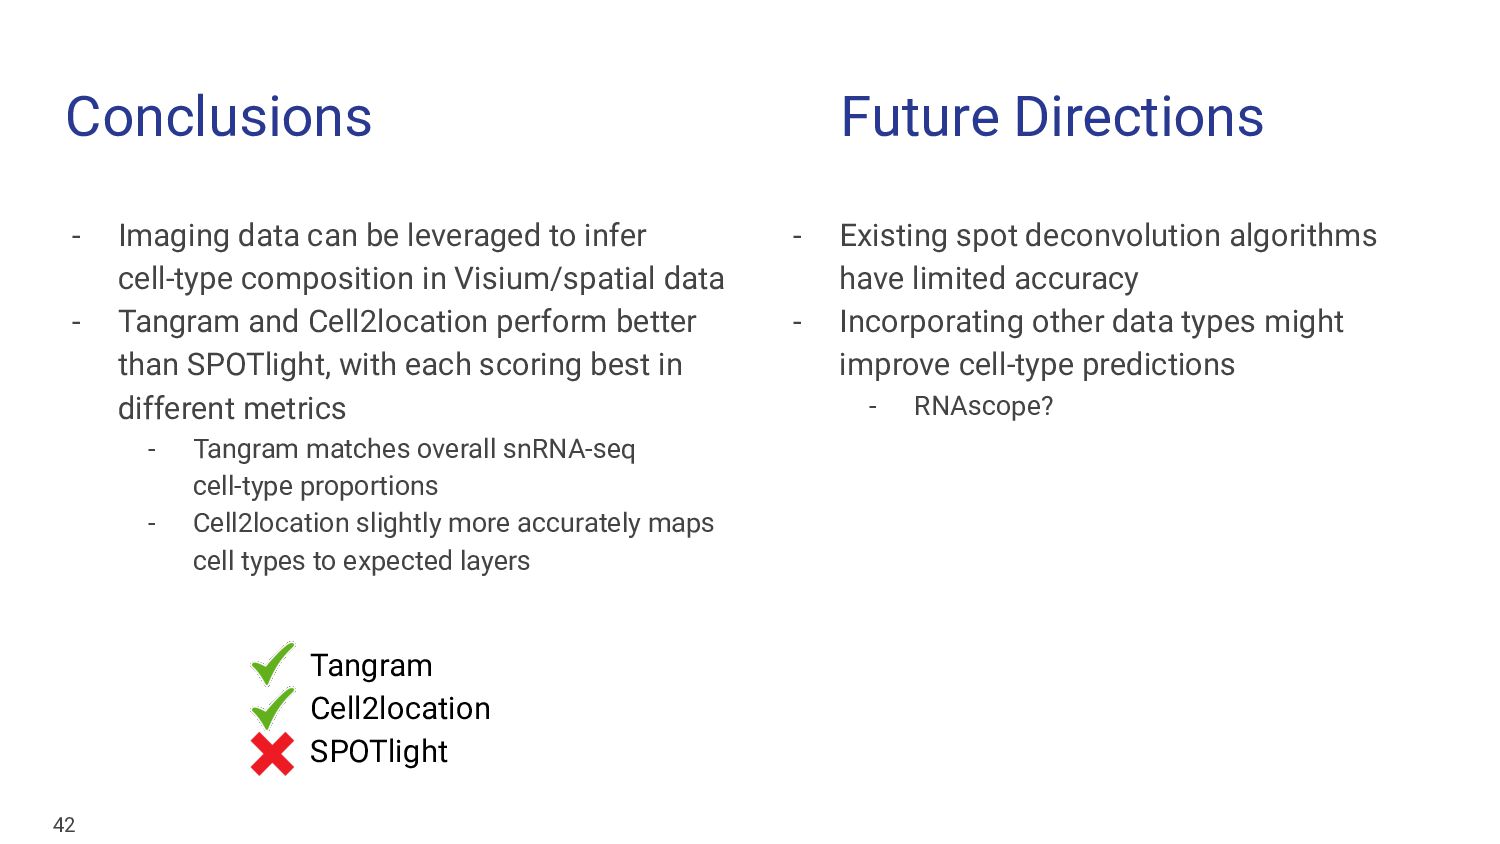
    composition in Visium/spatial data - Tangram and Cell2location perform better than SPOTlight, with each scoring best in different metrics - Tangram matches overall snRNA-seq cell-type proportions - Cell2location slightly more accurately maps cell types to expected layers 42 - Existing spot deconvolution algorithms have limited accuracy - Incorporating other data types might improve cell-type predictions - RNAscope? Future Directions Tangram Cell2location SPOTlight
  27. Get In Touch With Me Knowledge - Bulk RNA-seq and

    WGBS data processing - Installing and running GPU-based software - Nextflow, computational workflows Future Interests - Spatial and stitching Visium capture areas - Machine learning for genomics - Image processing 43 https://calendly.com/nick-eagles/25-minute-data-science-guidance-session DSGS By Week (2022) GitHub Contributions (~1 Year)
  28. Acknowledgements LIBD Annie B. Nguyen Leonardo Collado-Torres Kristen R. Maynard

    Louise Huuki-Myers Abby Spangler Kelsey D. Montgomery Sang Ho Kwon Heena R. Divecha Madhavi Tippani Matthew N. Tran Arta Seyedian Thomas M. Hyde Joel E. Kleinman Stephanie C. Page Keri Martinowich JHU Biostatistics Chaichontat Swirorarat Stephanie C. Hicks Boyi Guo JHU Biomedical Engineering Alexis Battle Prashanthi Ravichandran PsychENCODE consortium University College London Genetics and Genomic Medicine Mina Ryten Melissa Grant-Peters nick-eagles.github.io @Nick-Eagles Feel free to reach out! 44
  29. Counting “Correct” Layer Matches 45 Cell Type Expected Layer Astro

    L1 EndoMural L1 Excit L2-6 Excit_L2_3 L2 or L3 Excit_L3 L3 Excit_L4 L4 Excit_L5 L5 Excit_L5_6 L5 or L6 Excit_L6 L6 Inhib L2-6 Micro L1 or WM Oligo WM OPC L1 or WM