Upgrade to Pro — share decks privately, control downloads, hide ads and more …

Bike Sharing in China Report

Ksubaka
June 13, 2017

Bike Sharing in China Report

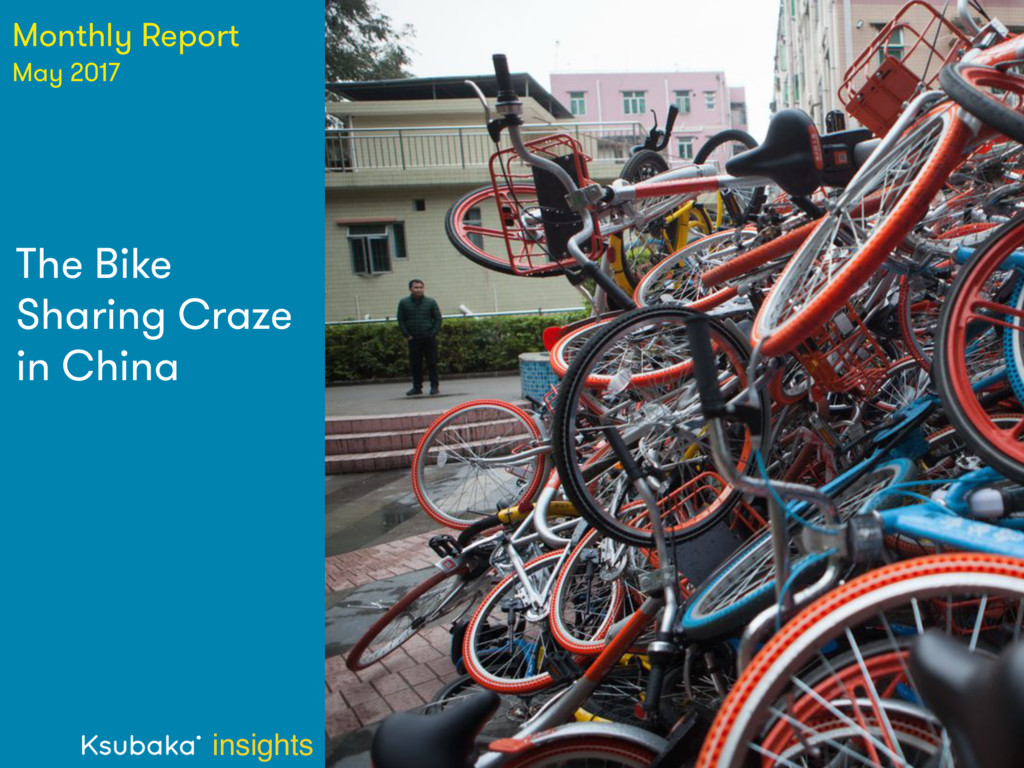
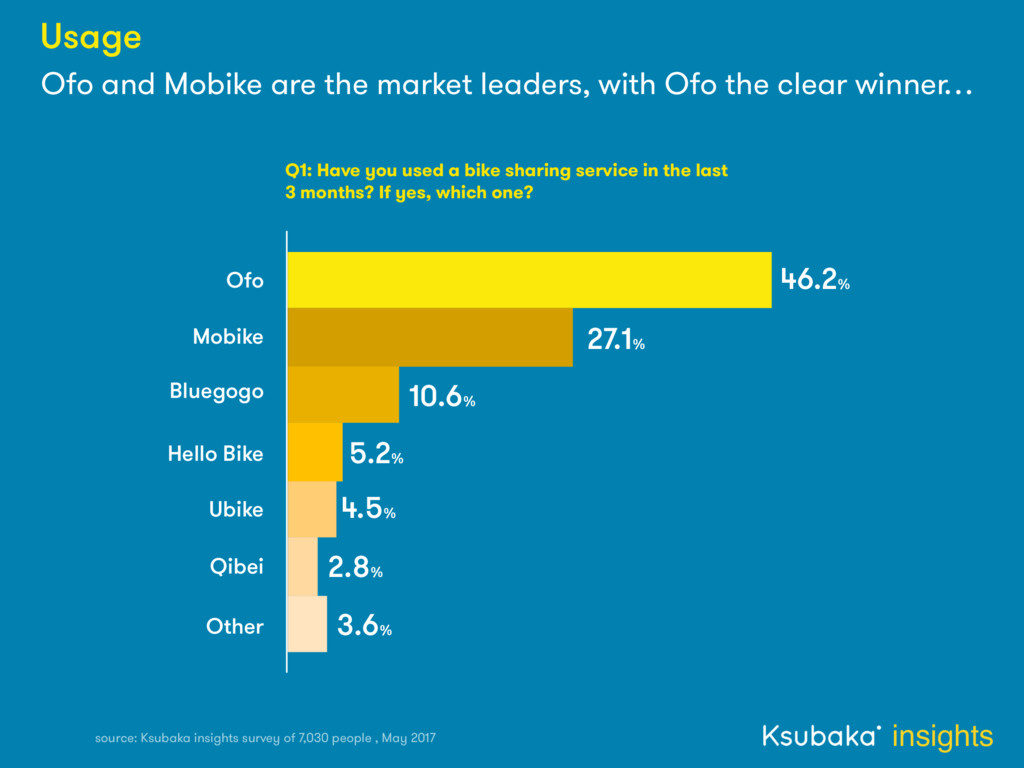
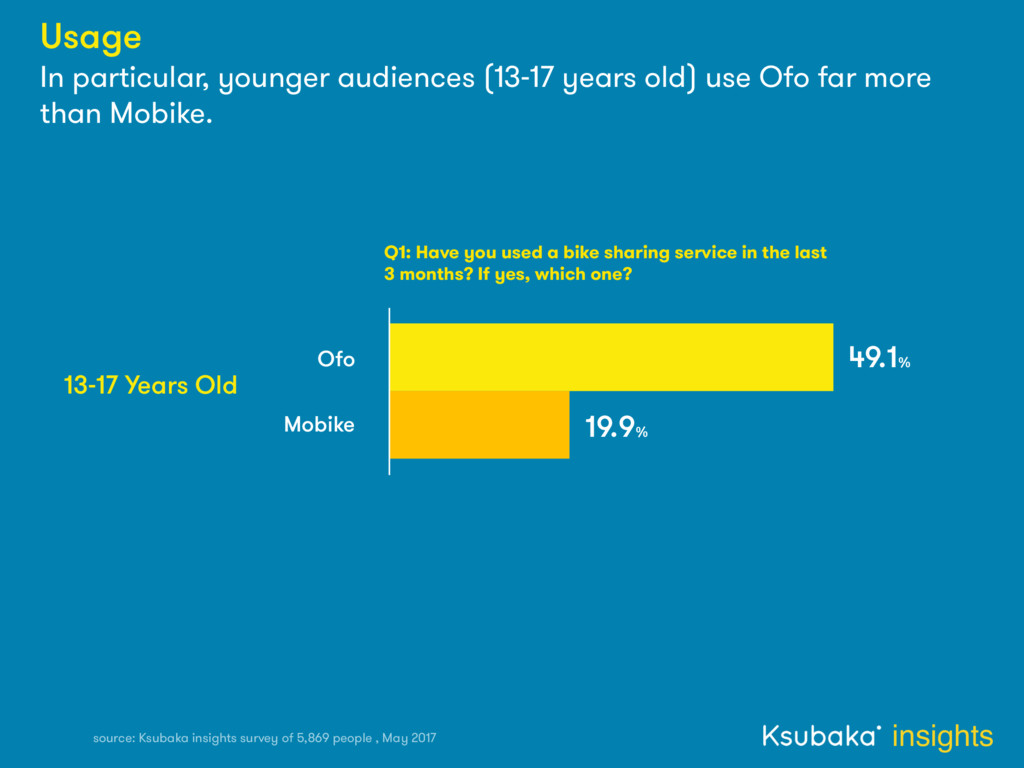
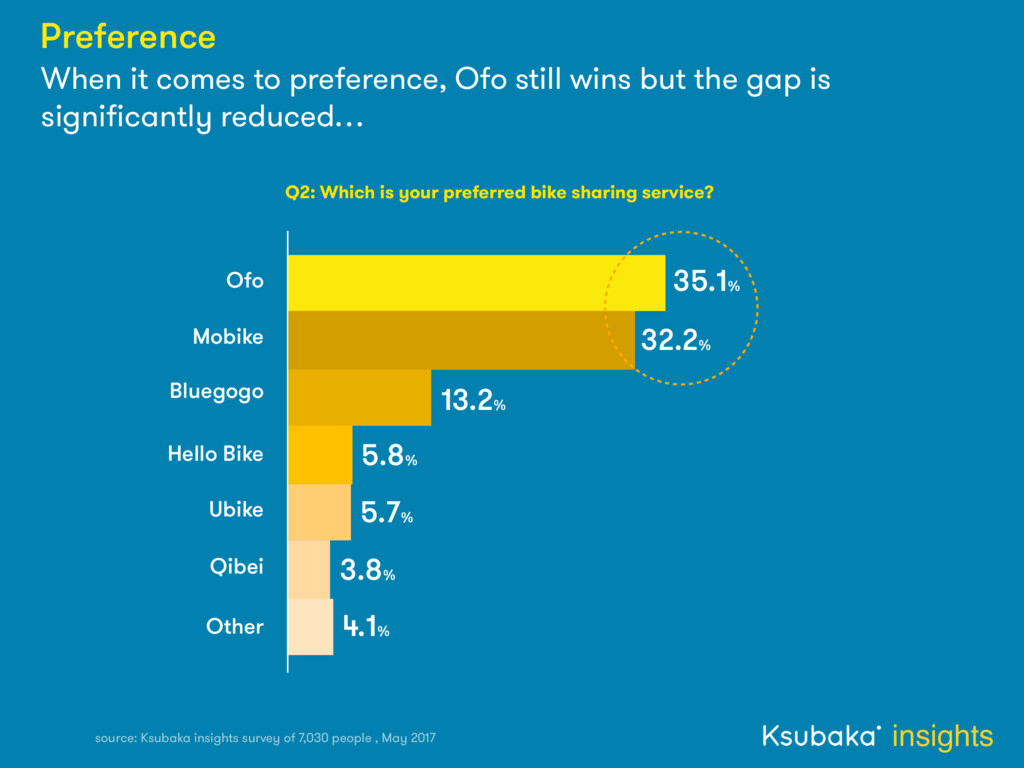
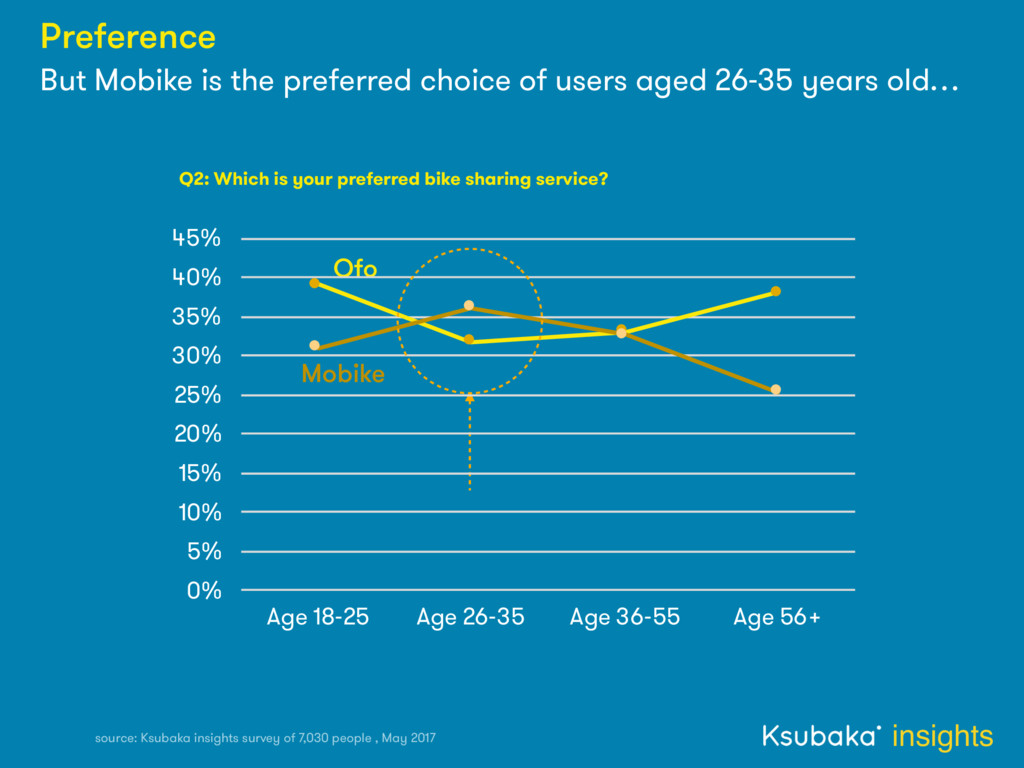
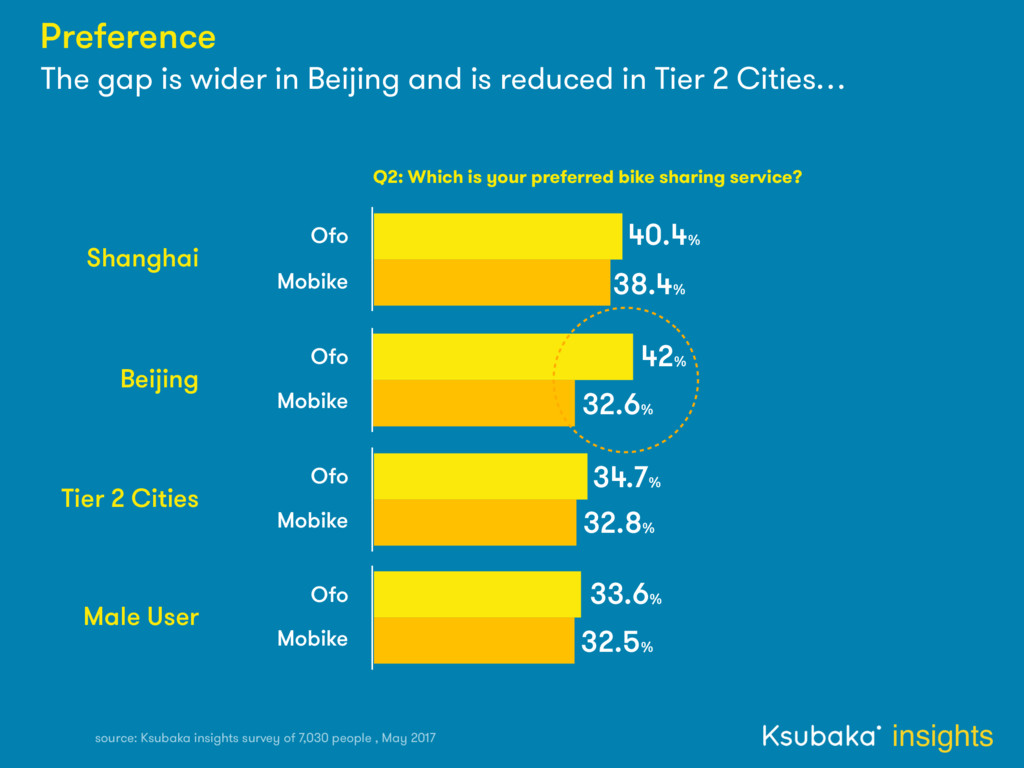
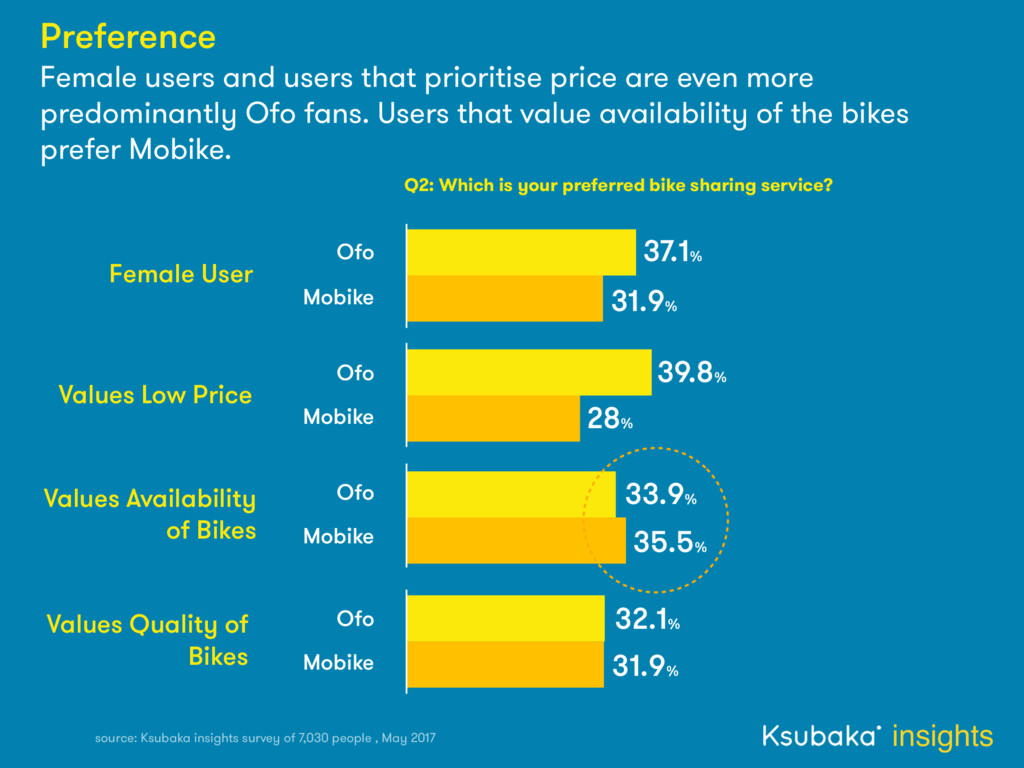
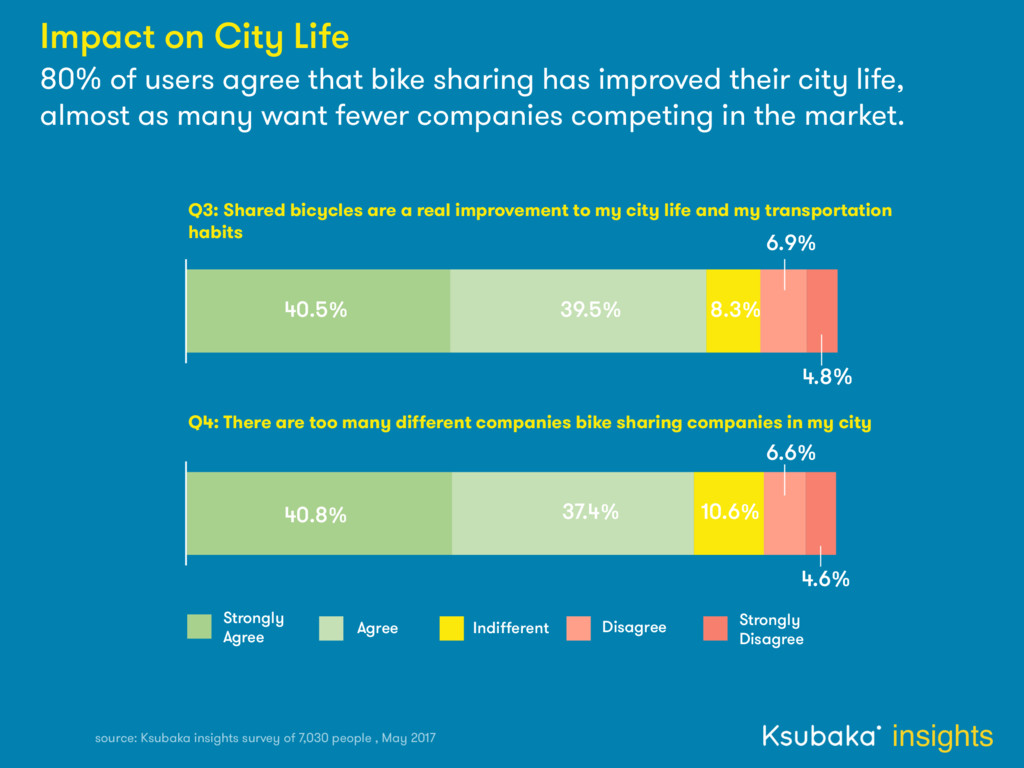
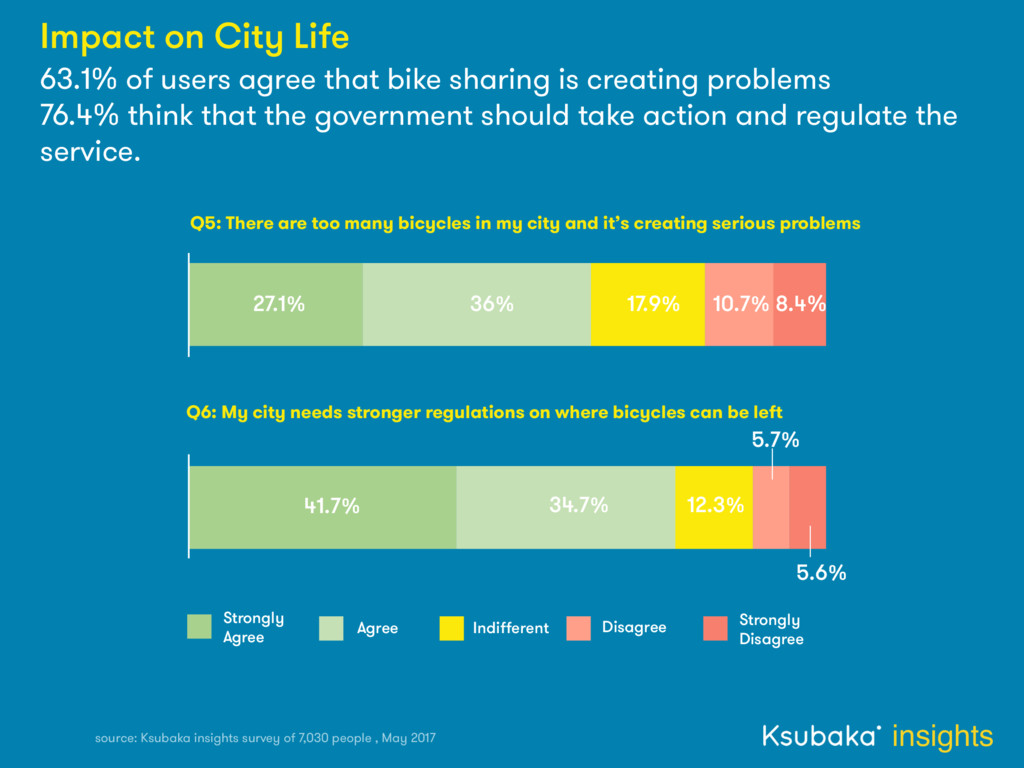
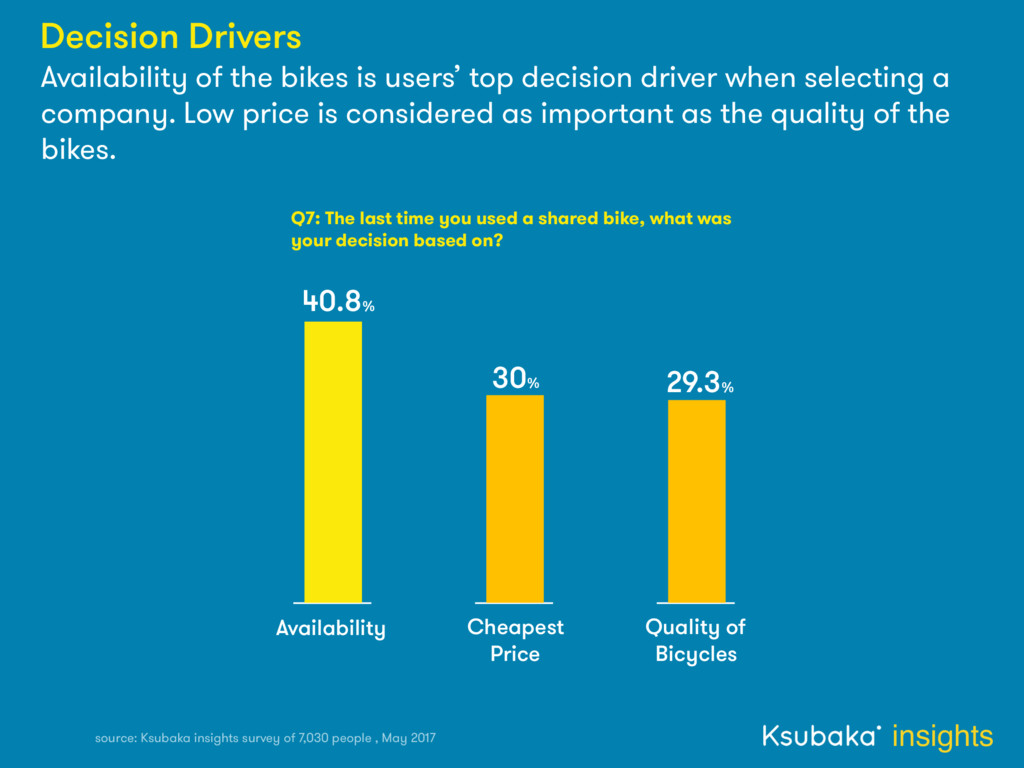
Exposing the bike share dilemma – Ksubaka Insights delves deep into the psyche of the Chinese and their love/hate relationship with bike sharing and investigates the current competition between market leaders - ofo and Mobike.

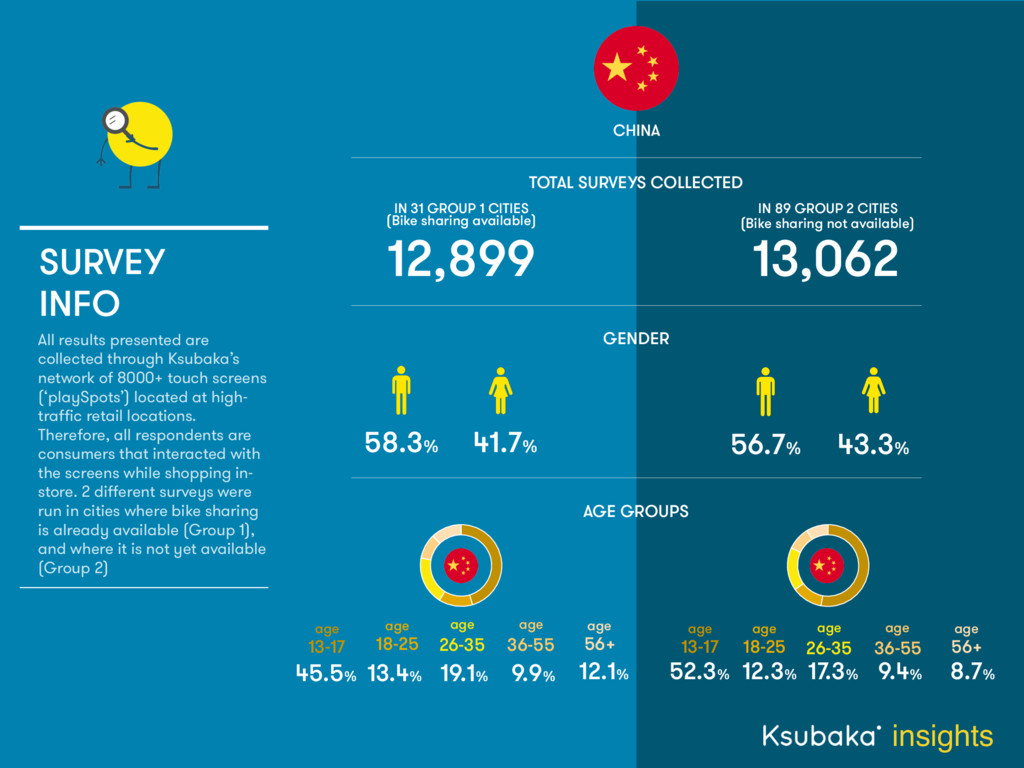
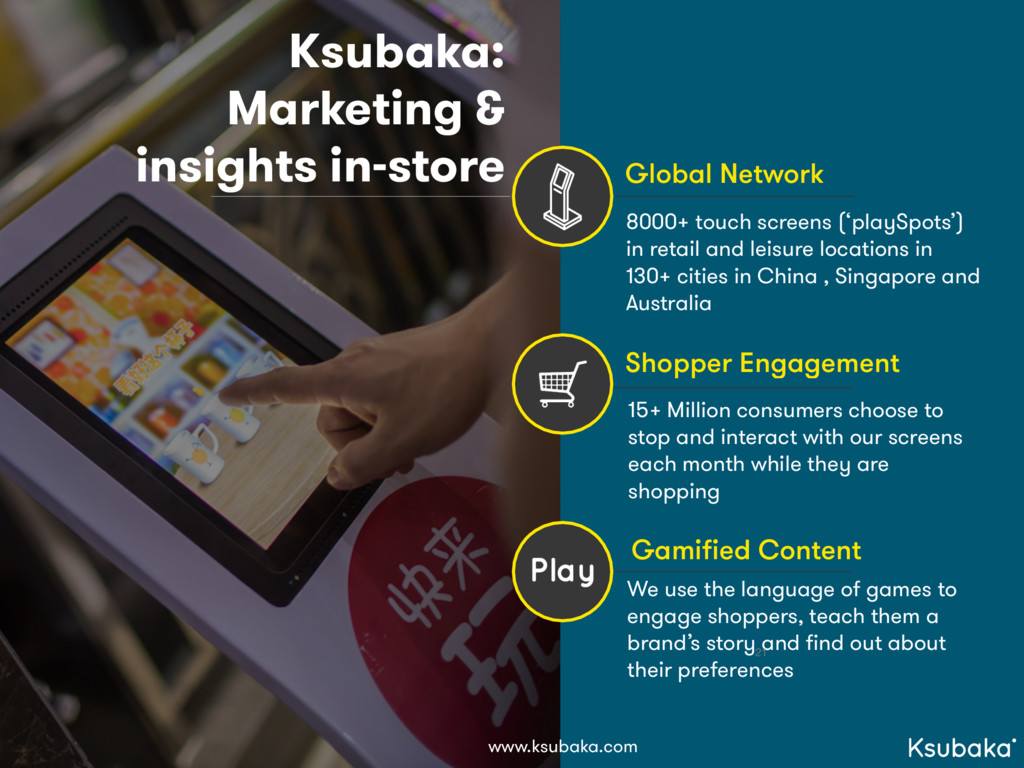
Ksubaka’s 8000 + interactive kiosks located in 130 cities across China engage with 15 million shoppers every month. These kiosks not only allow Interactive apps that use the language of games to tell brand stories but now also give unparalleled insight into consumer trends - in a matter of hours.

Ksubaka

June 13, 2017
Tweet

Other Decks in Business

Transcript

  1. SURVEY INFO All results presented are collected through Ksubaka’s network

    of 8000+ touch screens (‘playSpots’) located at high- traffic retail locations. Therefore, all respondents are consumers that interacted with the screens while shopping in- store. 2 different surveys were run in cities where bike sharing is already available (Group 1), and where it is not yet available (Group 2) 58.3% 41.7% age 18-25 13.4% age 26-35 19.1% age 56+ age 36-55 9.9% GENDER TOTAL SURVEYS COLLECTED 12,899 CHINA 13,062 43.3% 56.7% AGE GROUPS 12.1% 52.3% 12.3% 17.3% 9.4% IN 31 GROUP 1 CITIES IN 89 GROUP 2 CITIES (Bike sharing available) (Bike sharing not available) insights age 13-17 45.5% age 18-25 age 26-35 age 56+ age 36-55 age 13-17 8.7%
  2. Group 1 Cities where bike sharing is available insights Beijing

    Xi'an Shenzhen Guangzhou Zhuhai Chongqing Dongguan Hefei Jinan Nanchang Shijiazhuang Foshan Changsha Nanjing Tianjin Wuxi Hangzhou Ningbo Shanghai Wuhan Yantai Zhengzhou Xuzhou Nanning Quanzhou Fuzhou-福州 Xiamen Kunming Chengdu Haikou Shantou
  3. Usage Ofo and Mobike are the market leaders, with Ofo

    the clear winner… Ofo 46.2% 27.1% 10.6% 4.5% 5.2% 2.8% 3.6% Mobike Bluegogo Hello Bike Ubike Qibei Other Q1: Have you used a bike sharing service in the last 3 months? If yes, which one? insights source: Ksubaka insights survey of 7,030 people , May 2017
  4. Usage In particular, younger audiences (13-17 years old) use Ofo

    far more than Mobike. insights 49.1% 19.9% source: Ksubaka insights survey of 5,869 people , May 2017 Q1: Have you used a bike sharing service in the last 3 months? If yes, which one? Ofo Mobike 13-17 Years Old
  5. Preference When it comes to preference, Ofo still wins but

    the gap is significantly reduced… Ofo Mobike Bluegogo Hello Bike Ubike Qibei Other Q2: Which is your preferred bike sharing service? insights 35.1% 32.2% 13.2% 5.7% 5.8% 3.8% 4.1% source: Ksubaka insights survey of 7,030 people , May 2017
  6. But Mobike is the preferred choice of users aged 26-35

    years old… Q2: Which is your preferred bike sharing service? insights Ofo Mobike 0% 5% 10% 15% 20% 25% 30% 35% 40% 45% Age 18-25 Age 26-35 Age 36-55 Age 56+ source: Ksubaka insights survey of 7,030 people , May 2017 Preference
  7. The gap is wider in Beijing and is reduced in

    Tier 2 Cities… insights Q2: Which is your preferred bike sharing service? Ofo Mobike Ofo Mobike Ofo Mobike Ofo Mobike 40.4% 38.4% 42% 32.6% 34.7% 32.8% 33.6% 32.5% Shanghai Beijing Tier 2 Cities Male User source: Ksubaka insights survey of 7,030 people , May 2017 Preference
  8. Female users and users that prioritise price are even more

    predominantly Ofo fans. Users that value availability of the bikes prefer Mobike. insights Q2: Which is your preferred bike sharing service? Ofo Mobike Ofo Mobike Ofo Mobike Ofo Mobike Female User Values Low Price Values Availability of Bikes Values Quality of Bikes 37.1% 31.9% 39.8% 28% 33.9% 35.5% 32.1% 31.9% source: Ksubaka insights survey of 7,030 people , May 2017 Preference
  9. 80% of users agree that bike sharing has improved their

    city life, almost as many want fewer companies competing in the market. Q3: Shared bicycles are a real improvement to my city life and my transportation habits Q4: There are too many different companies bike sharing companies in my city Strongly Agree Agree Indifferent Disagree Strongly Disagree 40.5% 39.5% 8.3% 6.9% 4.8% 40.8% 37.4% 10.6% 6.6% 4.6% insights Impact on City Life source: Ksubaka insights survey of 7,030 people , May 2017
  10. Q5: There are too many bicycles in my city and

    it’s creating serious problems Q6: My city needs stronger regulations on where bicycles can be left 27.1% 36% 17.9% 10.7% 8.4% 41.7% 34.7% 12.3% 5.7% 5.6% 63.1% of users agree that bike sharing is creating problems 76.4% think that the government should take action and regulate the service. insights source: Ksubaka insights survey of 7,030 people , May 2017 Impact on City Life Strongly Agree Agree Indifferent Disagree Strongly Disagree
  11. Availability of the bikes is users’ top decision driver when

    selecting a company. Low price is considered as important as the quality of the bikes. Cheapest Price Availability Quality of Bicycles 30% 40.8% 29.3% insights Q7: The last time you used a shared bike, what was your decision based on? Decision Drivers source: Ksubaka insights survey of 7,030 people , May 2017
  12. Availability Quality Price Users aged 26-55 value quality over price.

    Older generations aged 56+ are particularly price sensitive. 0% 5% 10% 15% 20% 25% 30% 35% 40% 45% Age 18-25 Age 26-35 Age 36-55 Age 56+ Q7: The last time you used a shared bike, what was your decision based on? insights source: Ksubaka insights survey of 7,030 people , May 2017 Decision Drivers
  13. Overall, retention of users would stay high if prices were

    doubled: 78.1% of users would continue using shared bikes. Ofo users are slightly more price sensitive than Mobike users. Yes, I would use shared bikes as often Yes, but I would use shared bikes less often No, I would stop using shared bikes Average Ofo Mobike 37.5% 33.9% 39.6% 40.6% 42.5% 41.5% 21.9% 23.6% 18.8% Q8: Would you continue using shared bikes if the price per hour was doubled? insights Prices source: Ksubaka insights survey of 7,030 people , May 2017
  14. Group 2 Cities where bike sharing is not yet available

    insights Liuyang Anqing Beihai Bozhou Chaozhou Chenzhou Daqing Datong Danzhou Dongying Harbin Heyuan Hohhot Huaibei Jiaxing Jingdezhen Linfen Linyi Lvliang Qinzhou Suqian Taiyuan Tongling Wuhu Wuwei Xinxiang Yancheng Yinchuan Yingkou Yingtan Yueyang Changchun Zhongshan Zigong Jiangmen Huizhou Zhenjiang Nanchong Songyuan Wuzhong Anshan Yangzhou Shenyang Huai'an Suzhou-宿州 Changzhou Suzhou-苏州 Nantong Taizhou-泰州 Shaoxing Chuzhou Huainan Dalian Lanzhou Luoyang Qingdao Tangshan Weinan Xianyang Ziyang Xinyang Dandong Benxi Liaoyang Fushun Taizhou-台州 Zhoushan Jinhua Shangrao Fuzhou-抚州 Xinyu Huzhou Ganzhou Zhangjiakou Jining Zibo Qinhuangdao Lu'an Xuancheng Chizhou Bengbu Lianyungang Fuyang Ma'anshan Sanmenxia Urumqi Shangluo Ankang Baoji Zhangye Baiyin Yichun-宜春 Qingyuan Zunyi Zhaoqing Zhanjiang Maoming Yangjiang Jinjiang Ningde Hengyang Zhuzhou Baise Guang'an Jieyang Meizhou Lianjiang Hengshui Jilin Handan Pingxiang-萍乡 Ji'an-吉安 Cangzhou Liuzhou Changde Yunfu Yuncheng Yichang Guilin
  15. Only one quarter of respondents that live in cities where

    bike sharing is not yet available said that they ‘never’ use normal bicycles. Never Rarely Sometimes Often 25.9% 21.5% 20.9% 31.6% Usage of Bicycles Q1: Do you use bikes? insights source: ksubaka insights survey of 6,231 people , May 2017
  16. The majority of respondents said that they would use shared

    bikes given the chance…This is true even for those that in the previous question said that they ‘never’ use normal bikes. Yes 65.5% No I don’t know 21.5% 13.1% 50.8% Appetite for Shared Bikes insights Q2: Would you use shared bicycles? source: ksubaka insights survey of 6,231 people , May 2017 Respondents that ‘never’ use normal bicycles but would use shared bicycles
  17. 75.3% want to have shared bicycles in their city but

    it’s interesting that more than half of respondents also think that the service would cause problems in urban areas. 48.2% 27.1% 11.5% 6.4% 6.7% 31.2% 22.9% 18.5% 15.8% 11.6% Q3: I would like to have shared bicycles in my city insights Q4: I think shared bicycles could create problems in my city Impact on City Life source: ksubaka insights survey of 6,231 people , May 2017 Strongly Agree Agree Indifferent Disagree Strongly Disagree
  18. These results for Group 2 are remarkably similar to those

    collected in Group 1 cities: availability of bikes is still the highest decision driver with price and quality almost on par. Cheapest Price Availability Quality of Bicycles 29.9% 39% 31.1% Q5: How would you choose a shared bicycle service? insights Decision Drivers source: ksubaka insights survey of 6,231 people , May 2017
  19. Convenience to travel is the top reason for wanting shared

    bikes. Convenience to travel Fun to ride with friends Live a healthier lifestyle 43.1% 37.5% 19.4% Q5: Why would you use shared bicycles? insights Reasons to Use Shared Bikes source: ksubaka insights survey of 6,231 people , May 2017
  20. Ksubaka: Marketing & insights in-store Global Network Shopper Engagement Gamified

    Content 8000+ touch screens (‘playSpots’) in retail and leisure locations in 130+ cities in China , Singapore and Australia 15+ Million consumers choose to stop and interact with our screens each month while they are shopping We use the language of games to engage shoppers, teach them a brand’s story and find out about their preferences www.ksubaka.com 21