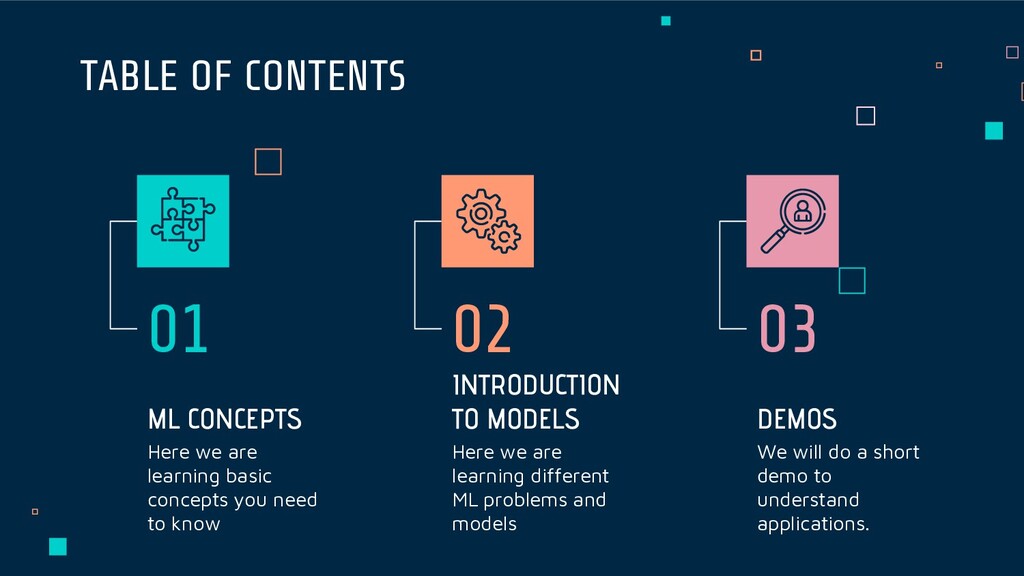
INTRODUCTION TO MODELS ML CONCEPTS Here we are learning basic concepts you need to know 01 Here we are learning different ML problems and models 02 TABLE OF CONTENTS 03
in machine learning is a procedure that is run on data to create a machine learning “model.” Machine learning algorithms perform “pattern recognition.” Algorithms “learn” from data, or are “fit” on a dataset.
Xbox-One Customer Days Played > 728 Income > $50K Xbox-One Customer Not Xbox-One Customer Xbox-One Customer MODEL (IF-ELSE STATEMENTS WITH SPECIFIC VALUES.)
past and present data and most commonly by analysis of trends. A commonplace example might be estimation of some variable of interest at some specified future date.
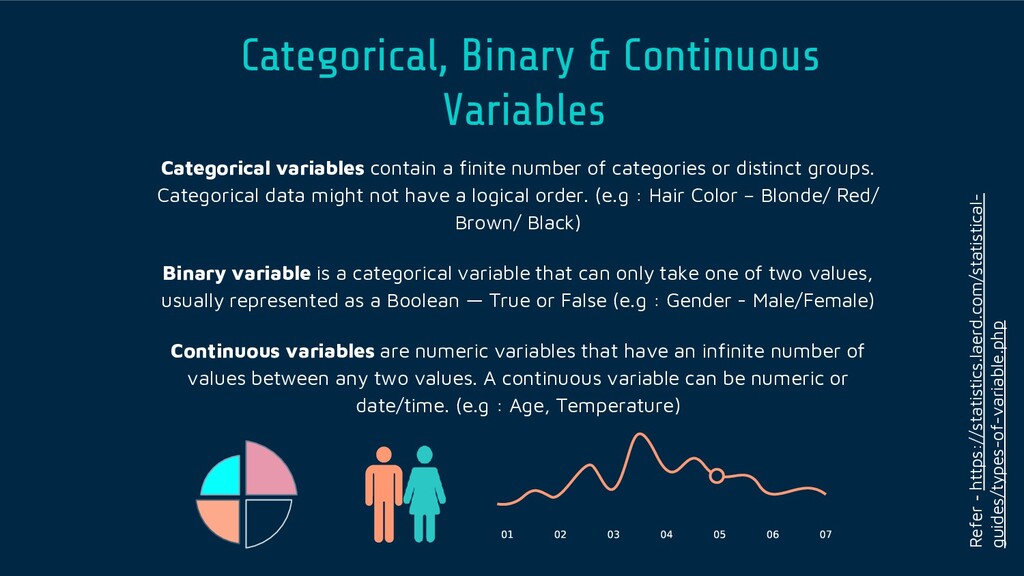
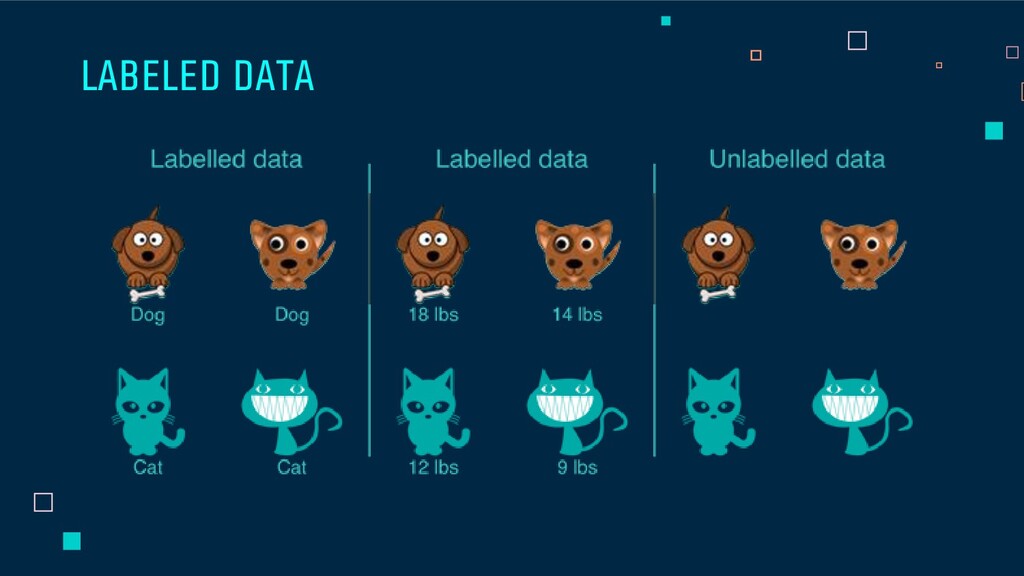
number of categories or distinct groups. Categorical data might not have a logical order. (e.g : Hair Color – Blonde/ Red/ Brown/ Black) Binary variable is a categorical variable that can only take one of two values, usually represented as a Boolean — True or False (e.g : Gender - Male/Female) Continuous variables are numeric variables that have an infinite number of values between any two values. A continuous variable can be numeric or date/time. (e.g : Age, Temperature) Refer - https://statistics.laerd.com/statistical- guides/types-of-variable.php
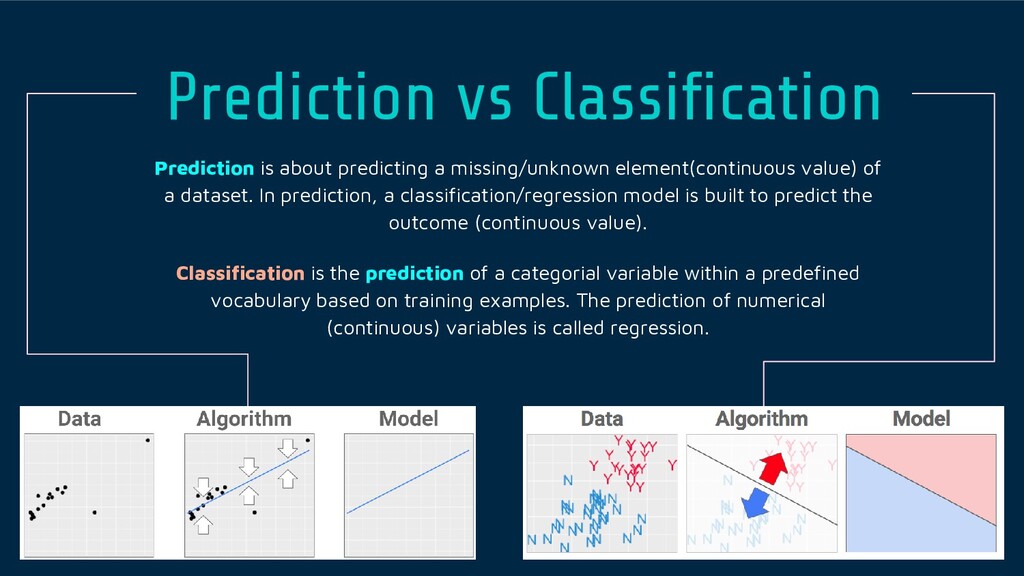
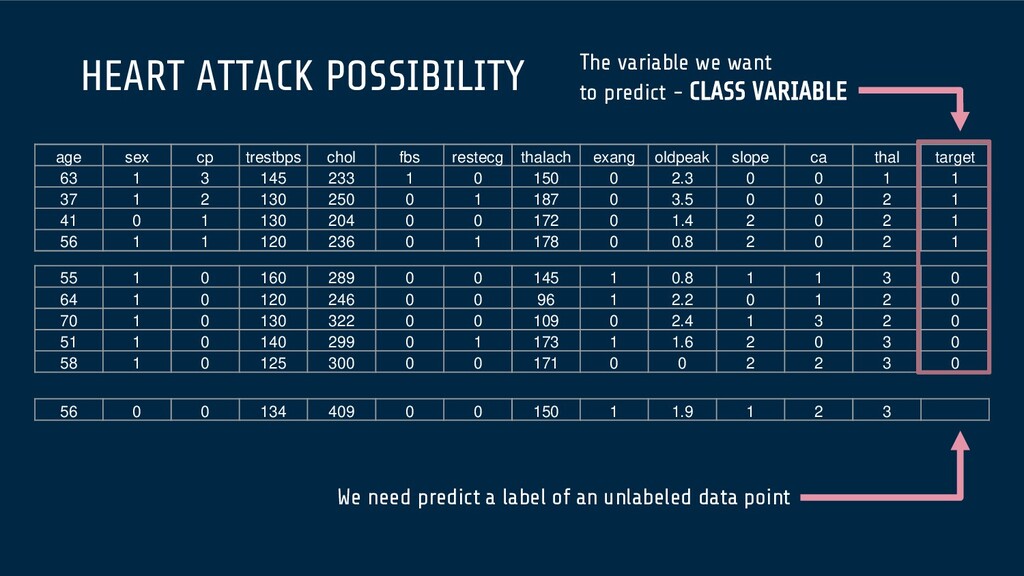
value) of a dataset. In prediction, a classification/regression model is built to predict the outcome (continuous value). Classification is the prediction of a categorial variable within a predefined vocabulary based on training examples. The prediction of numerical (continuous) variables is called regression.
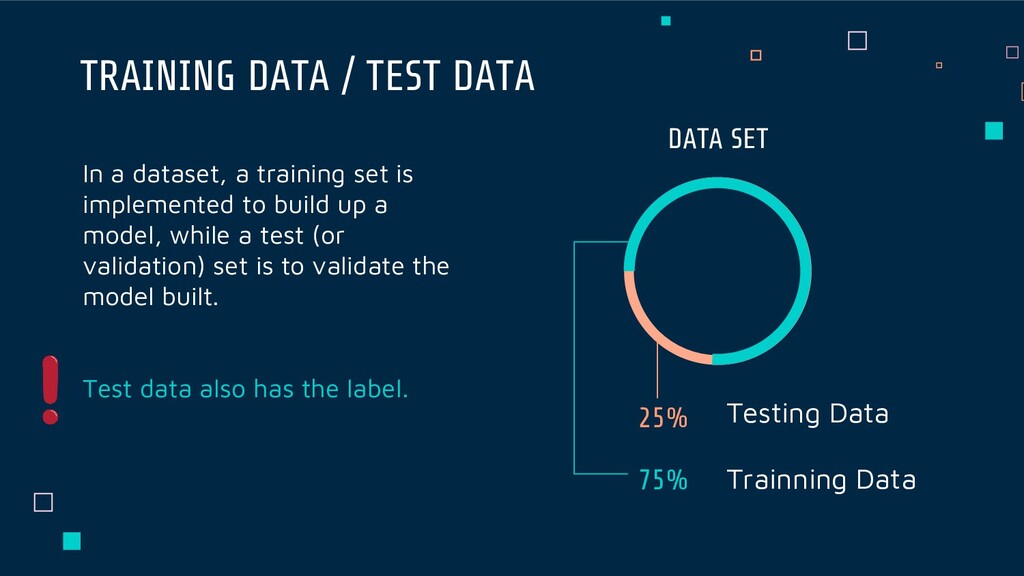
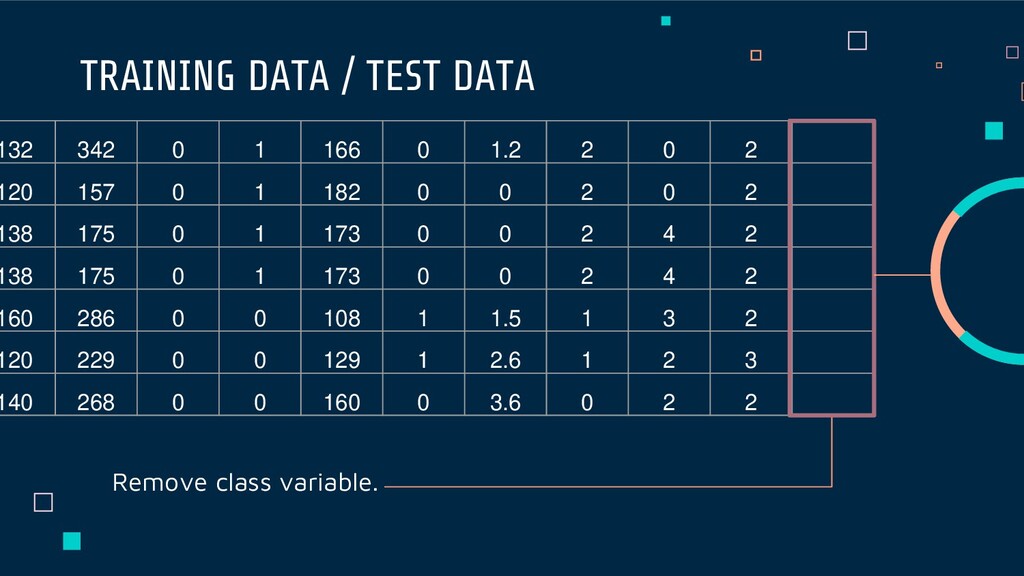
Data DATA SET In a dataset, a training set is implemented to build up a model, while a test (or validation) set is to validate the model built. Test data also has the label.
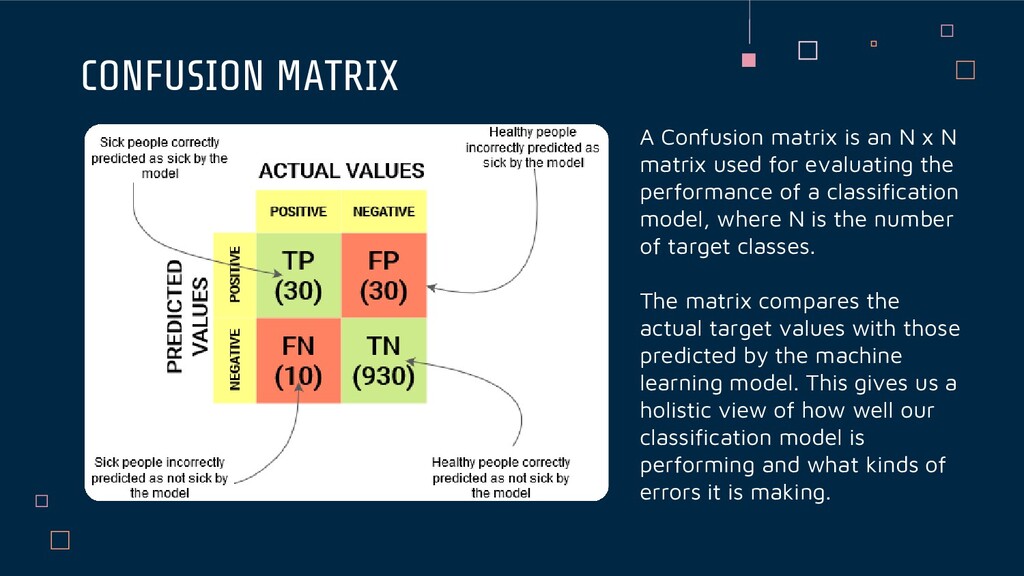
matrix used for evaluating the performance of a classification model, where N is the number of target classes. The matrix compares the actual target values with those predicted by the machine learning model. This gives us a holistic view of how well our classification model is performing and what kinds of errors it is making.
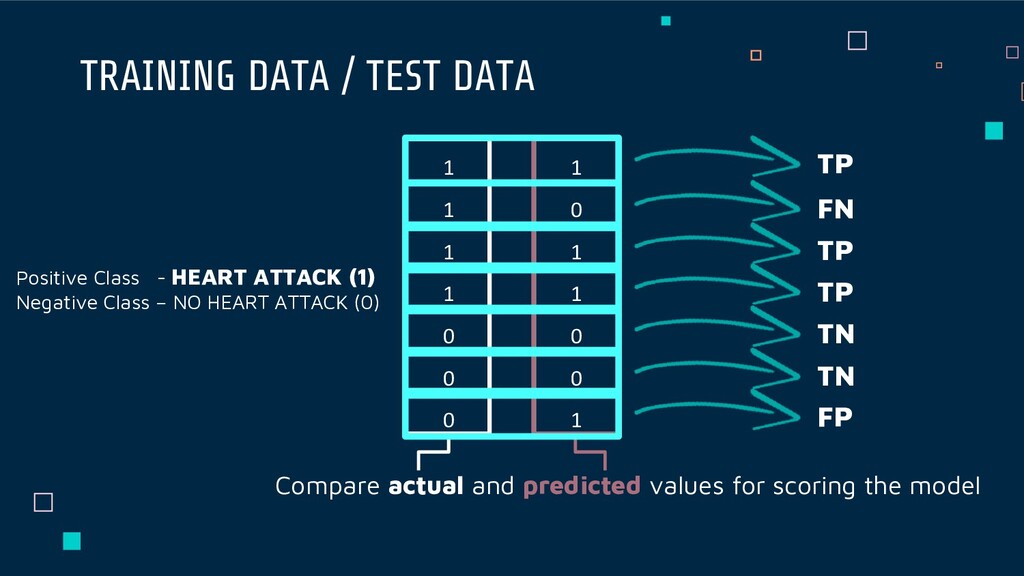
0 1 Compare actual and predicted values for scoring the model 1 1 1 1 0 0 0 TP FN TP TP TN TN FP Positive Class - HEART ATTACK (1) Negative Class – NO HEART ATTACK (0)
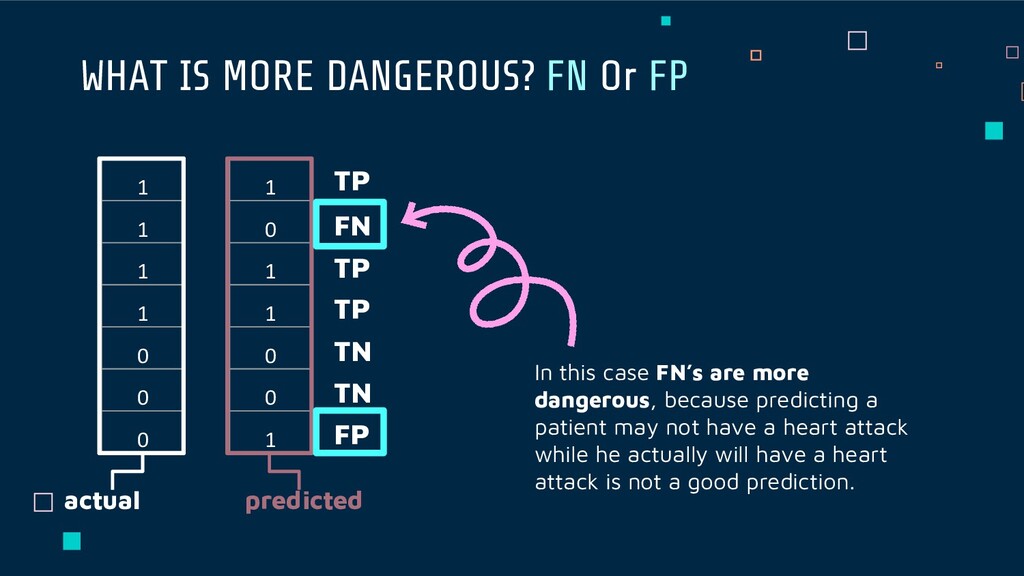
1 0 0 1 actual predicted 1 1 1 1 0 0 0 TP FN TP TP TN TN FP In this case FN’s are more dangerous, because predicting a patient may not have a heart attack while he actually will have a heart attack is not a good prediction.
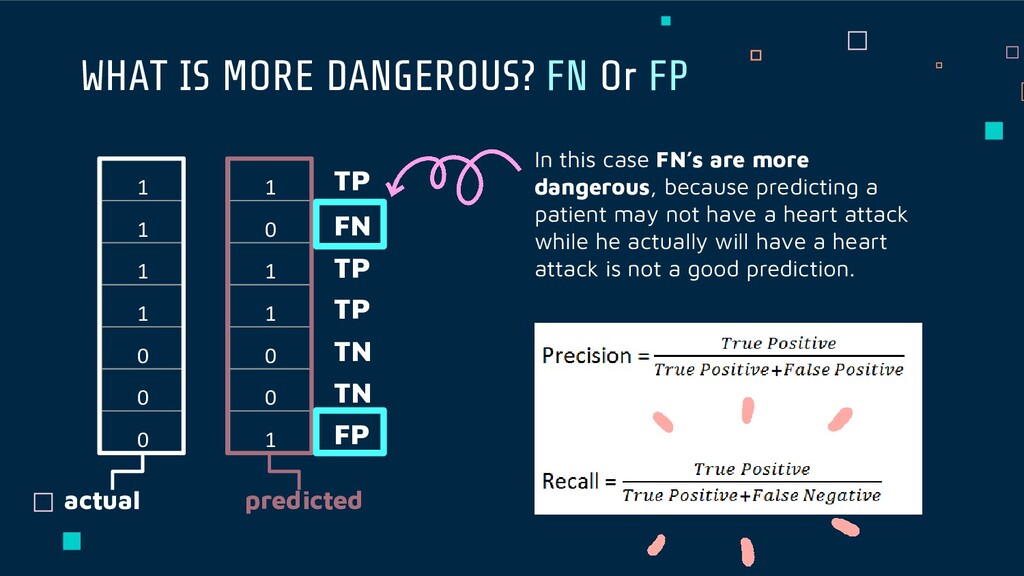
1 0 0 1 actual predicted 1 1 1 1 0 0 0 TP FN TP TP TN TN FP In this case FN’s are more dangerous, because predicting a patient may not have a heart attack while he actually will have a heart attack is not a good prediction.
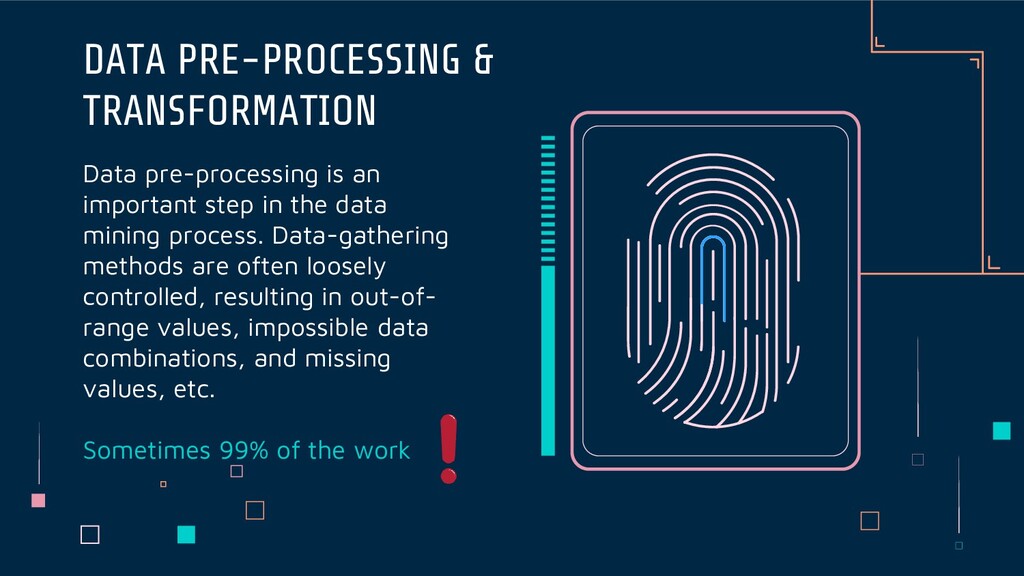
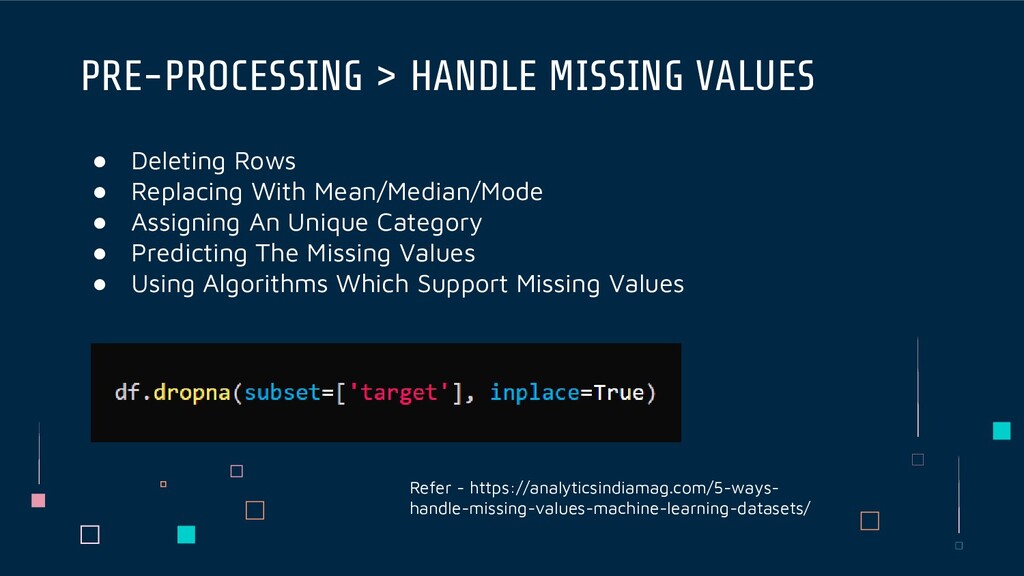
process. Data-gathering methods are often loosely controlled, resulting in out-of- range values, impossible data combinations, and missing values, etc. Sometimes 99% of the work DATA PRE-PROCESSING & TRANSFORMATION
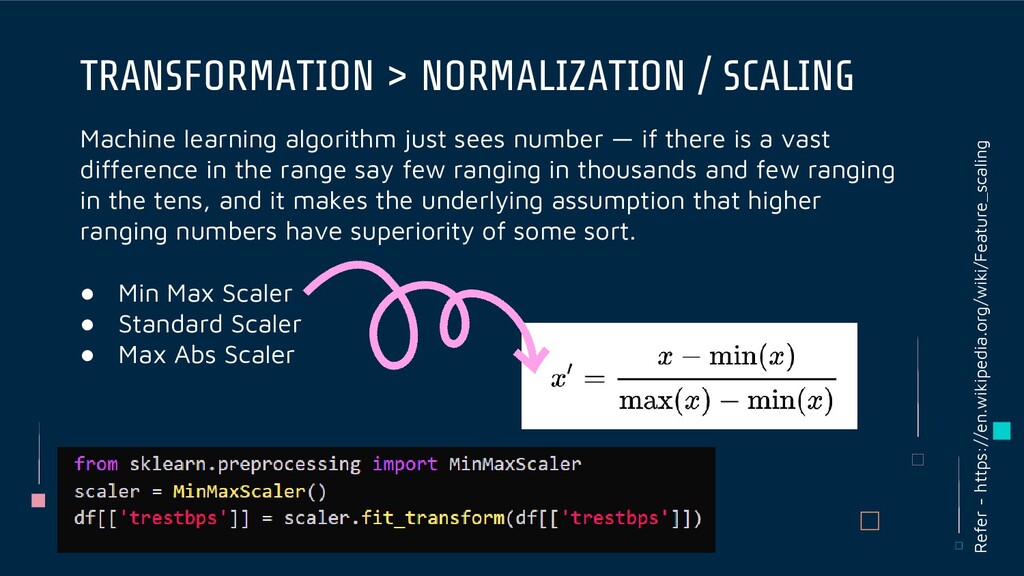
a vast difference in the range say few ranging in thousands and few ranging in the tens, and it makes the underlying assumption that higher ranging numbers have superiority of some sort. • Min Max Scaler • Standard Scaler • Max Abs Scaler TRANSFORMATION > NORMALIZATION / SCALING Refer - https://en.wikipedia.org/wiki/Feature_scaling
written in Python. It is capable of running on top of TensorFlow, Microsoft Cognitive Toolkit, R, Theano, or PlaidML. Designed to enable fast experimentation with deep neural networks, it focuses on being user- friendly, modular, and extensible. NumPy is a library for the Python programming language, adding support for large, multi- dimensional arrays and matrices, along with a large collection of high-level mathematical functions to operate on these arrays. SciPy is a free and open- source Python library used for scientific computing and technical computing. SciPy contains modules for optimization, linear algebra, integration, interpolation, special functions, FFT, signal and image processing, ODE solvers and other tasks common in science and engineering.
and differentiable programming across a range of tasks. It is a symbolic math library, and is also used for machine learning applications such as neural networks. Pandas is a software library written for the Python programming language for data manipulation and analysis. In particular, it offers data structures and operations for manipulating numerical tables and time series. You can use Google Colaboratory to run python code and ML projects. Colab notebooks allow you to combine executable code and rich text in a single document, along with images, HTML, LaTeX and more. Google Colaboratory is a free online cloud-based Jupyter notebook environment Visit https://colab.research.google.com
![[email protected] @NishanTheDev NishanChathuranga THANK YOU](https://files.speakerdeck.com/presentations/7a9b6502746e4ed1b6d9a190be76c9f8/slide_36.jpg)