2022, Amazon Web Services, Inc. or its affiliates. Transform data into information with ML-powered business intelligence Nicolas David (he/him) Senior Startup Solutions Architect, MEA Amazon Web Services
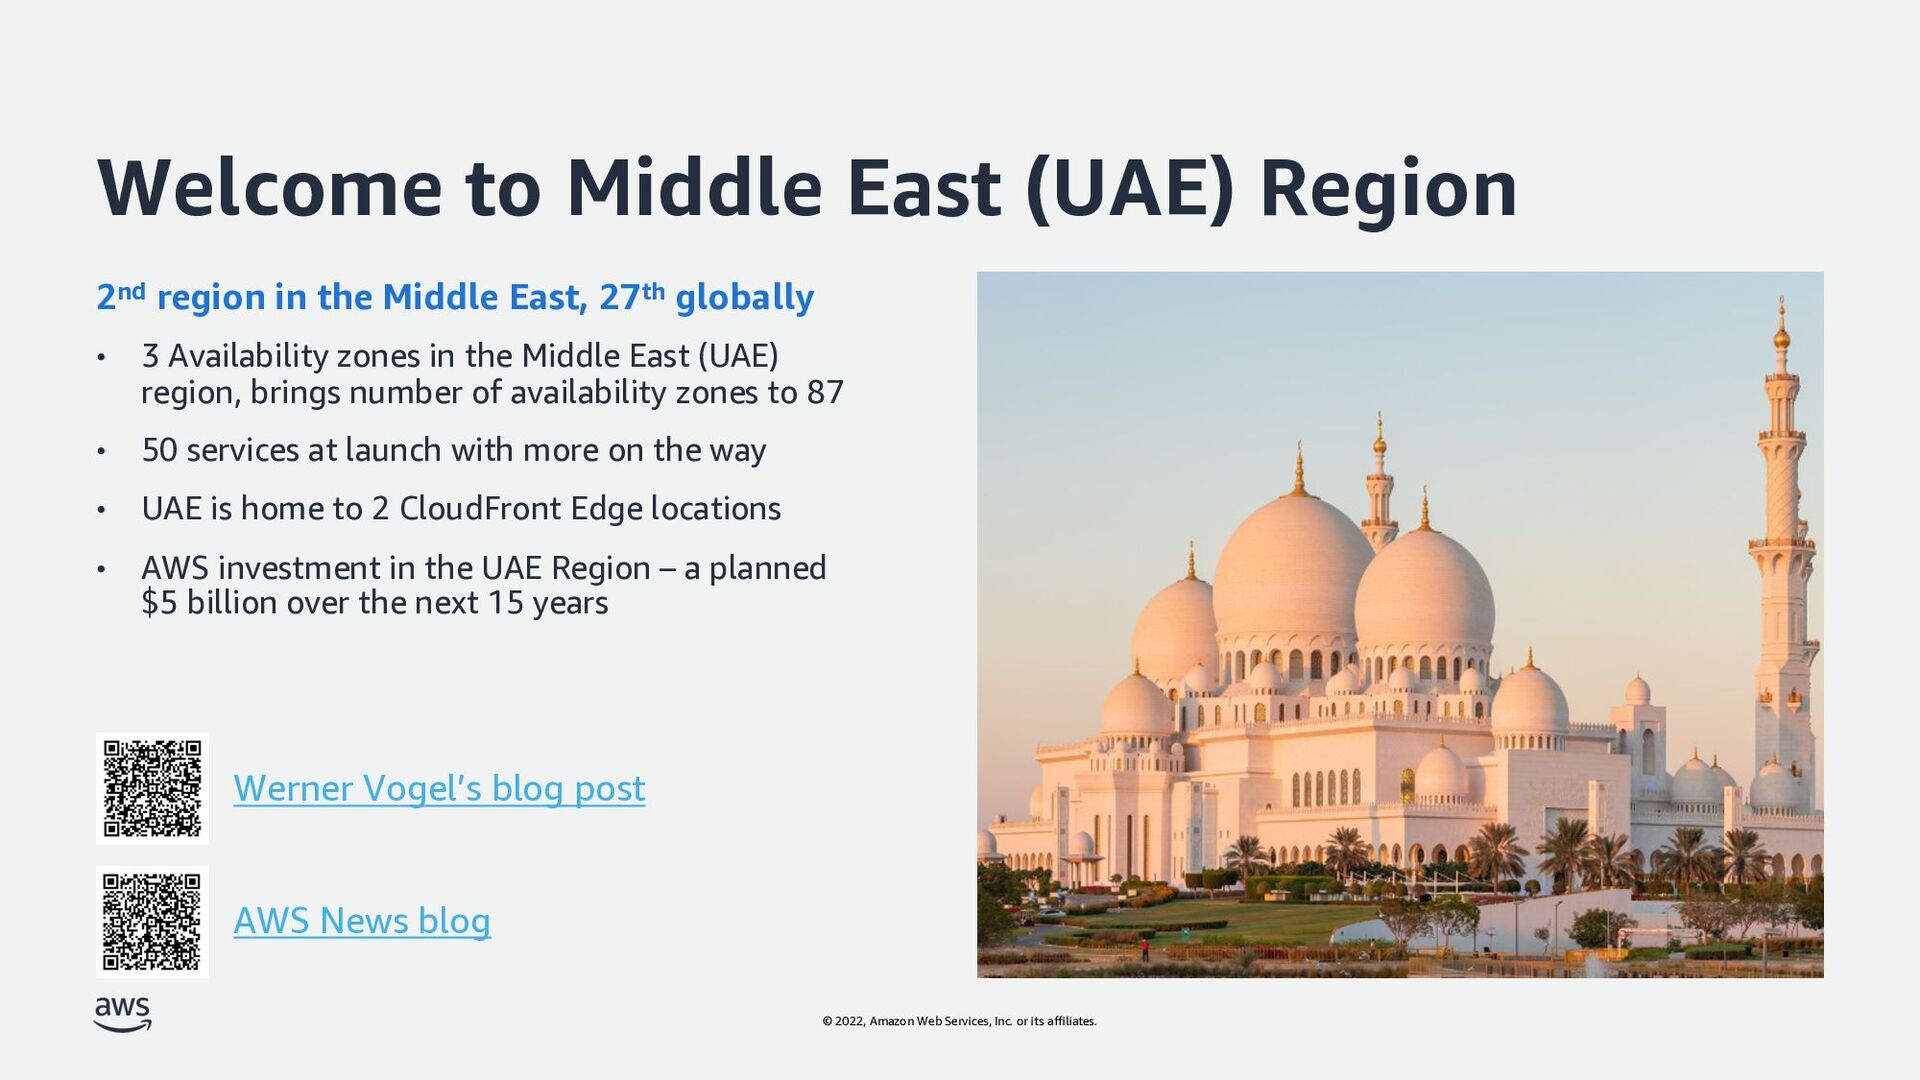
to Middle East (UAE) Region 2nd region in the Middle East, 27th globally • 3 Availability zones in the Middle East (UAE) region, brings number of availability zones to 87 • 50 services at launch with more on the way • UAE is home to 2 CloudFront Edge locations • AWS investment in the UAE Region – a planned $5 billion over the next 15 years Werner Vogel’s blog post AWS News blog
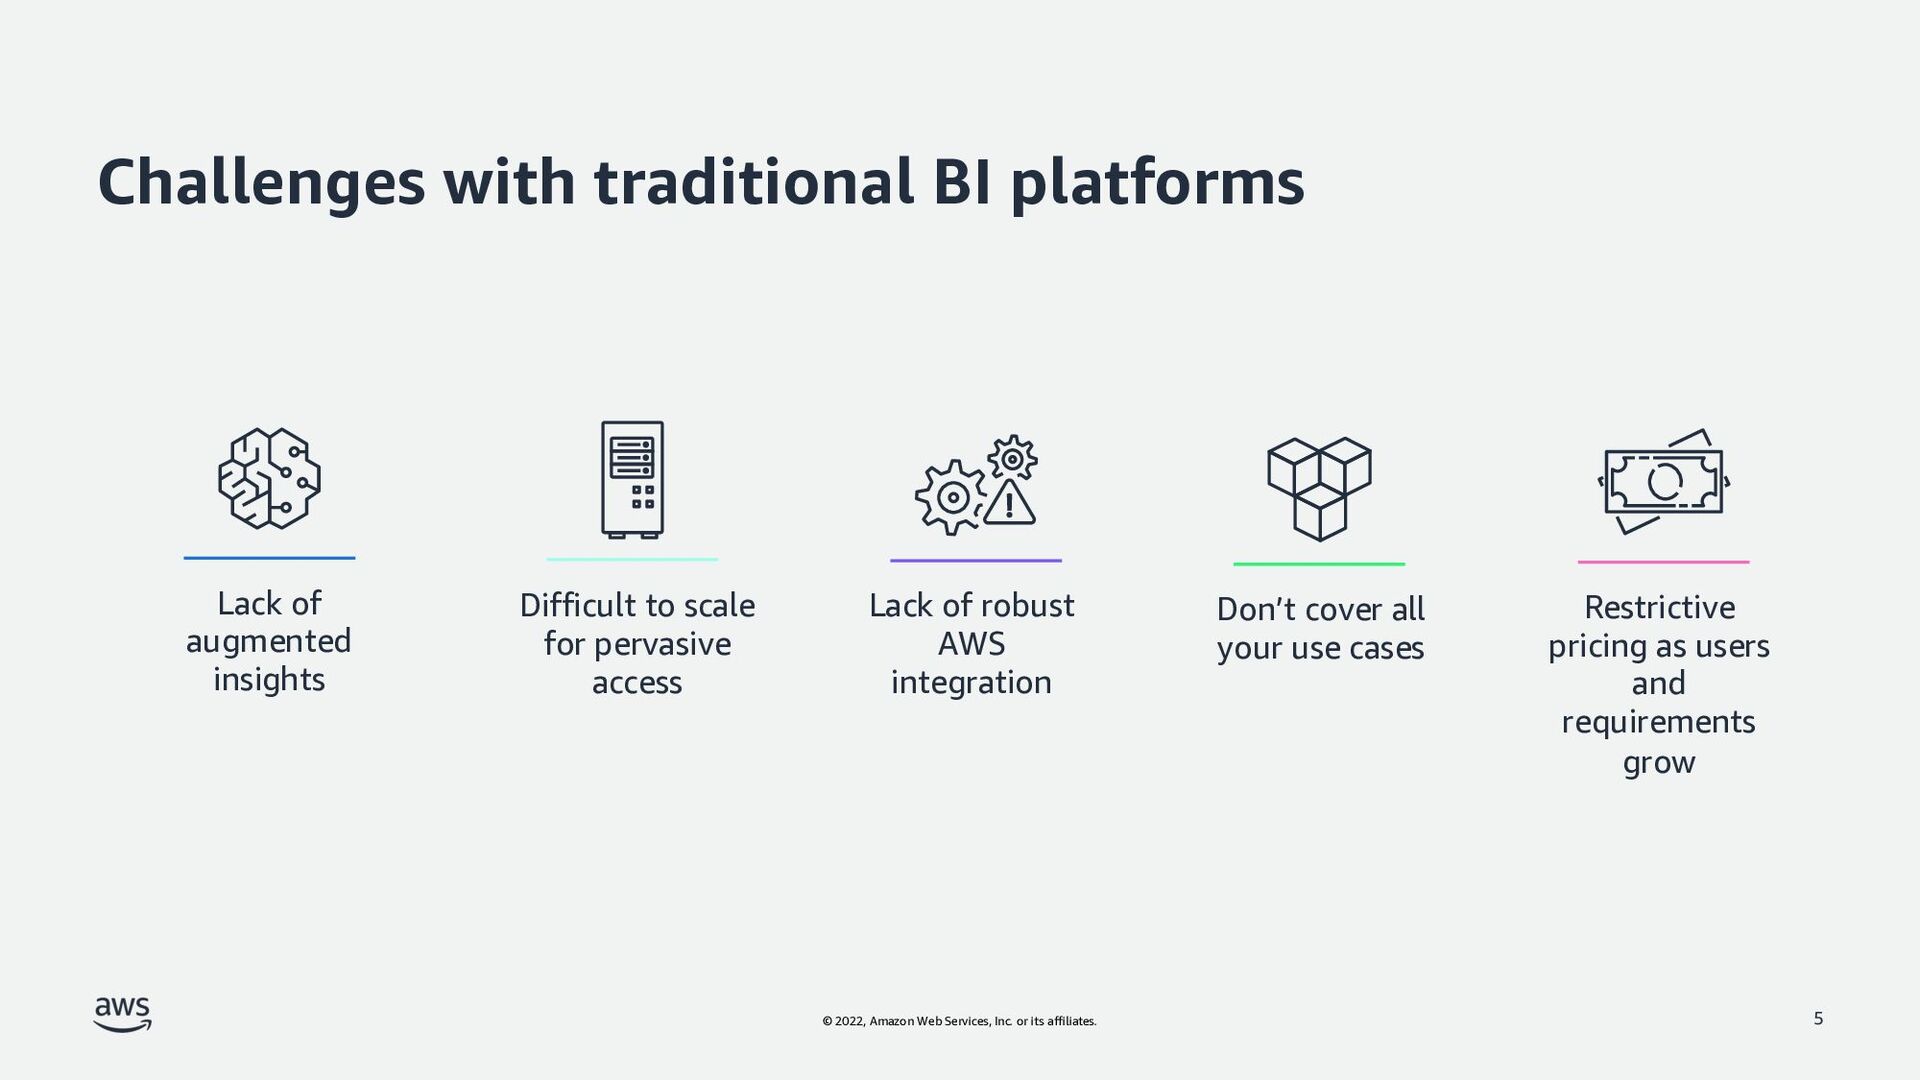
with traditional BI platforms 5 Restrictive pricing as users and requirements grow Lack of augmented insights Lack of robust AWS integration Don’t cover all your use cases Difficult to scale for pervasive access
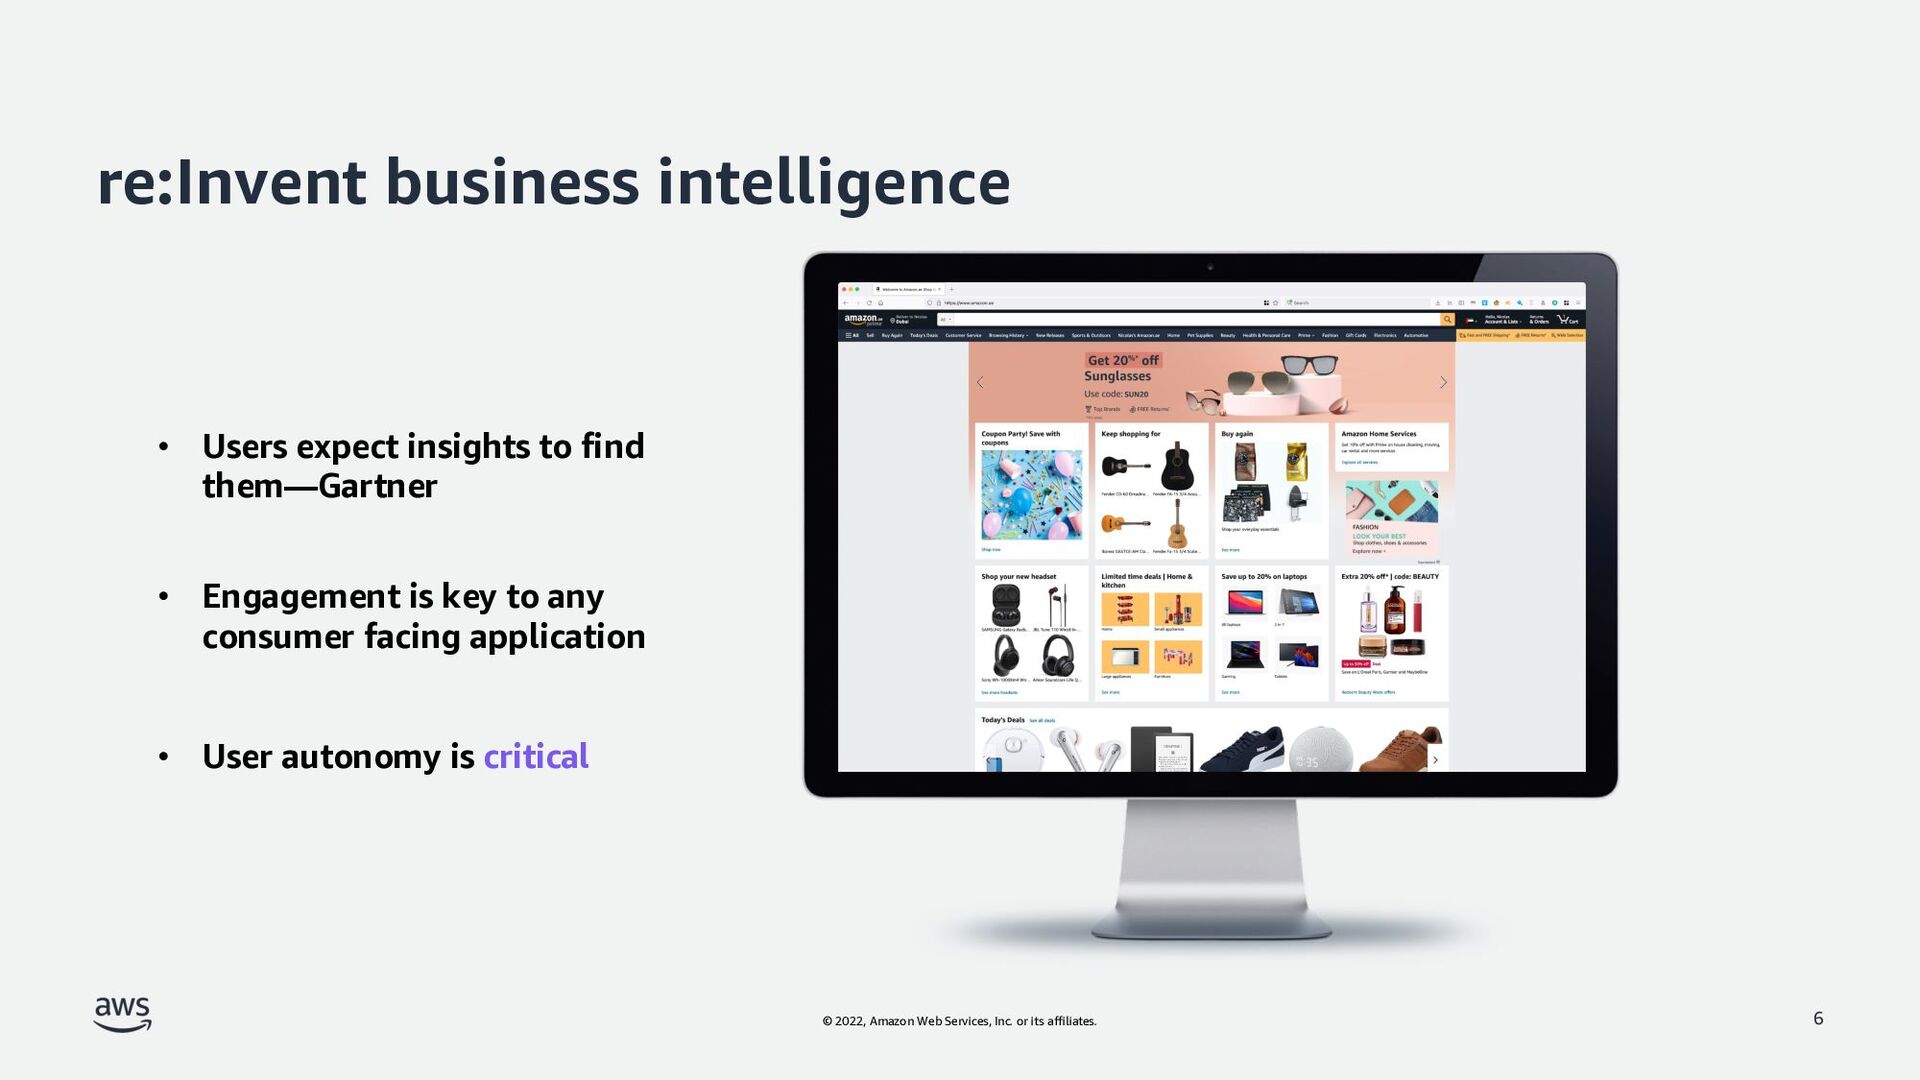
business intelligence 6 • Users expect insights to find them—Gartner • Engagement is key to any consumer facing application • User autonomy is critical
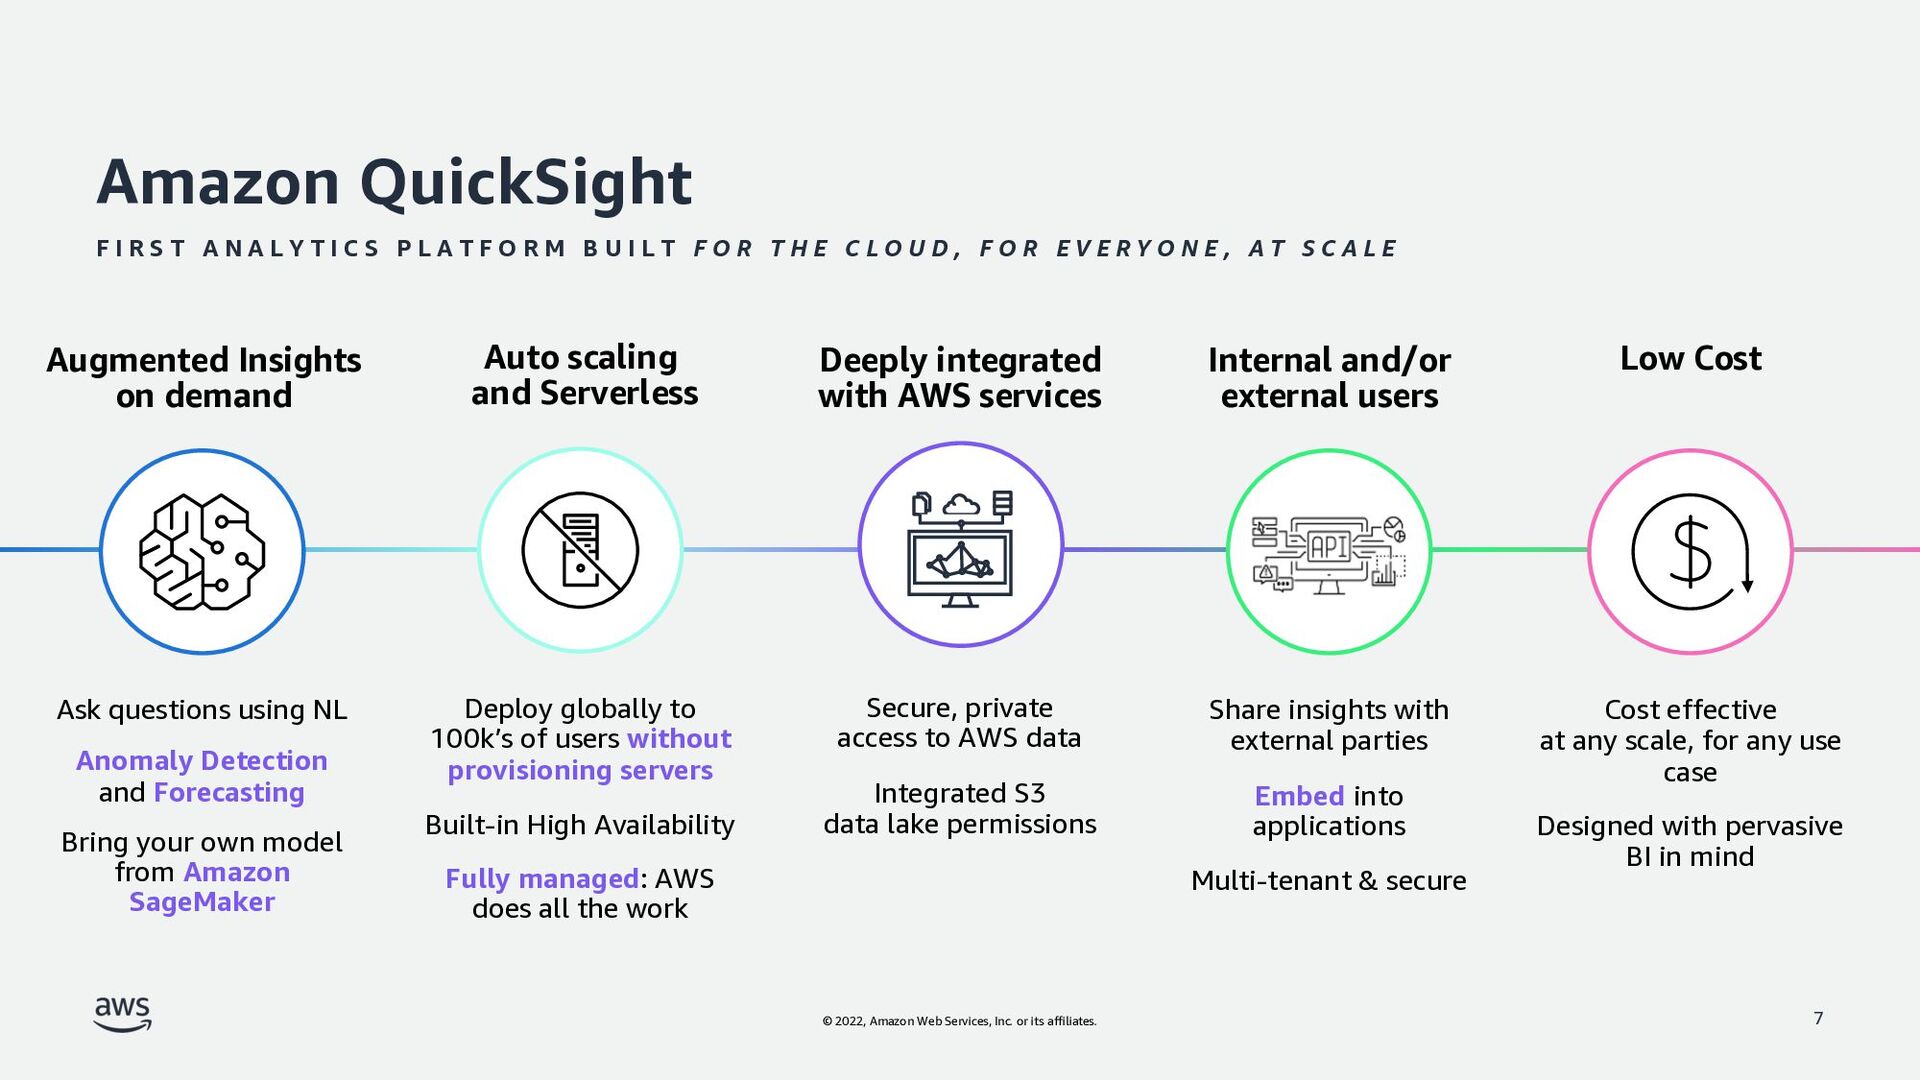
QuickSight F I R S T A N A L Y T I C S P L A T F O R M B U I L T F O R T H E C L O U D , F O R E V E R Y O N E , A T S C A L E 7 Auto scaling and Serverless Deploy globally to 100k’s of users without provisioning servers Built-in High Availability Fully managed: AWS does all the work Internal and/or external users Share insights with external parties Embed into applications Multi-tenant & secure Cost effective at any scale, for any use case Designed with pervasive BI in mind Low Cost Deeply integrated with AWS services Secure, private access to AWS data Integrated S3 data lake permissions Augmented Insights on demand Ask questions using NL Anomaly Detection and Forecasting Bring your own model from Amazon SageMaker
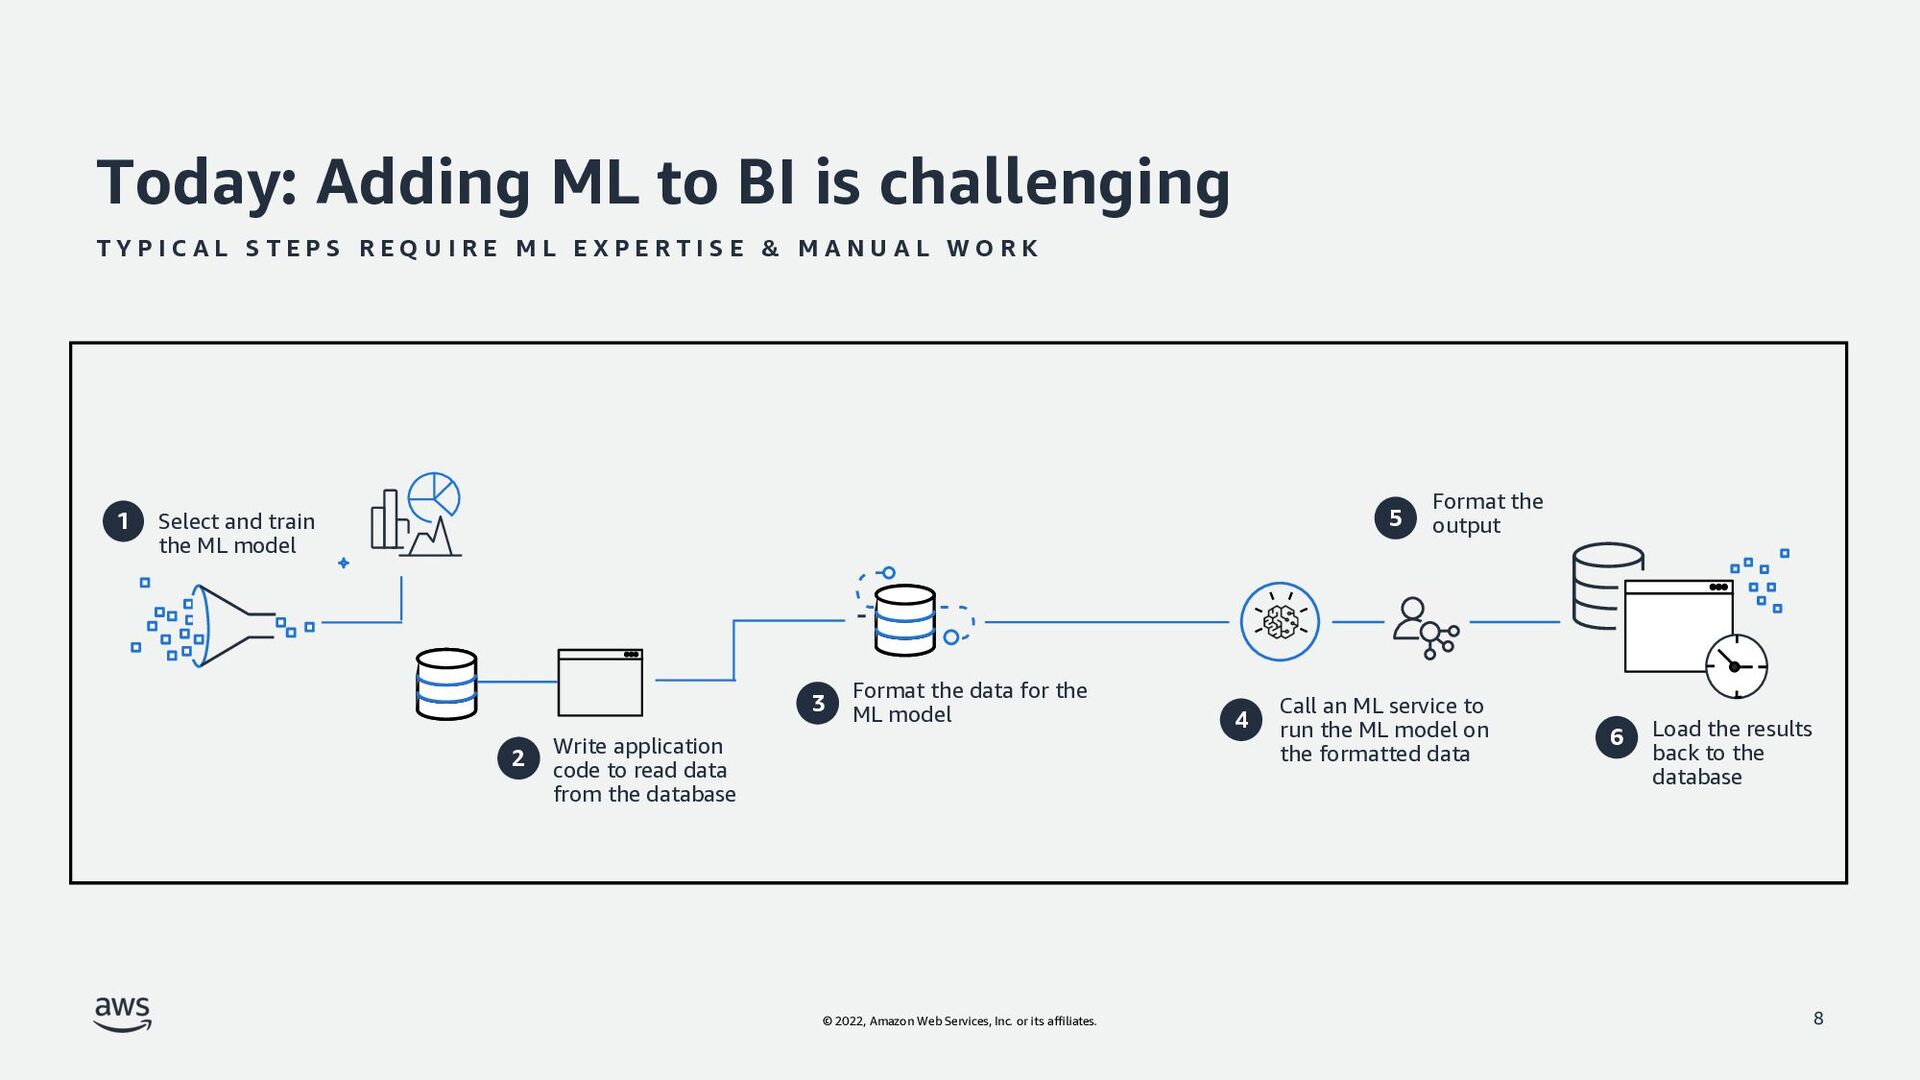
Adding ML to BI is challenging 8 Write application code to read data from the database 2 Format the data for the ML model 3 Call an ML service to run the ML model on the formatted data 4 Select and train the ML model 1 Format the output 5 Load the results back to the database 6 T Y P I C A L S T E P S R E Q U I R E M L E X P E R T I S E & M A N U A L W O R K
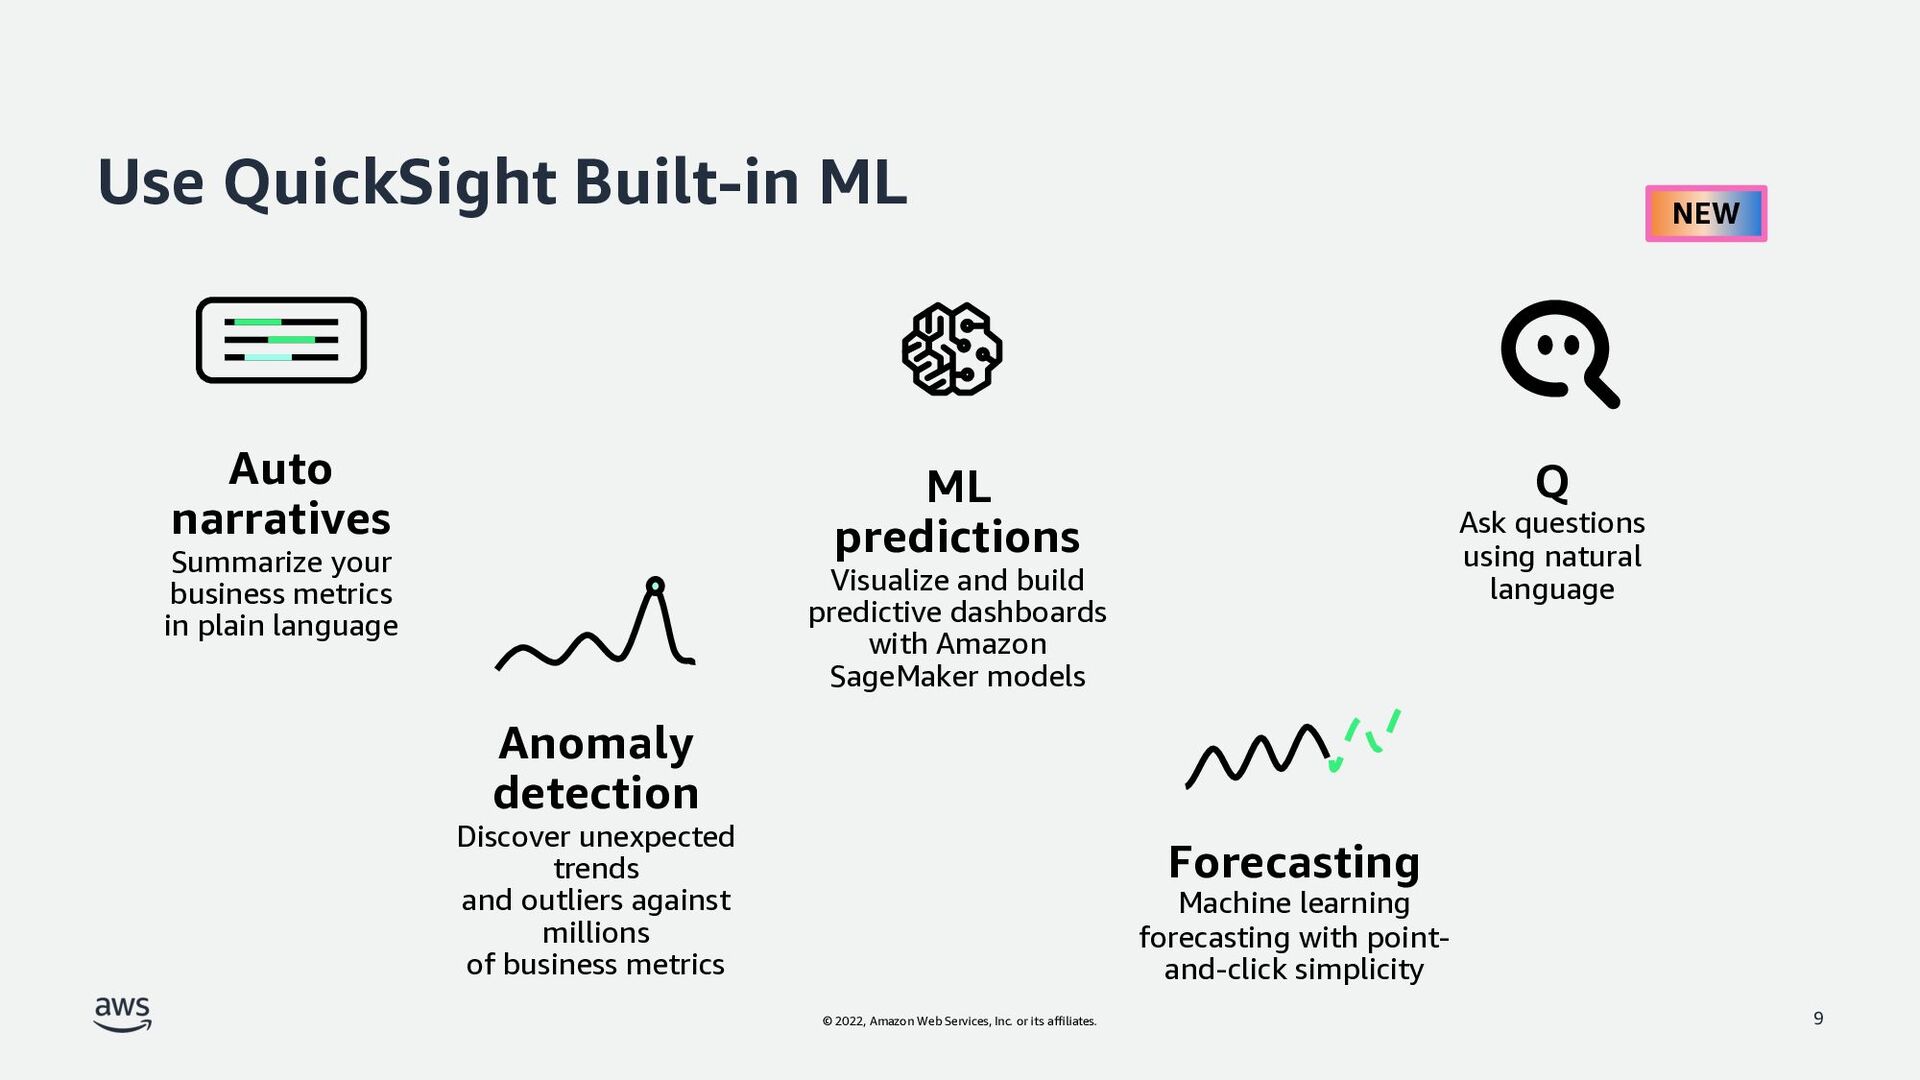
QuickSight Built-in ML 9 Anomaly detection Discover unexpected trends and outliers against millions of business metrics Auto narratives Summarize your business metrics in plain language Forecasting Machine learning forecasting with point- and-click simplicity ML predictions Visualize and build predictive dashboards with Amazon SageMaker models Q Ask questions using natural language NEW
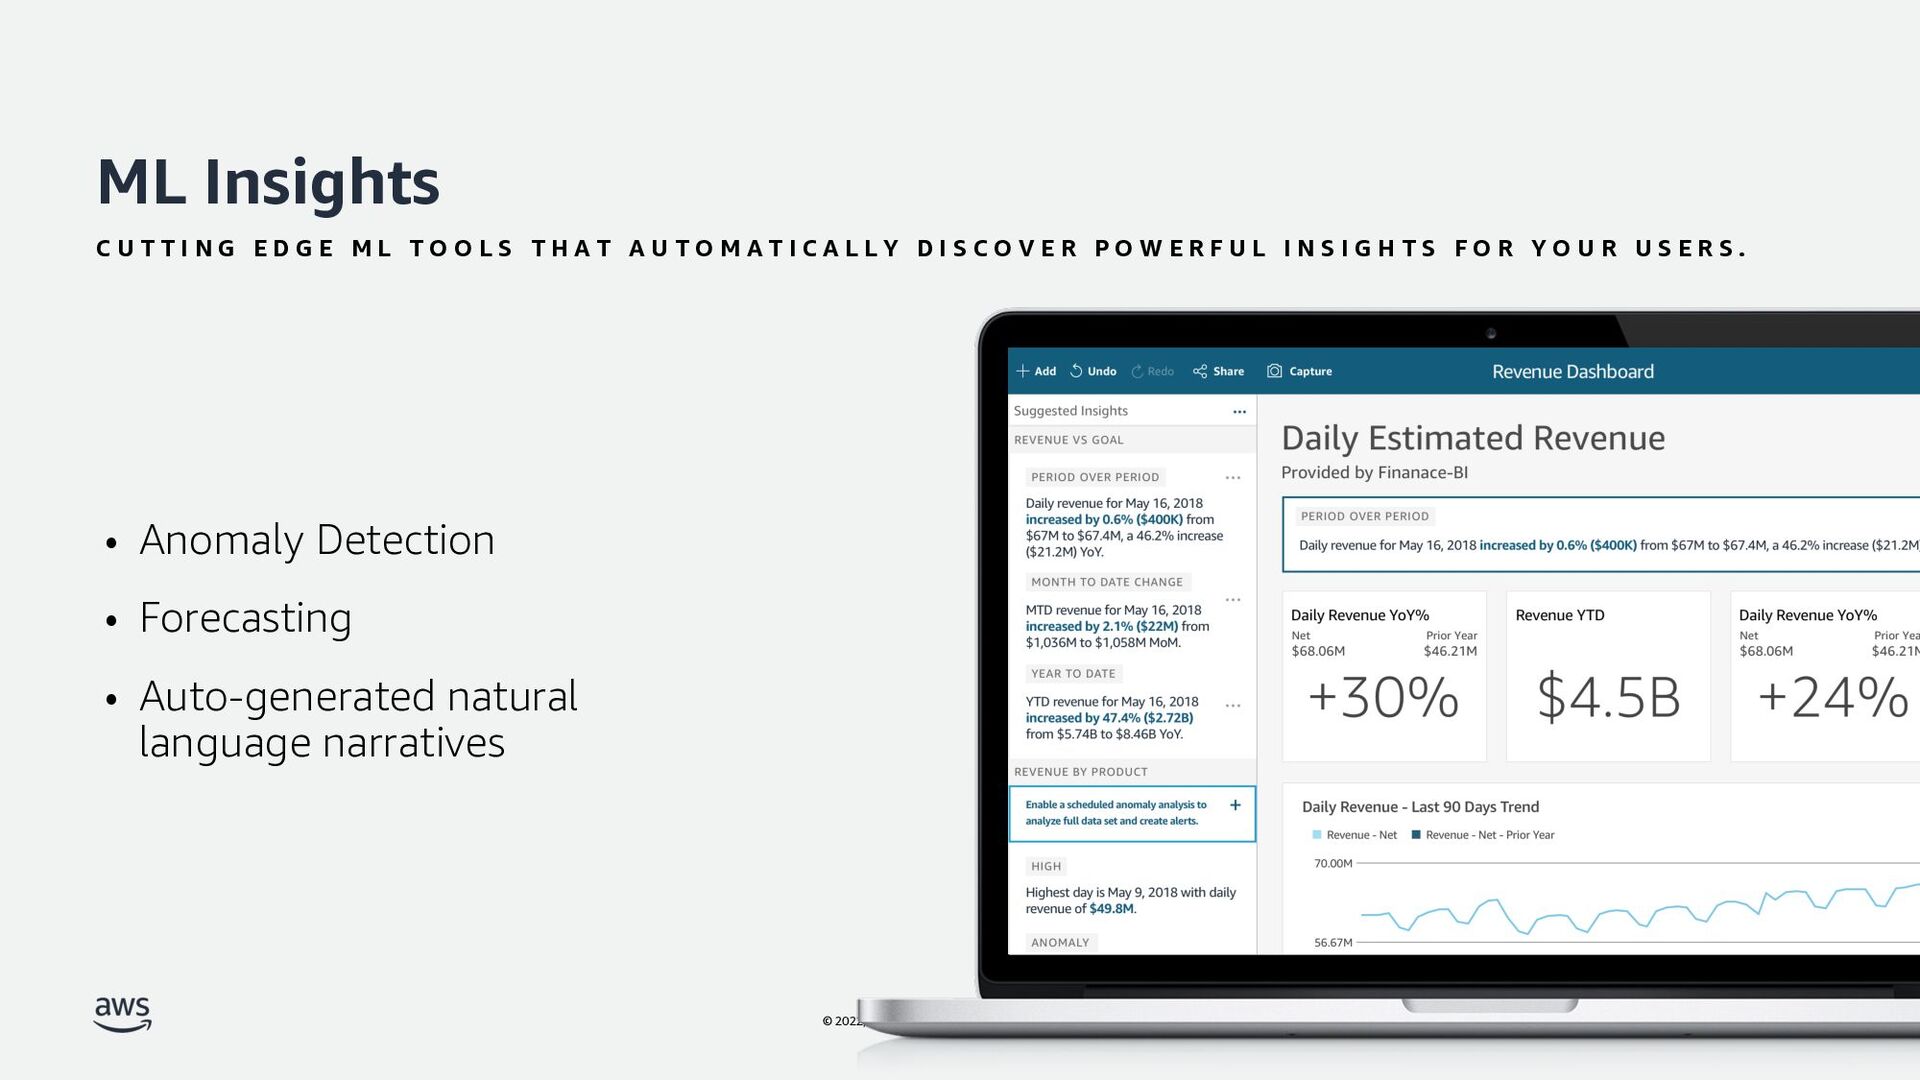
Insights C U T T I N G E D G E M L T O O L S T H A T A U T O M A T I C A L L Y D I S C O V E R P O W E R F U L I N S I G H T S F O R Y O U R U S E R S . 10 • Anomaly Detection • Forecasting • Auto-generated natural language narratives
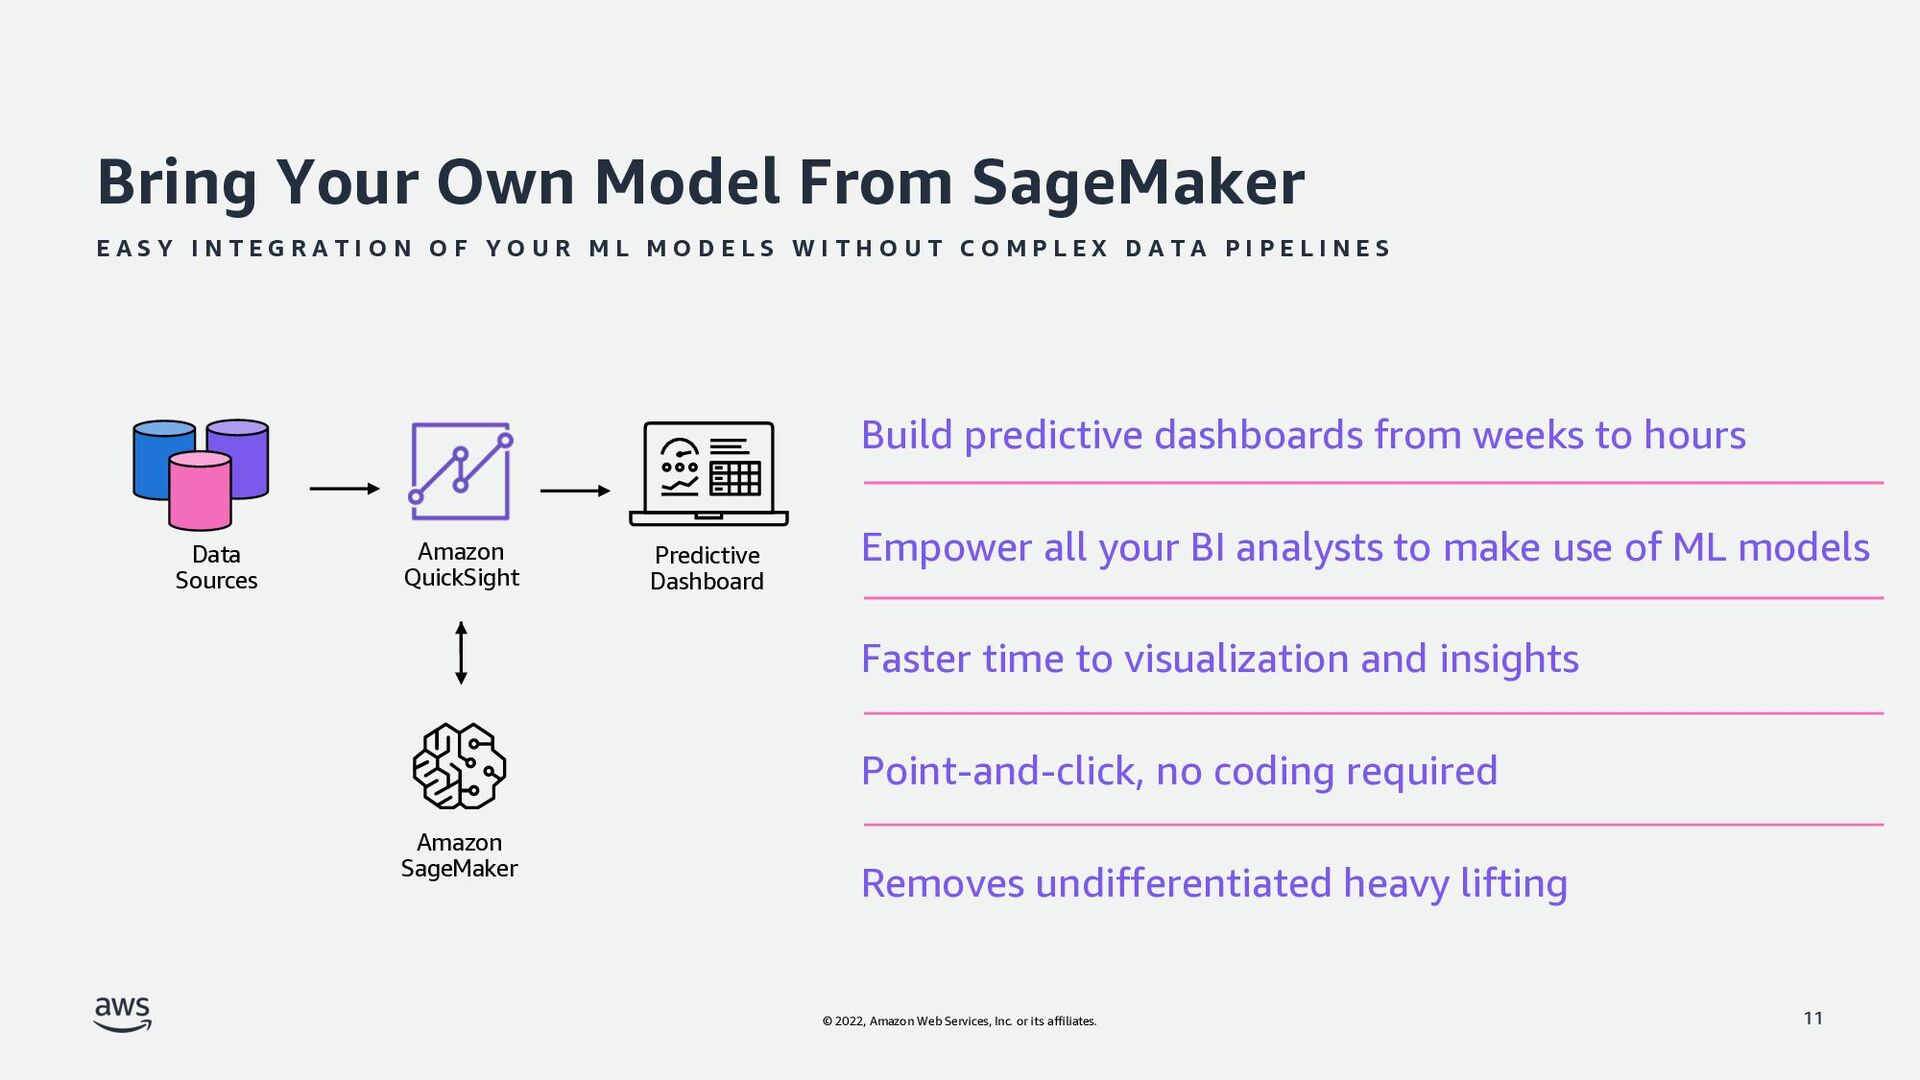
Your Own Model From SageMaker E A S Y I N T E G R A T I O N O F Y O U R M L M O D E L S W I T H O U T C O M P L E X D A T A P I P E L I N E S 11 Amazon SageMaker Amazon QuickSight Data Sources Predictive Dashboard Build predictive dashboards from weeks to hours Empower all your BI analysts to make use of ML models Faster time to visualization and insights Point-and-click, no coding required Removes undifferentiated heavy lifting
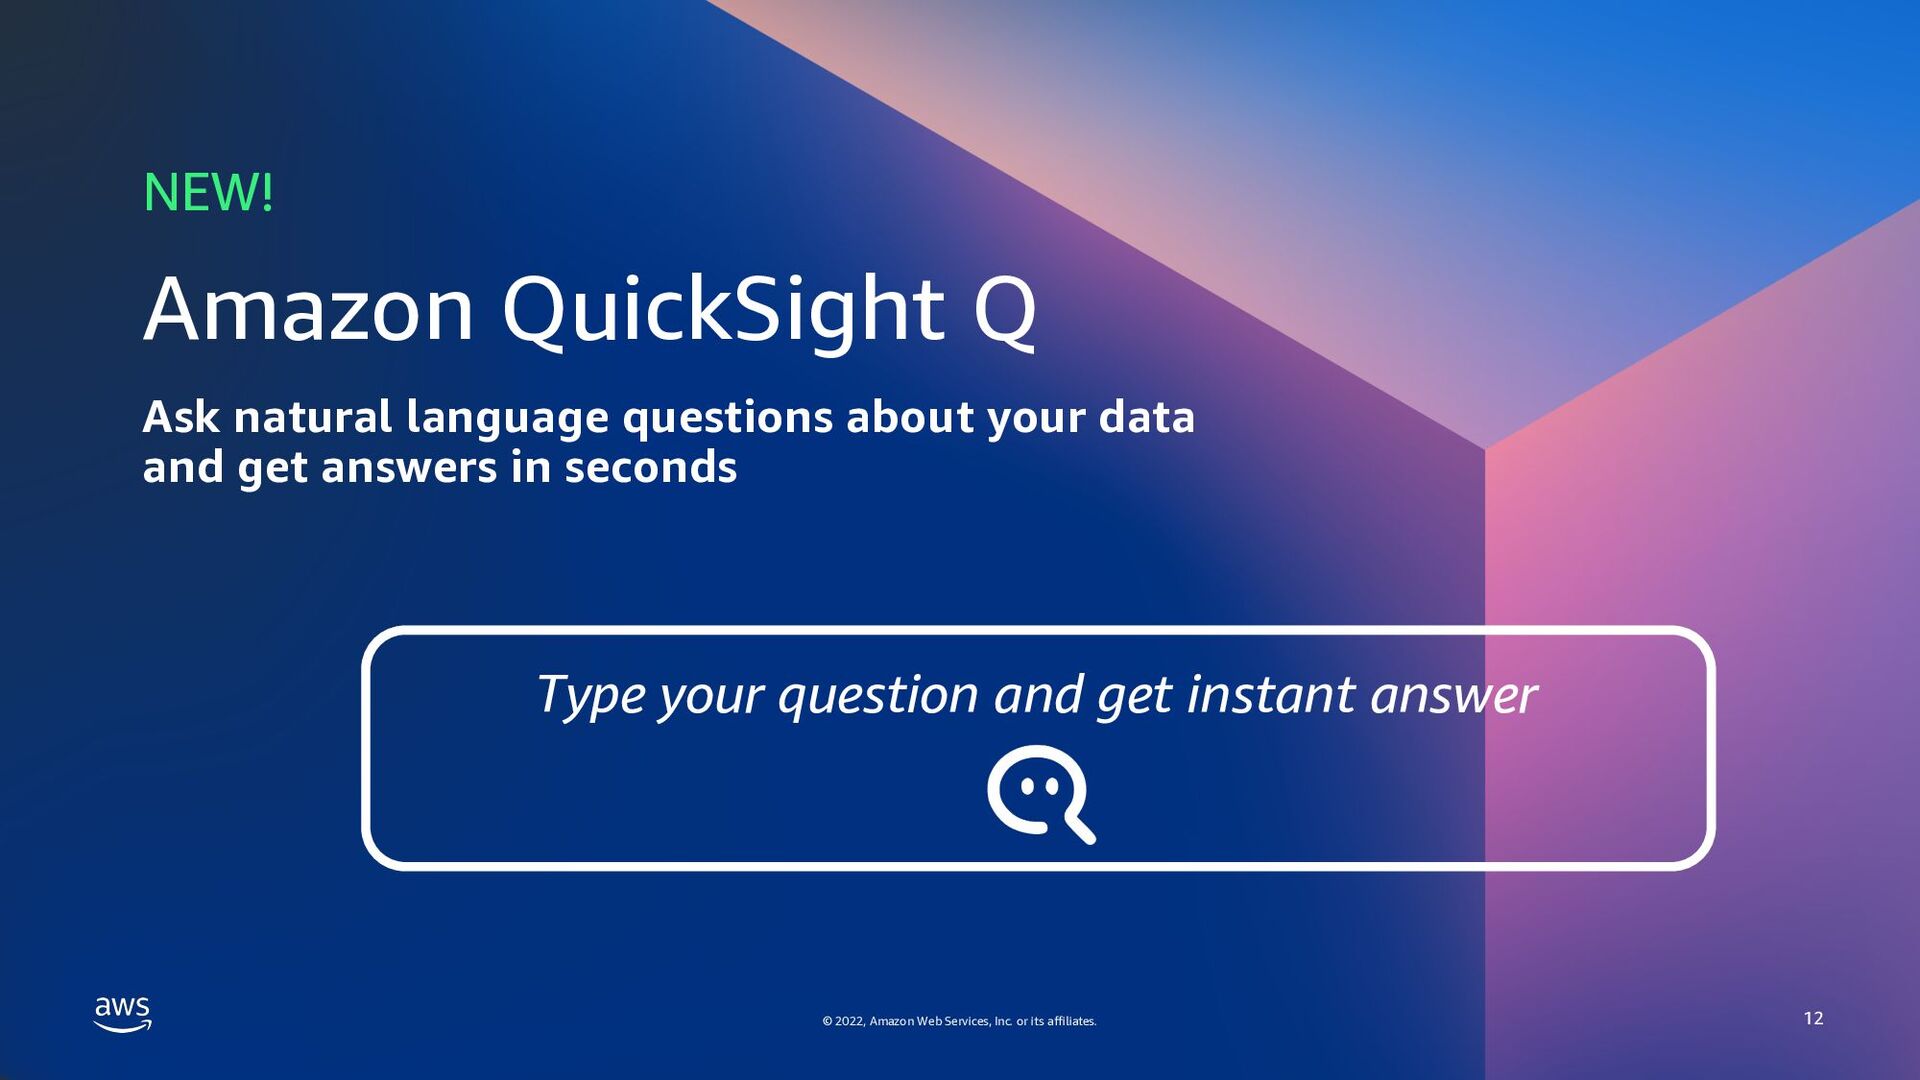
2022, Amazon Web Services, Inc. or its affiliates. 12 Ask natural language questions about your data and get answers in seconds Amazon QuickSight Q NEW! Type your question and get instant answer
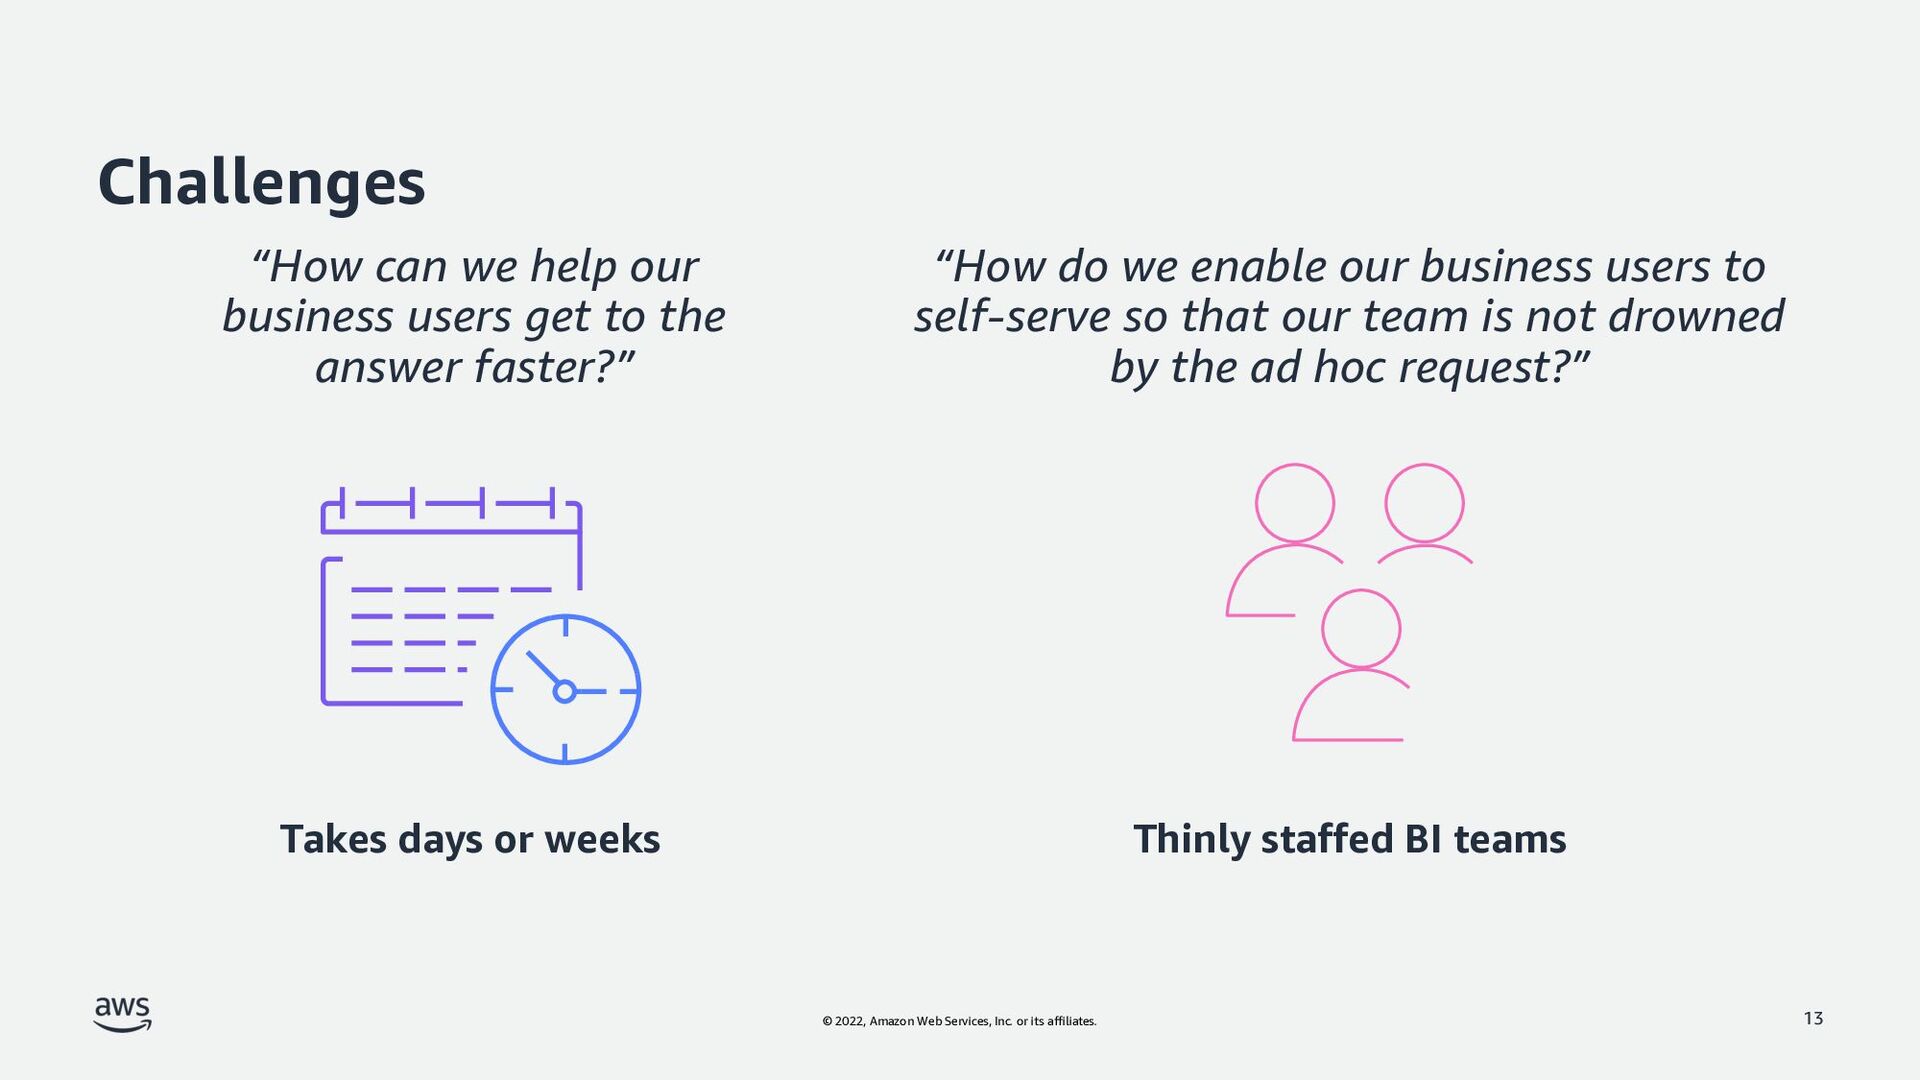
13 “How can we help our business users get to the answer faster?” “How do we enable our business users to self-serve so that our team is not drowned by the ad hoc request?” Takes days or weeks Thinly staffed BI teams
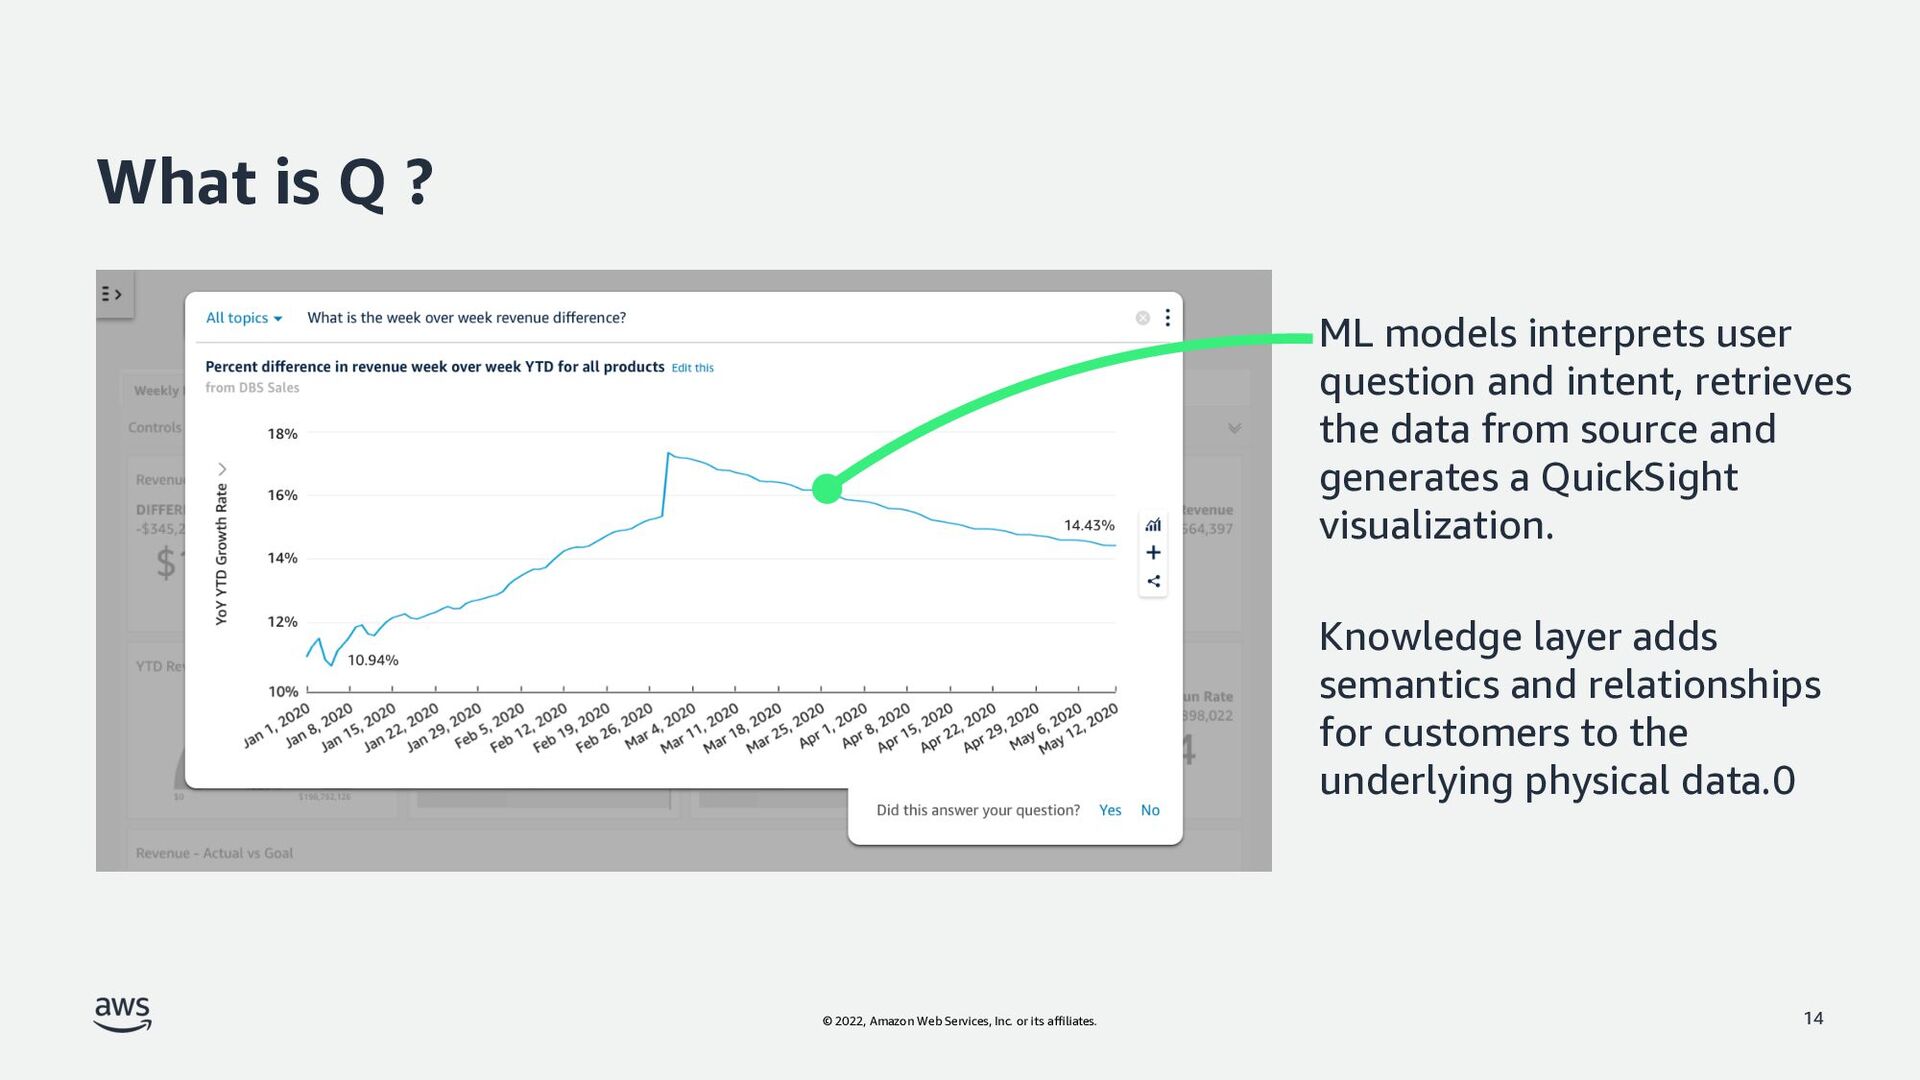
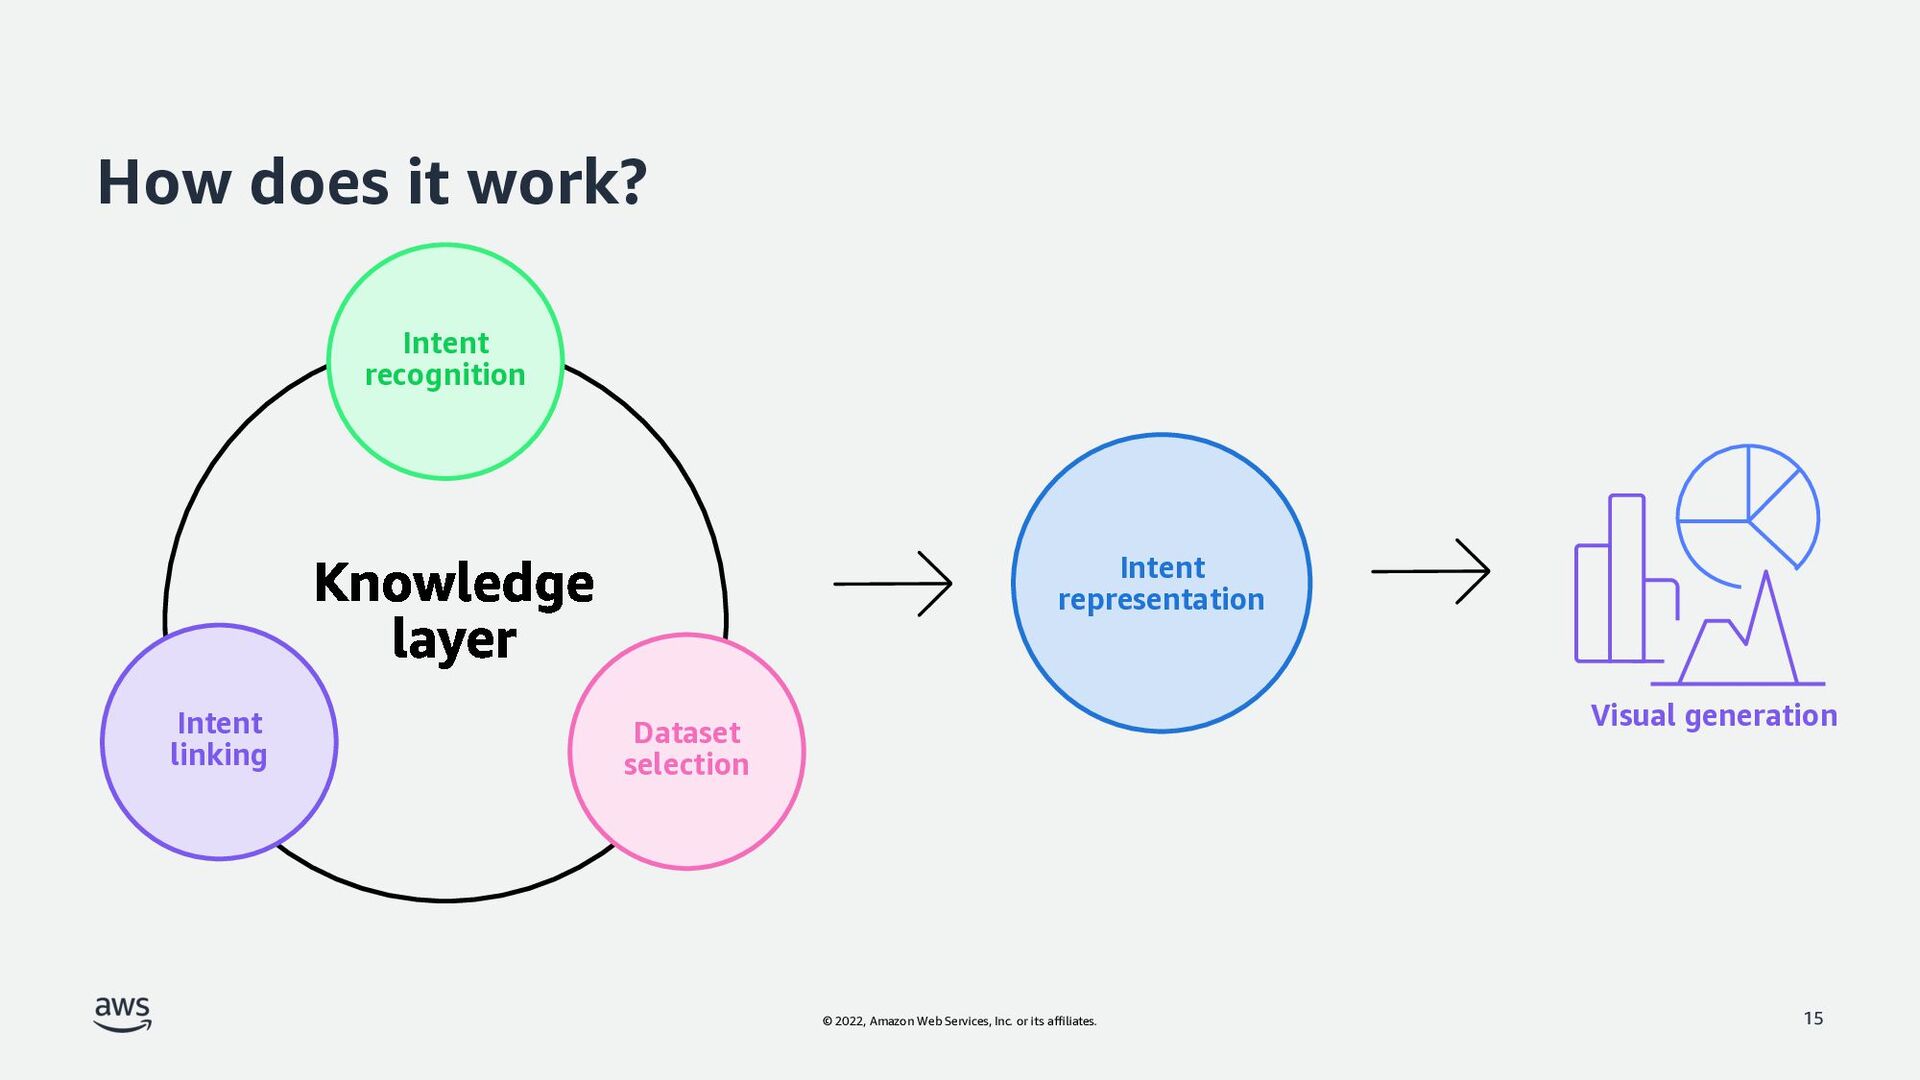
is Q ? 14 ML models interprets user question and intent, retrieves the data from source and generates a QuickSight visualization. Knowledge layer adds semantics and relationships for customers to the underlying physical data.0
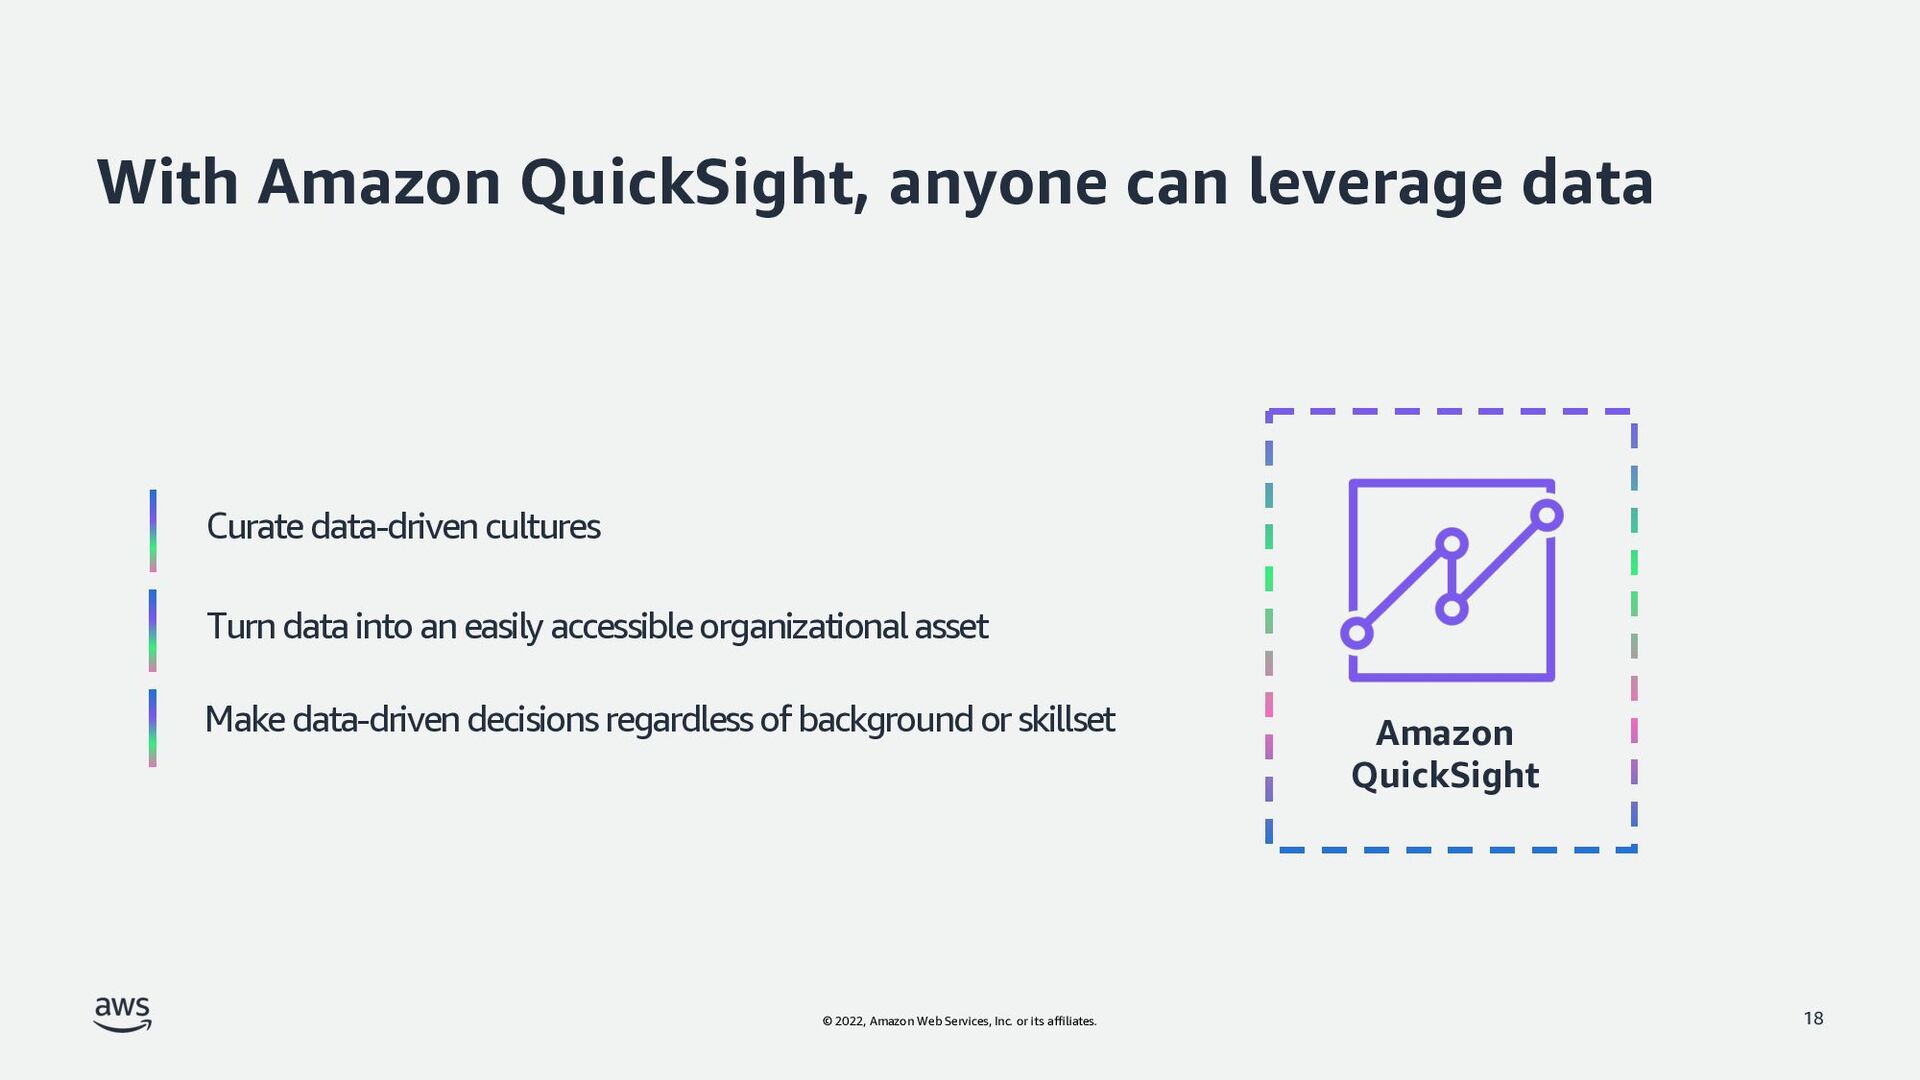
Amazon QuickSight, anyone can leverage data 18 Turn data into an easily accessible organizational asset Make data-driven decisions regardless of background or skillset Amazon QuickSight Curate data-driven cultures
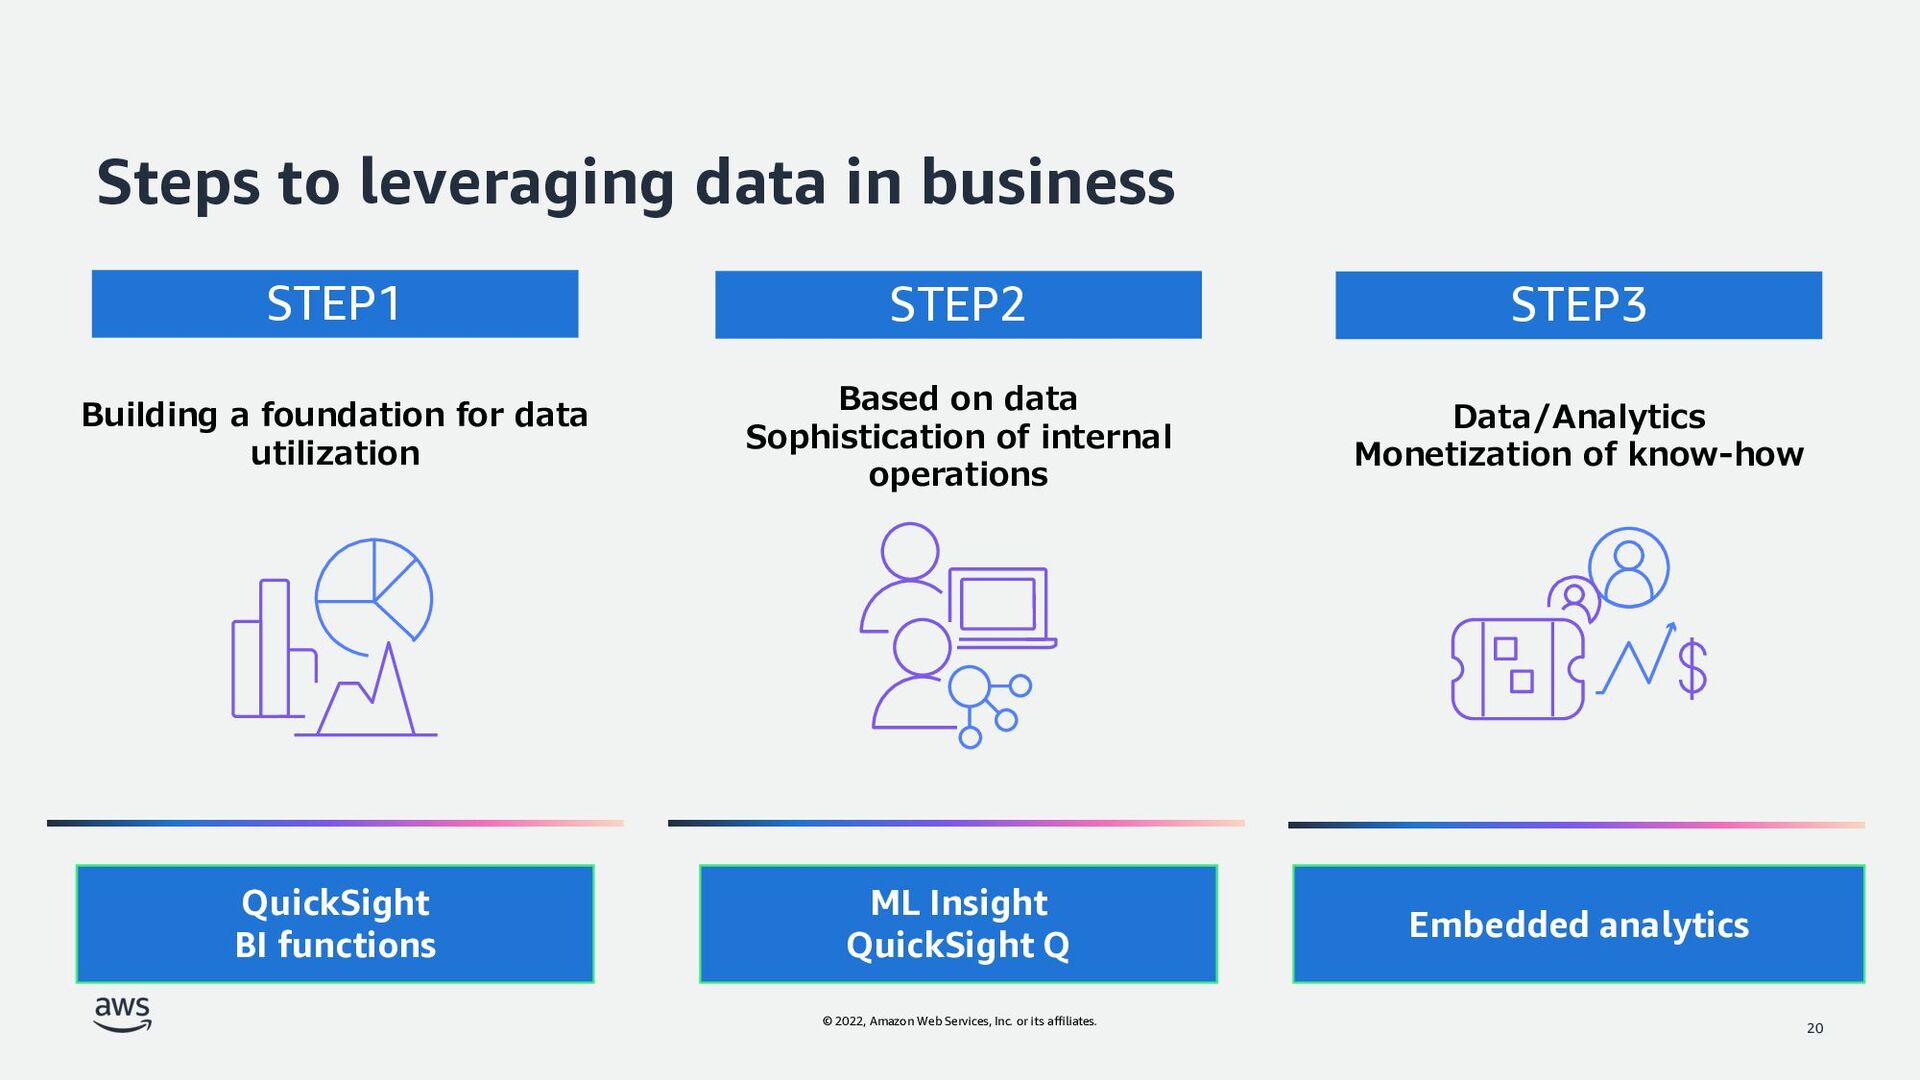
to leveraging data in business 20 QuickSight BI functions ML Insight QuickSight Q Embedded analytics Building a foundation for data utilization Based on data Sophistication of internal operations Data/Analytics Monetization of know-how STEP1 STEP2 STEP3