Upgrade to Pro — share decks privately, control downloads, hide ads and more …

Density-Based Clustering in Python

Avatar for Brian Kent Brian Kent
November 10, 2015

Density-Based Clustering in Python

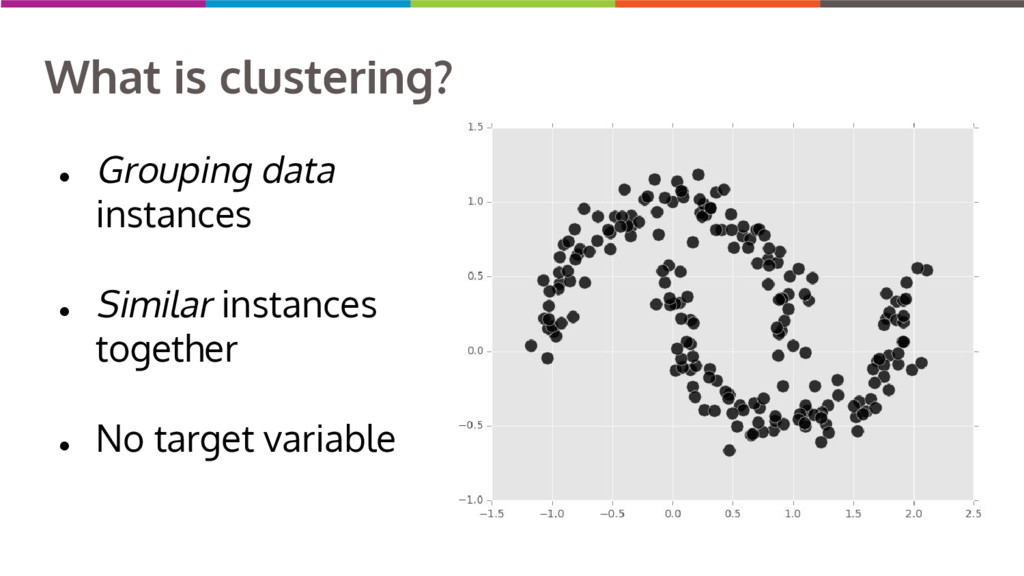
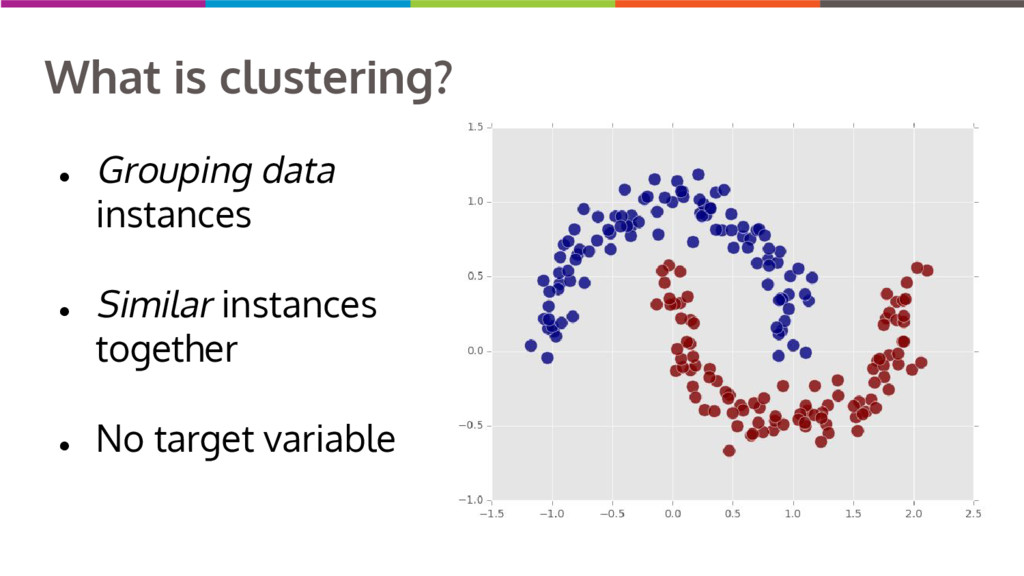
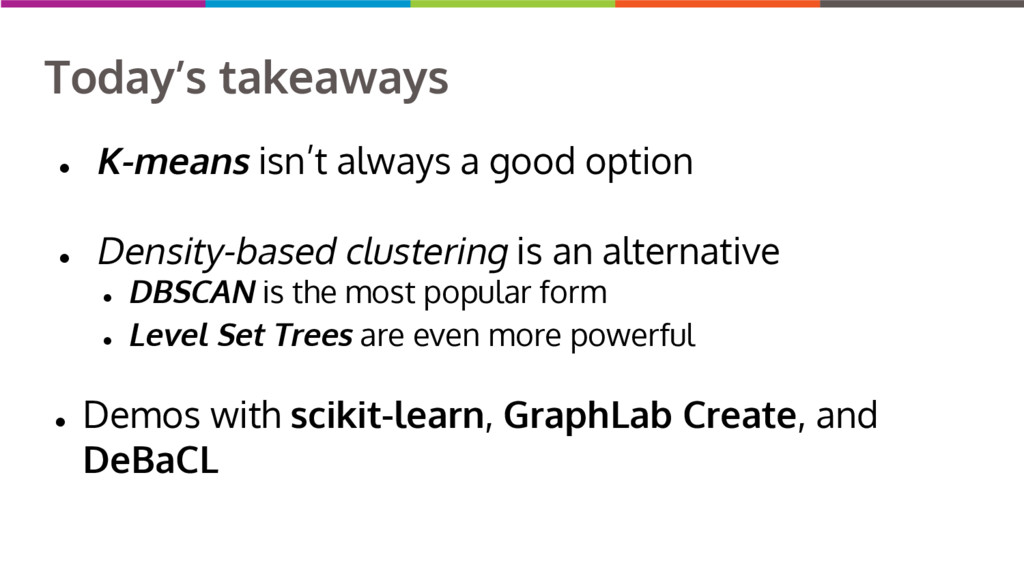
Clustering data into similar groups is a fundamental task in data science. Probability density-based clustering has several advantages over popular parametric methods like K-Means, but practical usage of density-based methods has lagged for computational reasons. I will discuss several ways to do density-based clustering in Python.

Avatar for Brian Kent

Brian Kent

November 10, 2015
Tweet

Other Decks in Technology

Transcript

  1. Why cluster? • Wikipedia: • “It is a main task

    of exploratory data mining, and a common technique for statistical data analysis” • ok, but why? • explore and visualize complex data • reduce data scale • detect outliers (and other anomalies) • deduplicate records • segment a market
  2. Today’s takeaways • K-means isn’t always a good option •

    Density-based clustering is an alternative • DBSCAN is the most popular form • Level Set Trees are even more powerful • Demos with scikit-learn, GraphLab Create, and DeBaCL
  3. K-means is the default • A very simple algorithm •

    Lots of resources • Lots of implementations • Scales to very large datasets • Especially with the Elkan and minibatch implementations
  4. K-means isn’t the only answer • How to choose K?

    • Sometimes choosing K is impossible. • Spherical, convex clusters only.
  5. Enter density-based clustering • Premise: data is drawn from a

    probability density function (PDF). • Use the data to estimate the PDF.
  6. Enter density-based clustering • Choose a threshold and get the

    upper level set. • Find connected components of the upper level set.
  7. Enter density-based clustering • Intersect the data with the connected

    components. • Assign points to the corresponding cluster.
  8. Pros and cons • Recovers more complex cluster shapes. •

    Don’t need to know K. • Automatically find outliers. • Requires a distance function. • Not as scalable as K-means. • ... • It’s impossible. • Can’t compute topologically connected components.
  9. DBSCAN leads the pack • Density-Based Spatial Clustering of Applications

    with Noise (Ester, et al. 1996) • Test of Time award at KDD 2014. • 7,400 citations on Google Scholar. • Main idea: • three types of points: core, boundary, noise • connect core points into clusters • assign boundary points to clusters
  10. DBSCAN in GraphLab Create • Built on scalable SFrame and

    SGraph data structures. • Composite distances for varied feature types. • Construct a similarity graph directly. • Permits a more efficient algorithm. • Not open source, but free for non-commercial use.
  11. Level Set Trees are better than DBSCAN • How to

    choose the density level (i.e.min_neighbors)? • Changing levels means starting from scratch. • Level Set Trees (LSTs) describe the entire hierarchy of density-based clusters. • Retrieve clusters in different ways without re-computing • Each cluster can have a different density level • Visualization of high-dim or complex data structure
  12. Building a level set tree • Estimate the PDF at

    each data point. • Construct a similarity graph on the data. • Vertices are data points. • Edges represent near neighbors. • Remove vertices in order of estimated density. • Compute the connected components at each level. • Keep track of components between levels.
  13. DeBaCl builds level set trees • DeBaCl: DEnsity-BAsed CLustering •

    pip install debacl • https://github.com/coaxlab/debacl • Help wanted!
  14. Wrap-up • K-means isn’t always the best option. • Density-based

    clustering can be a good alternative. • DBSCAN is the most popular form. • Scikit-learn, GraphLab Create • Level set trees are even more powerful. • DeBaCL • Help on DeBaCl is very welcome!