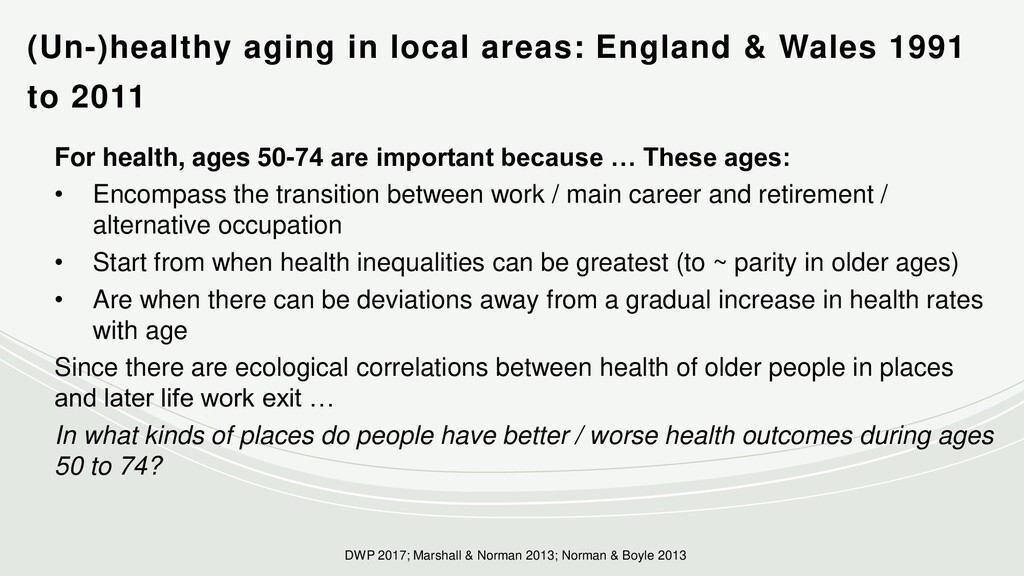
For health, ages 50-74 are important because these ages: a) Encompass the transition between work / main career and retirement / alternative occupation; b) Start from when health inequalities can be greatest (to ~ parity in older ages) and; c) Are when there can be deviations away from a gradual increase in health rates with age
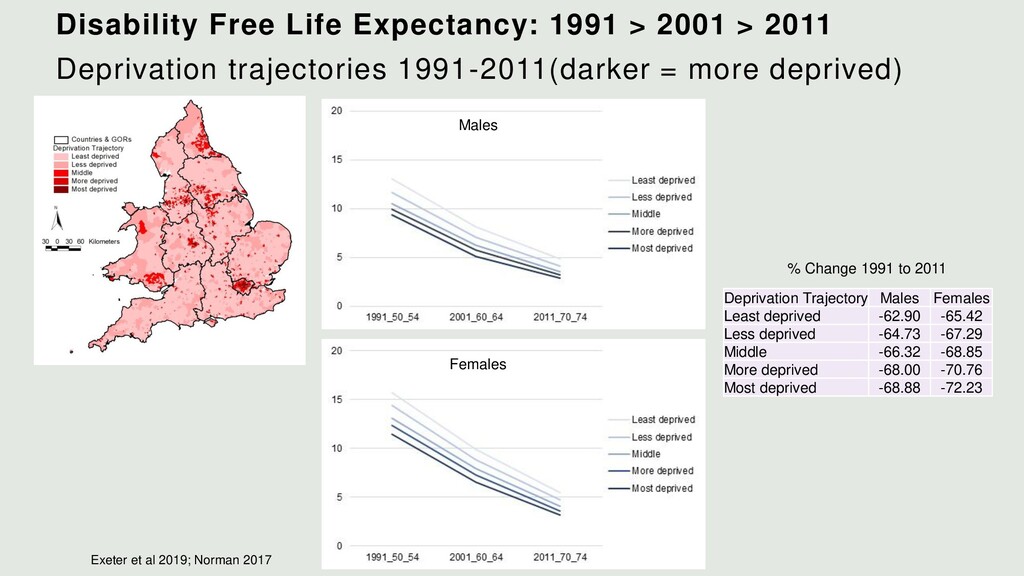
Since there are ecological correlations between health of older people in places and later life work exit, we explore, What kinds of places do people have better / worse health outcomes during ages 50 to 74?
![Contact: [email protected] @emilytmurray](https://files.speakerdeck.com/presentations/66345f278b2441b78bdfcbcc5e91faed/slide_9.jpg)