School of Geography, University of Leeds LS Acknowledgements: • ONS LS Team • Centre for Longitudinal Study, University of London • London School of Hygiene & Tropical Medicine • CeLSIUS team at UCL • Jemima Stockton & Aly Sizer Area Data Acknowledgements: • ONS re Census & Vital Statistics • UK Data Archive / Service • MIMAS / Casweb, Manchester Funding Acknowledgements: • ESRC for the support units • ESRC PhDs, PN & FDP • Health Foundation • & other co-authors’ funding
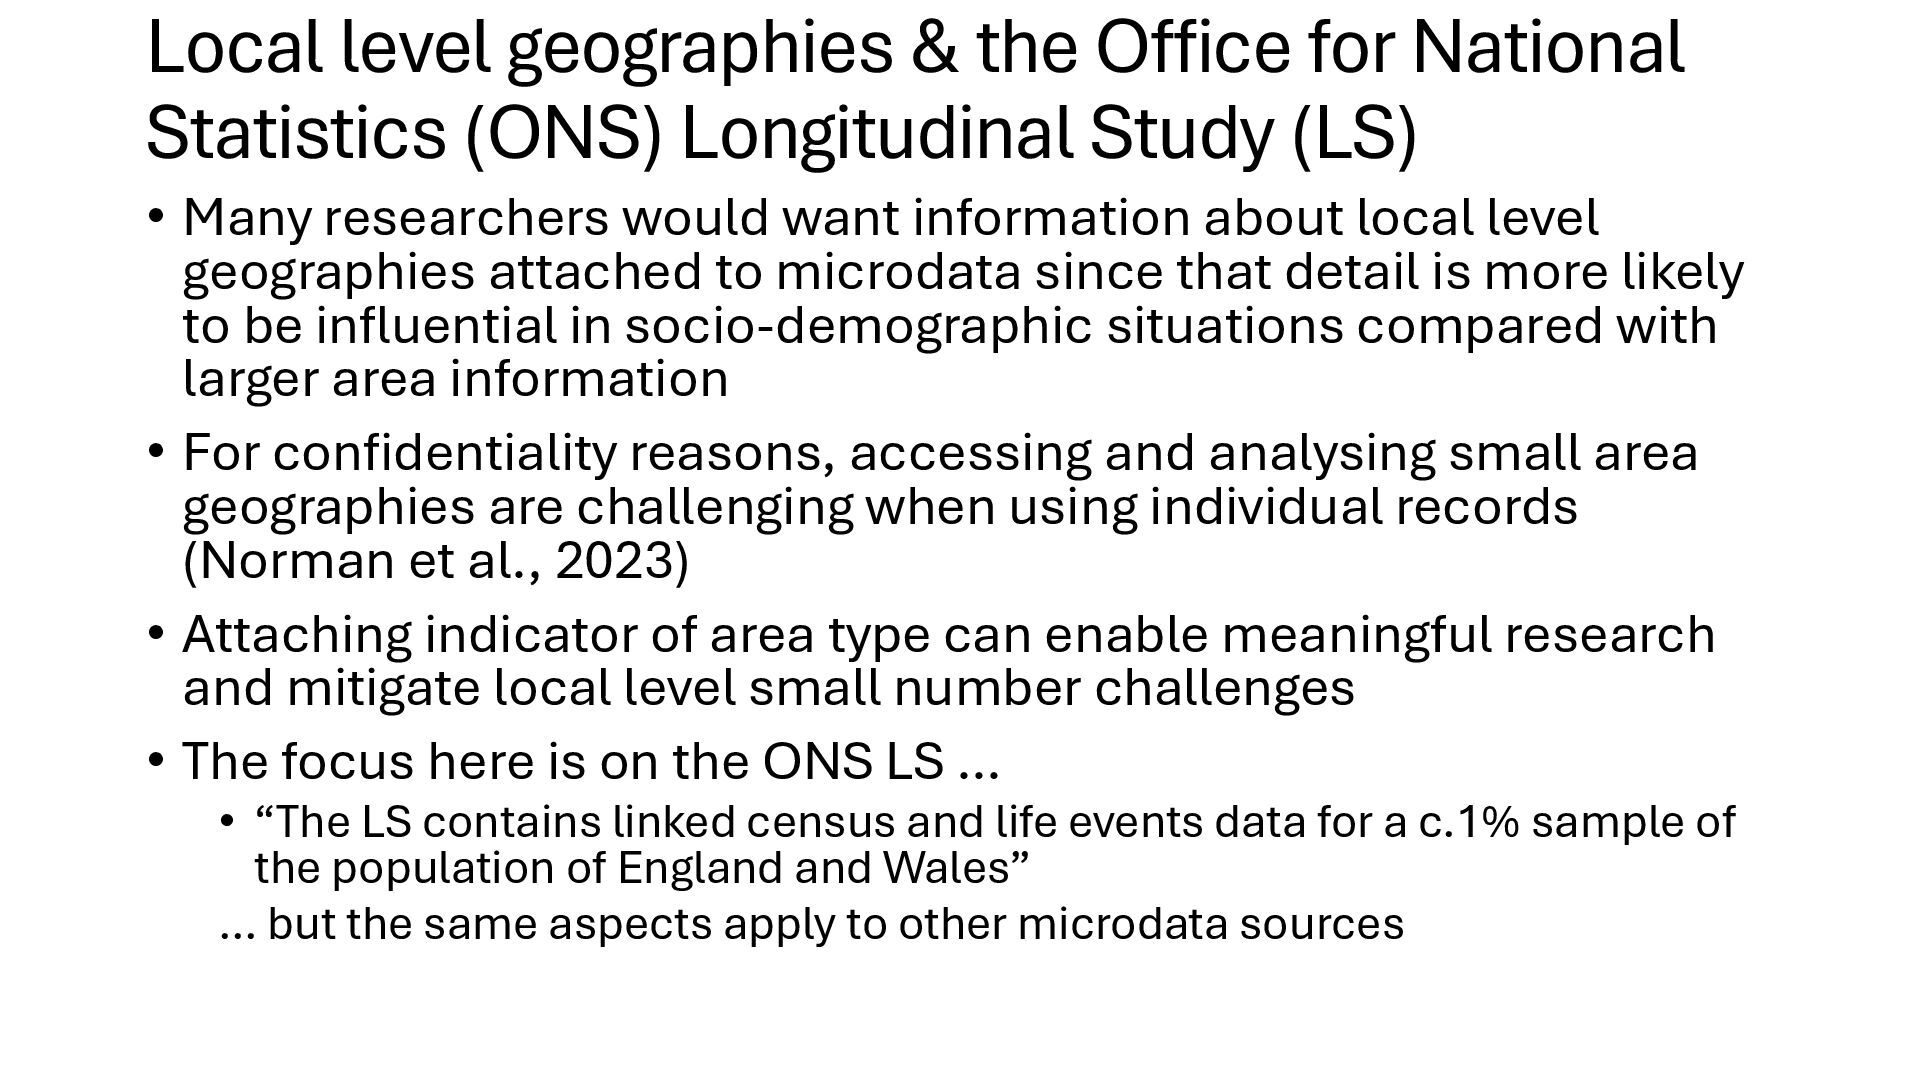
Longitudinal Study (LS) • Many researchers would want information about local level geographies attached to microdata since that detail is more likely to be influential in socio-demographic situations compared with larger area information • For confidentiality reasons, accessing and analysing small area geographies are challenging when using individual records (Norman et al., 2023) • Attaching indicator of area type can enable meaningful research and mitigate local level small number challenges • The focus here is on the ONS LS … • “The LS contains linked census and life events data for a c.1% sample of the population of England and Wales” … but the same aspects apply to other microdata sources
available for analysis, support people can utilise ‘small area’ alphanumeric codes on LS records • e.g. 1971 ward, 1981, 1991 ED, 2001, 2011, 2021 OA • Area data supplied with that code can be joined & used in analyses = a fair representation of where someone lives (Norman & Riva, 2012) • The area characteristics can be used but not the specific place Distance over 10 years to 1981 ED Centroid Create a link Attach area data N.B. Y, N,? need discussion!!!
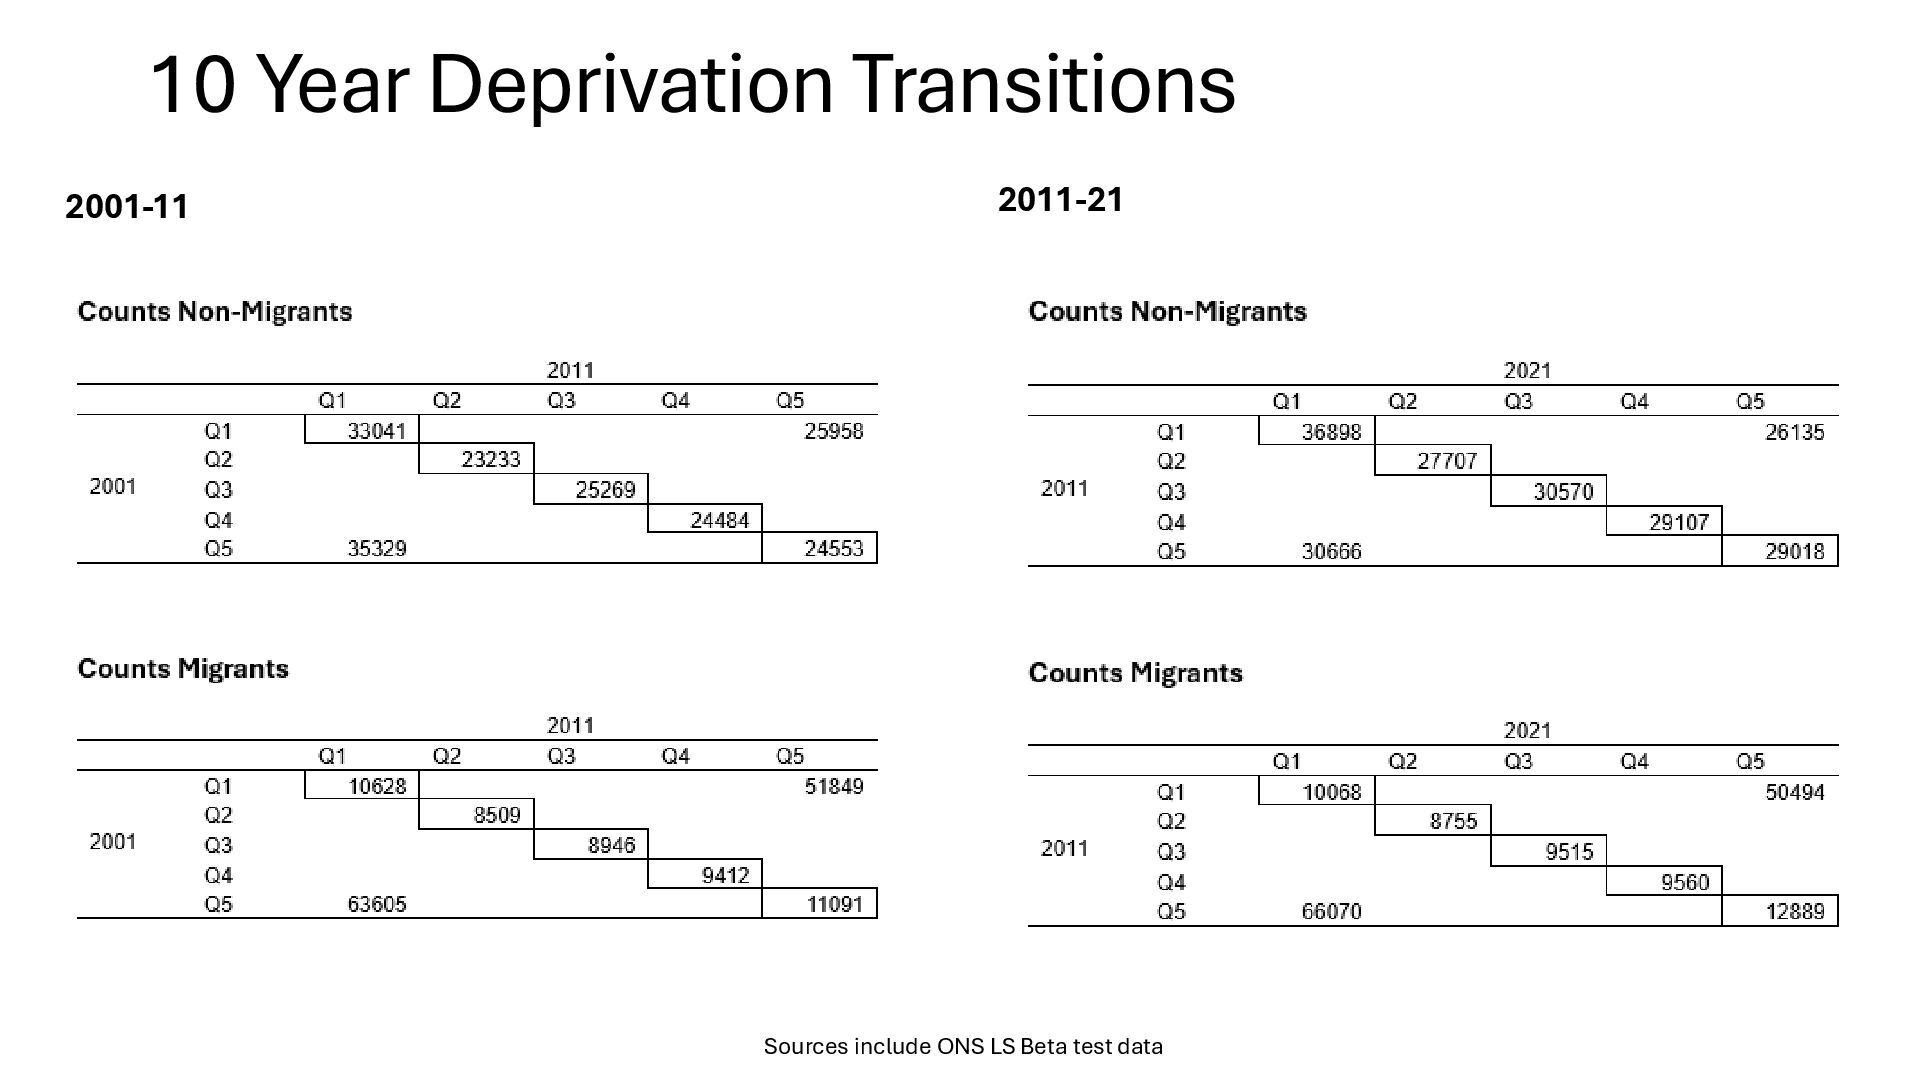
aggregated by geographic area type at different time points • Area measures are calculated for those time points • Any change in measures due to changes in individuals’ attributes & / or peoples’ locations • Counterfactual: Put people back to where they were living previously • What difference does (sub-national) migration make to any change in measure? • To achieve this: • Attach area deprivation measure comparable over time at successive censuses to link deprivation quintile to LS member area of residence • Household Residents, Age, Whether Migrant since previous Census, Self-Reported Health (at end, healthy at start) (Darlington-Pollock & Norman, 2022; Norman, 2018)
(Norman et al., 2005) Standardised Illness Ratios in 1991 Sources include ONS LS data Deprivation Transition Matrix Sources include ONS LS data (= Sum of Green Cells) (= Sum of Red Cells)
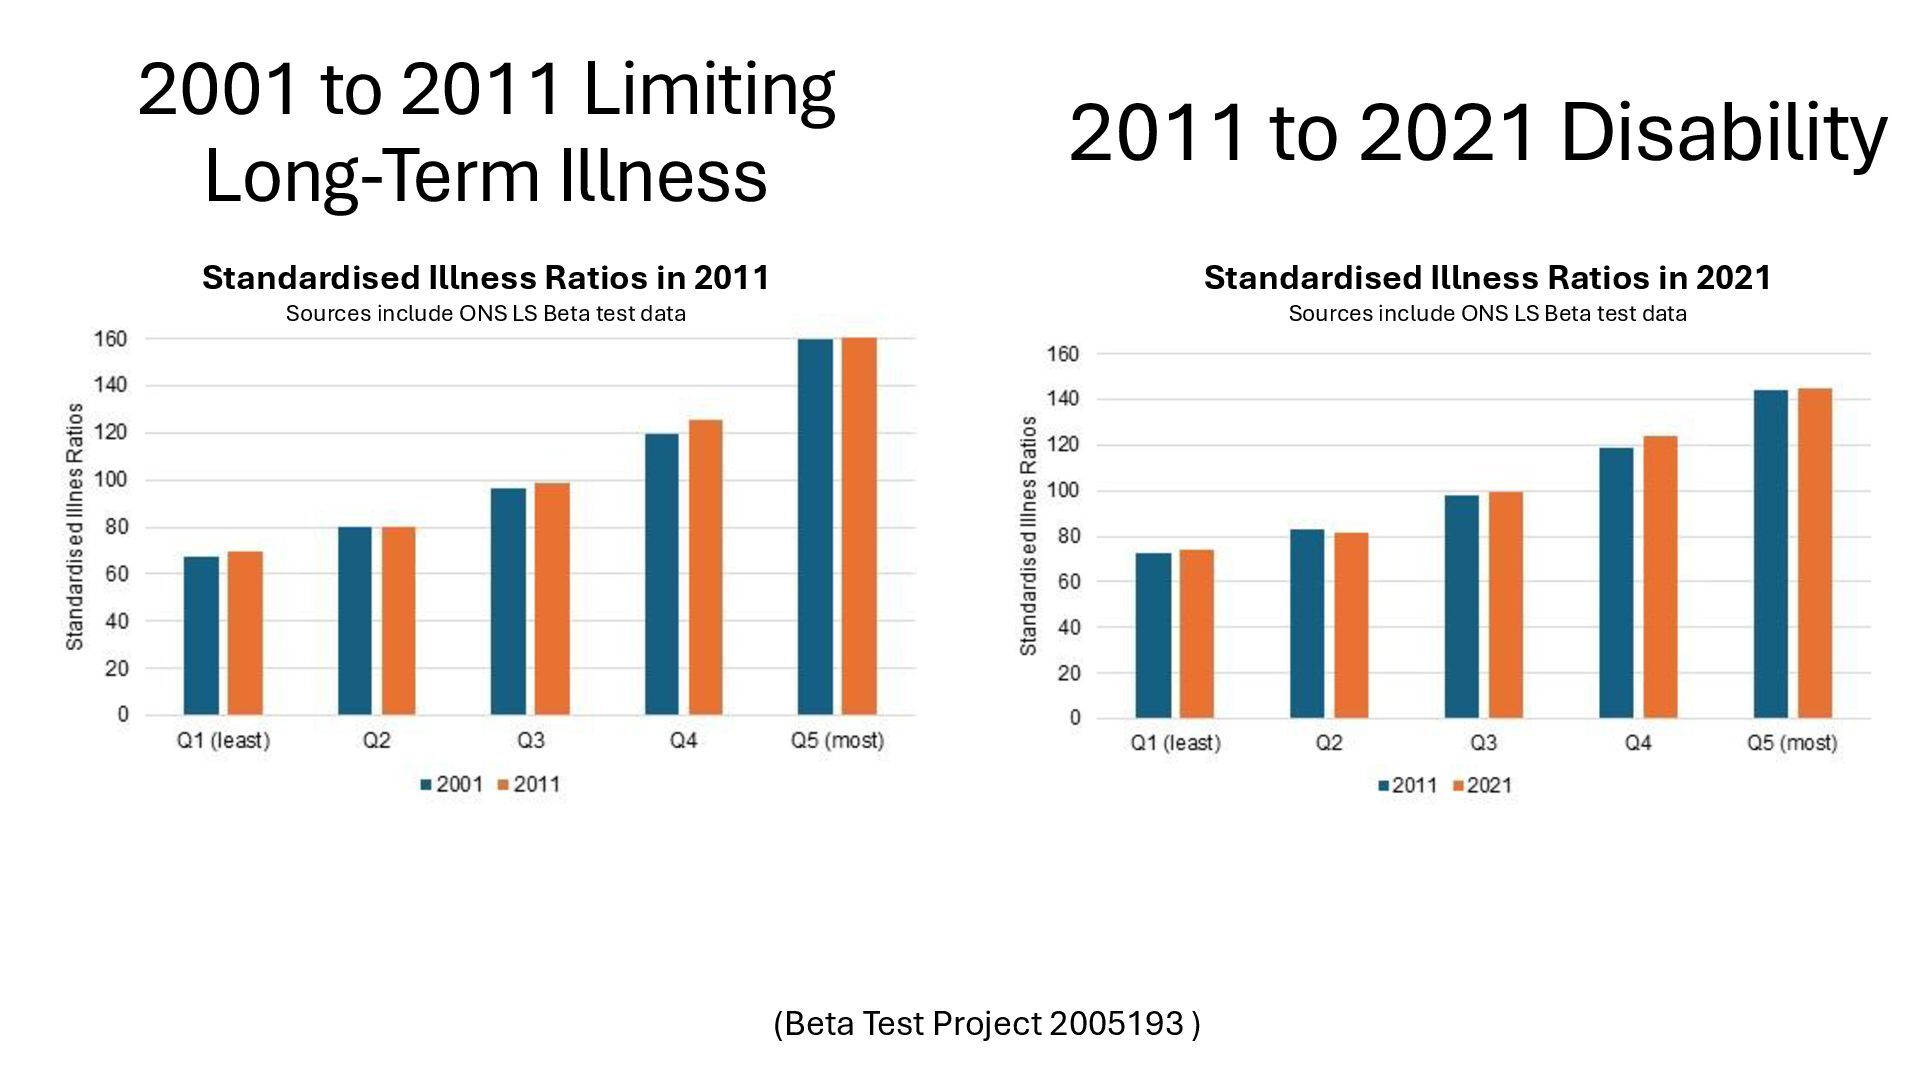
) Standardised Illness Ratios in 2011 Sources include ONS LS Beta test data Standardised Illness Ratios in 2021 Sources include ONS LS Beta test data 2011 to 2021 Disability
relation to deprivation: all time points • Migrants within least deprived areas have health advantage & within most deprived areas have health disadvantage: all time points Inconsistencies • Upwardly deprivation mobile 1971-91 better health than vice versa • Not the case in 2001-11 and 2011-21
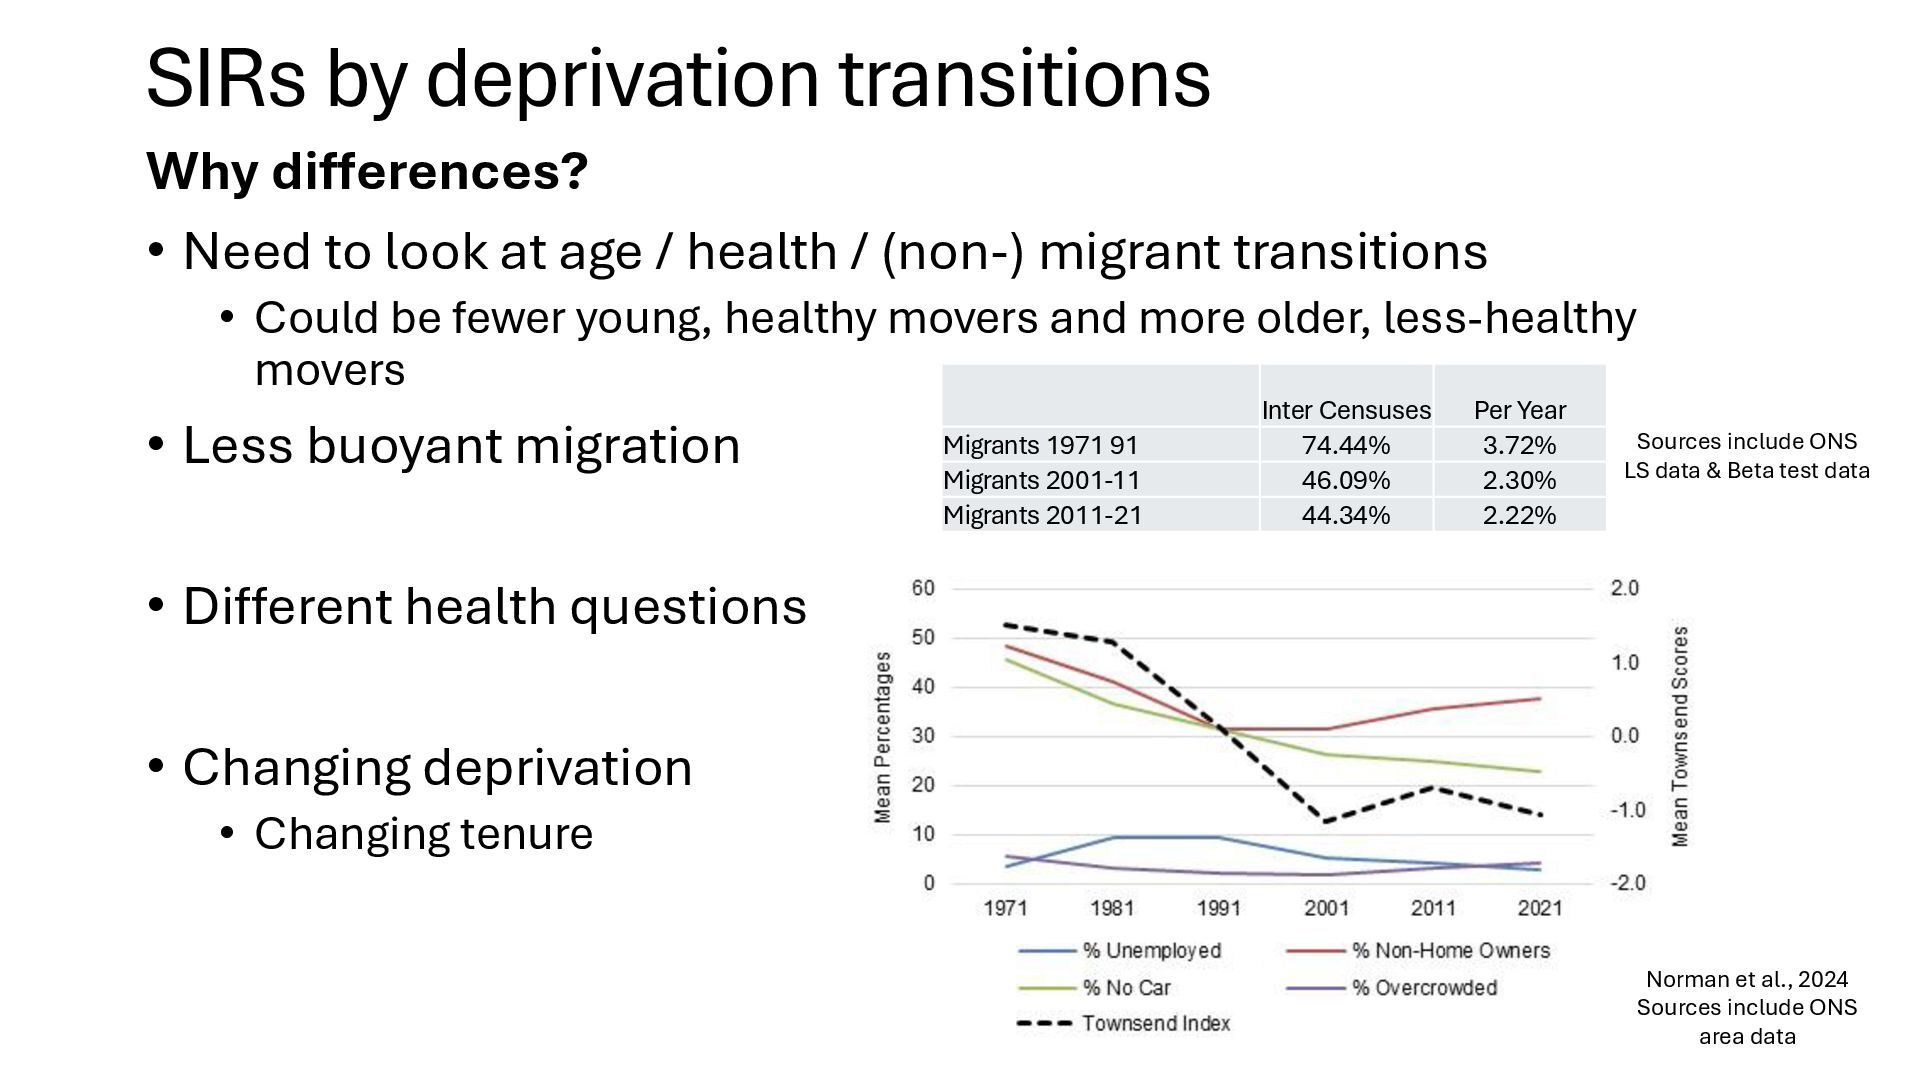
at age / health / (non-) migrant transitions • Could be fewer young, healthy movers and more older, less-healthy movers • Less buoyant migration • Different health questions • Changing deprivation • Changing tenure Inter Censuses Per Year Migrants 1971 91 74.44% 3.72% Migrants 2001-11 46.09% 2.30% Migrants 2011-21 44.34% 2.22% Sources include ONS LS data & Beta test data Norman et al., 2024 Sources include ONS area data
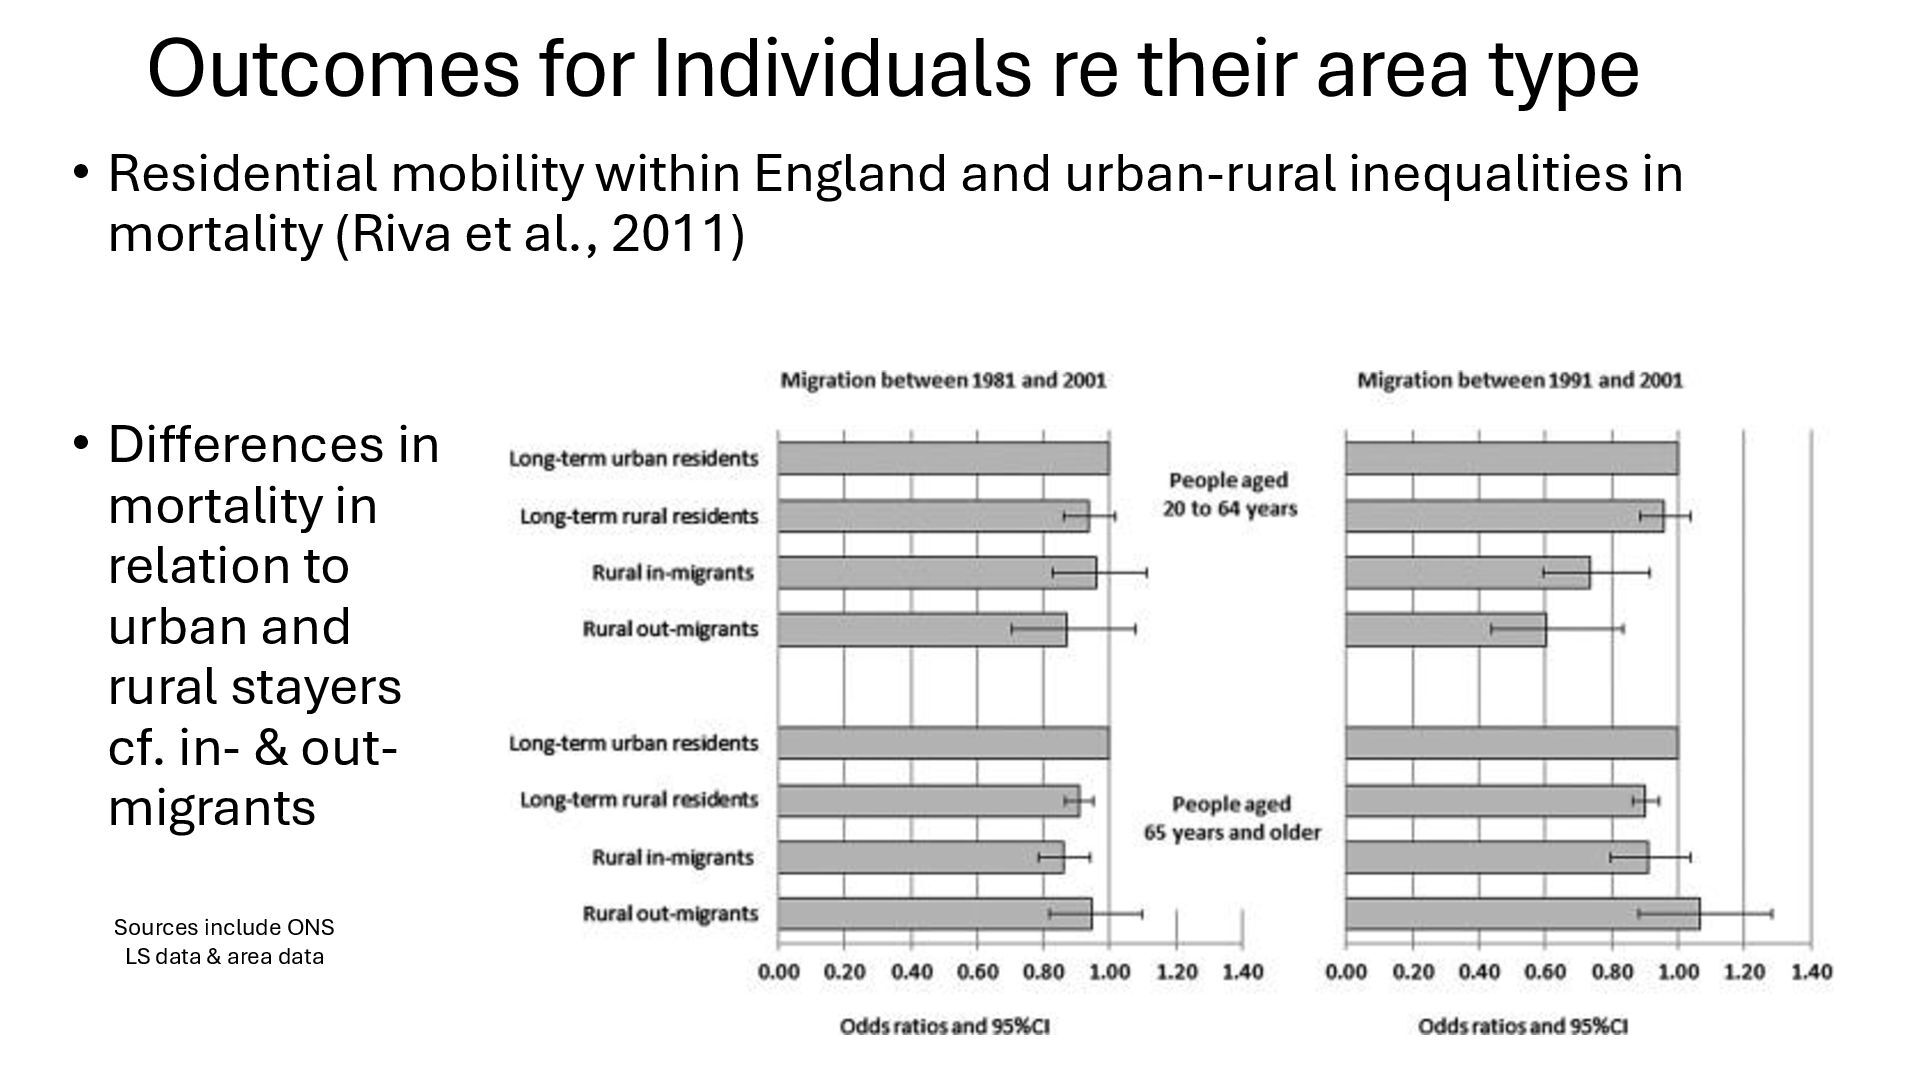
within England and urban-rural inequalities in mortality (Riva et al., 2011) • Differences in mortality in relation to urban and rural stayers cf. in- & out- migrants Sources include ONS LS data & area data
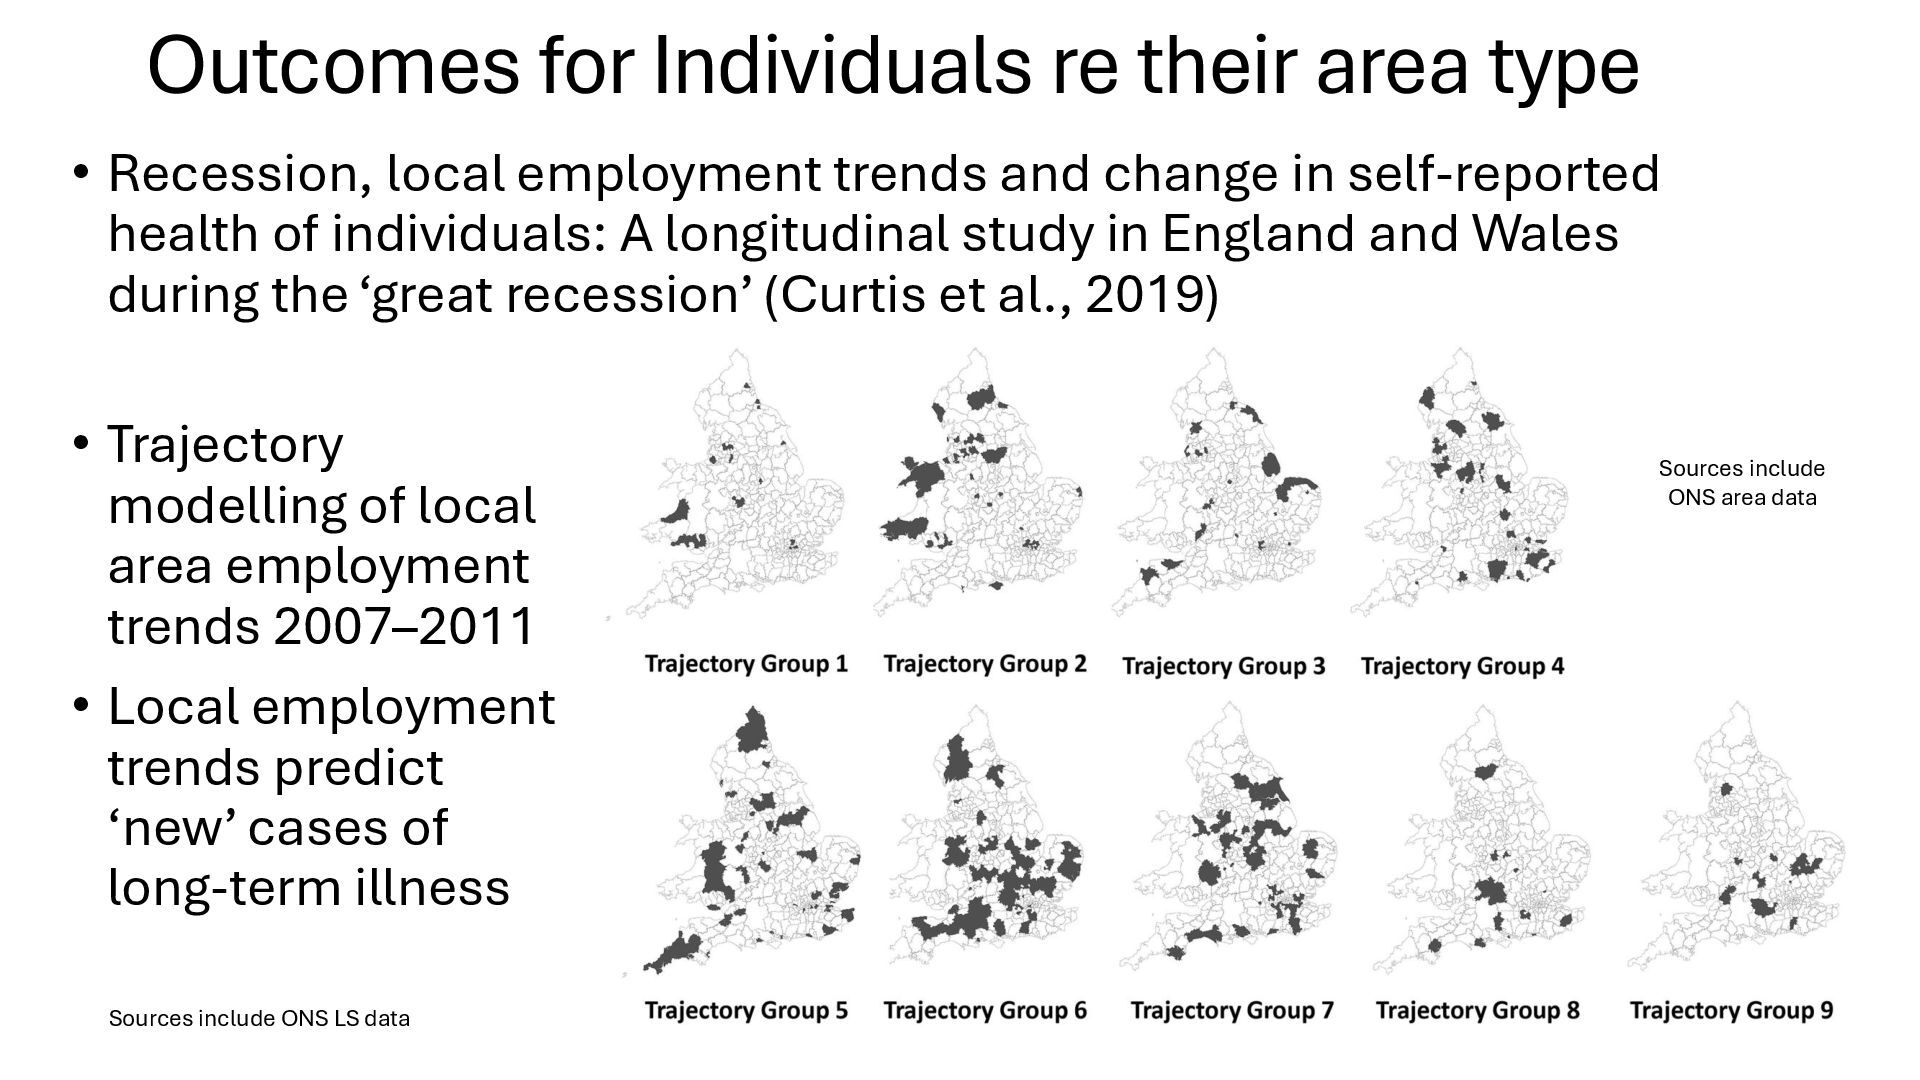
employment trends and change in self-reported health of individuals: A longitudinal study in England and Wales during the ‘great recession’ (Curtis et al., 2019) • Trajectory modelling of local area employment trends 2007–2011 • Local employment trends predict ‘new’ cases of long-term illness Sources include ONS LS data Sources include ONS area data
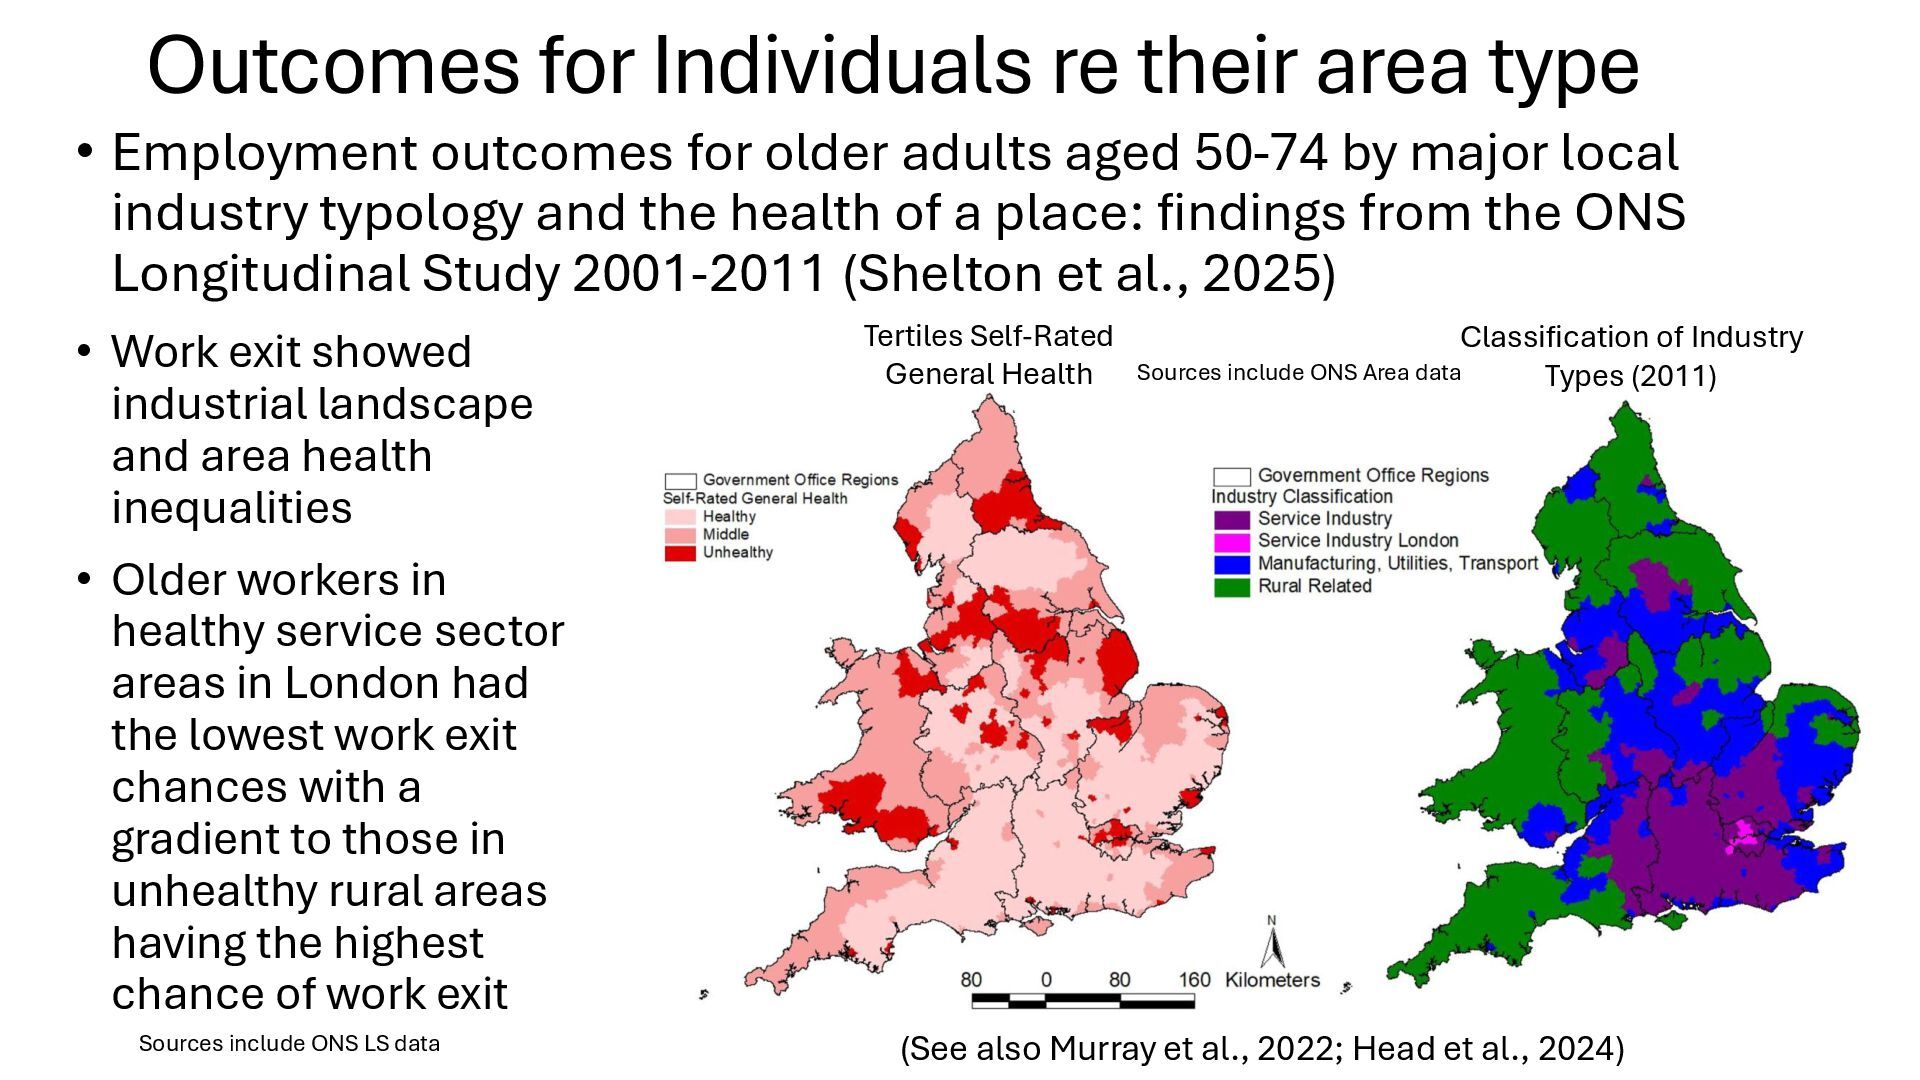
for older adults aged 50-74 by major local industry typology and the health of a place: findings from the ONS Longitudinal Study 2001-2011 (Shelton et al., 2025) • Work exit showed industrial landscape and area health inequalities • Older workers in healthy service sector areas in London had the lowest work exit chances with a gradient to those in unhealthy rural areas having the highest chance of work exit (See also Murray et al., 2022; Head et al., 2024) Tertiles Self-Rated General Health Classification of Industry Types (2011) Sources include ONS LS data Sources include ONS Area data
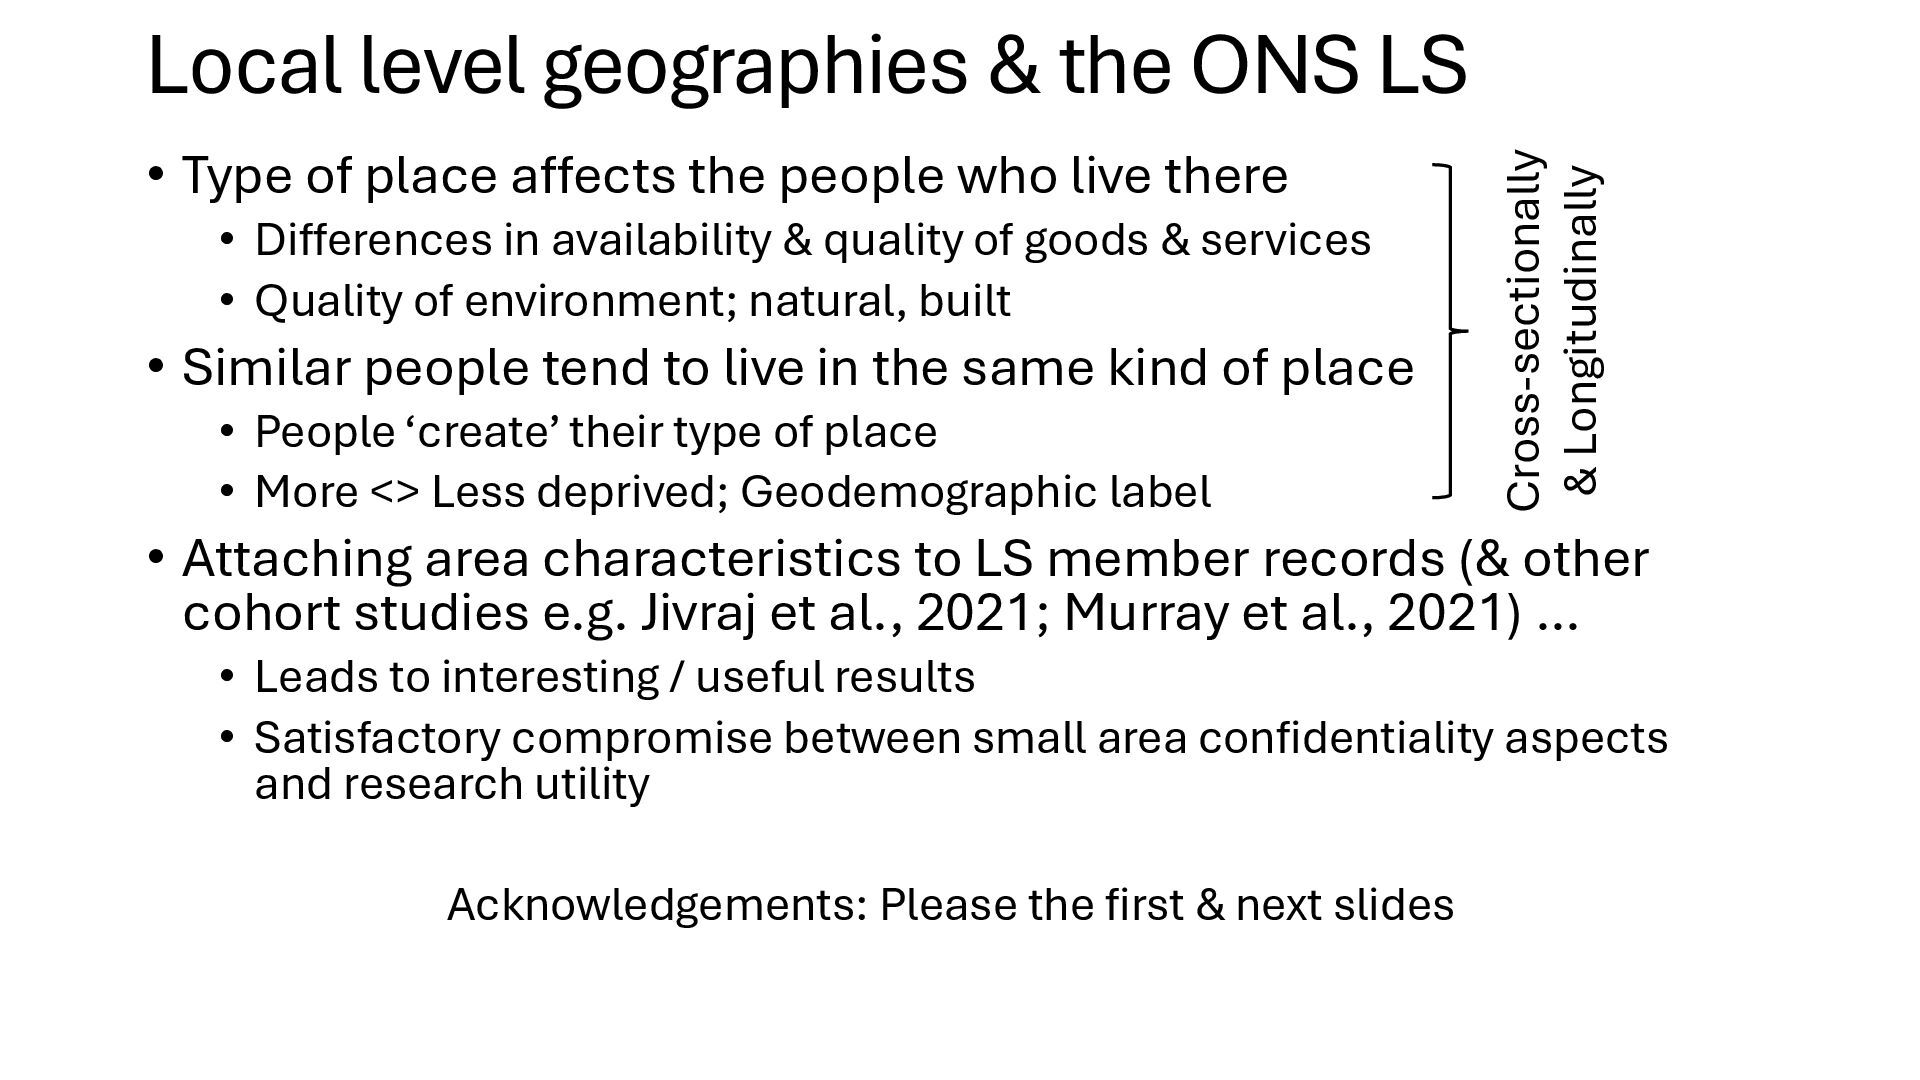
place affects the people who live there • Differences in availability & quality of goods & services • Quality of environment; natural, built • Similar people tend to live in the same kind of place • People ‘create’ their type of place • More <> Less deprived; Geodemographic label • Attaching area characteristics to LS member records (& other cohort studies e.g. Jivraj et al., 2021; Murray et al., 2021) … • Leads to interesting / useful results • Satisfactory compromise between small area confidentiality aspects and research utility Acknowledgements: Please the first & next slides Cross-sectionally & Longitudinally
use the Longitudinal Study is gratefully acknowledged, as is the help provided by staff of the Centre for Longitudinal Study Information & User Support (CeLSIUS). CeLSIUS is funded by the ESRC under project ES/V003488/1. The author(s) alone are responsible for the interpretation of the data This work contains statistical data from ONS which is Crown Copyright. The use of the ONS statistical data in this work does not imply the endorsement of the ONS in relation to the interpretation or analysis of the statistical data. This work uses research datasets which may not exactly reproduce National Statistics aggregates
mobility: evidence that it can widen health inequalities. Social Science & Medicine 68(10): 1835-1842 Boyle P, Norman P & Rees P (2004) Changing places: do changes in the relative deprivation of areas influence limiting long-term illness and mortality among non-migrant people living in non-deprived households? Social Science & Medicine 58: 2459-2471 Curtis S, Norman P, Cookson R, Cherrie M, Riva M, Pearce J (2019) Recession, local employment trends and change in self-reported health of individuals: a longitudinal study in England and Wales during the ‘great recession’ Health & Place 59 10274 https://doi.org/10.1016/j.healthplace.2019.102174 Darlington-Pollock F & Norman P (2022) Establishing a framework of analysis for selective sorting and changing health gradients. Population Space & Place https://doi.org/10.1002/psp.2359 Head J, Norman P, Shelton N, Beach B, Murray ET (2024) Does the health of local populations modify occupational differences in employment rates of older workers? Findings from the ONS Longitudinal Study 2001-2011. Health & Place https://doi.org/10.1016/j.healthplace.2024.103376 Jivraj S, Nicholas O, Murray ET & Norman P (2021) Life Course Neighbourhood Deprivation and Self-Rated Health: Does It Matter Where You Lived in Adolescence and Do Neighbourhood Effects Build Up over Life? International Journal of Environmental Research and Public Health 18, 10311. https://doi.org/10.3390/ijerph181910311 Murray ET, Head J, Shelton N, Beech B & Norman P (2022) Does it matter how we measure the health of older people in places for associations with labour market outcomes? A cross-sectional study. BMC Public Health 22, 2252 https://doi.org/10.1186/s12889-022-14661-0 Murray ET, Nicholas O, Norman P & Jivraj S. (2021) Life Course Neighborhood Deprivation Effects on Body Mass Index: Quantifying the Importance of Selective Migration. International Journal of Environmental Research and Public Health 18(16):8339. https://www.mdpi.com/1660-4601/18/16/8339/htm
between differently deprived areas evident at different ages? A longitudinal study of census records in England & Wales, 1991-2001. Health & Place 26:88-93 http://dx.doi.org/10.1016/j.healthplace.2013.12.010 Norman P & Riva M (2012) Population health across space and time: the geographical harmonisation of the ONS Longitudinal Study for England and Wales. Population, Space & Place 18: 483-502 DOI: 10.1002/psp.1705 Norman P (2017) Demographic and health time-series analysis of small areas in GB: the development of population estimates and measures of area characteristics. MOJ Public Health 6(4): 00179. DOI: 10.15406/mojph.2017.06.00179 Norman P (2018) Clarity in research frameworks for studying ‘health selective migration’. Commentary in Journal of Epidemiology & Community Health https://jech.bmj.com/content/72/6/449 Norman P, Boyle P & Rees P (2005) Selective migration, health and deprivation: a longitudinal analysis. Social Science & Medicine 60(12): 2755-2771 Norman P, Lloyd C, McLennan D, Ferguson S & Catney G (2024) 50-year Deprivation Trajectories: Local Area Change in England and Wales, 1971–2021. Applied Spatial Analysis & Policy https://doi.org/10.1007/s12061-024-09583-w Norman, P., Colbert, J. & Exeter, D.J. Linking Individuals to Areas: Protecting Confidentiality While Preserving Research Utility. Spatial Demography 11, 10 (2023). https://doi.org/10.1007/s40980-023-00121-9 Riva M, Curtis S & Norman P (2011) Residential mobility within England and urban-rural inequalities in mortality. Social Science & Medicine doi:10.1016/j.socscimed.2011.09.030 Shelton N, Norman P, Head J & Murray E (2025) Employment outcomes for older adults aged 50-74 by major local industry typology and the health of a place: findings from the ONS Longitudinal Study 2001-2011. Archives of Gerontology and Geriatrics https://www.sciencedirect.com/science/article/pii/S0167494325002304