Upgrade to Pro — share decks privately, control downloads, hide ads and more …

SRECon Coherent Performance

SRECon Coherent Performance

In this presentation I discuss how to talk about performance and where systems observability will be headed over the next several years.

Theo Schlossnagle

July 13, 2016
Tweet

More Decks by Theo Schlossnagle

Other Decks in Technology

Transcript

  1. If you don’t care about Performance You are in the

    wrong talk. @postwait should throw you out.
  2. Perhaps some justification is warranted Performance… makes a better user

    experience increases loyalty reduces product abandonment increases speed of product development lowers total cost of ownership builds more cohesive teams
  3. tl;dr it’s all about latency… Throughput vs. Latency Lower latency

    often
 affords increased throughput. Throughput is a well tread topic
 and uninteresting. Latency is the focus.
  4. Generally, time should be measured in seconds. UX latency should

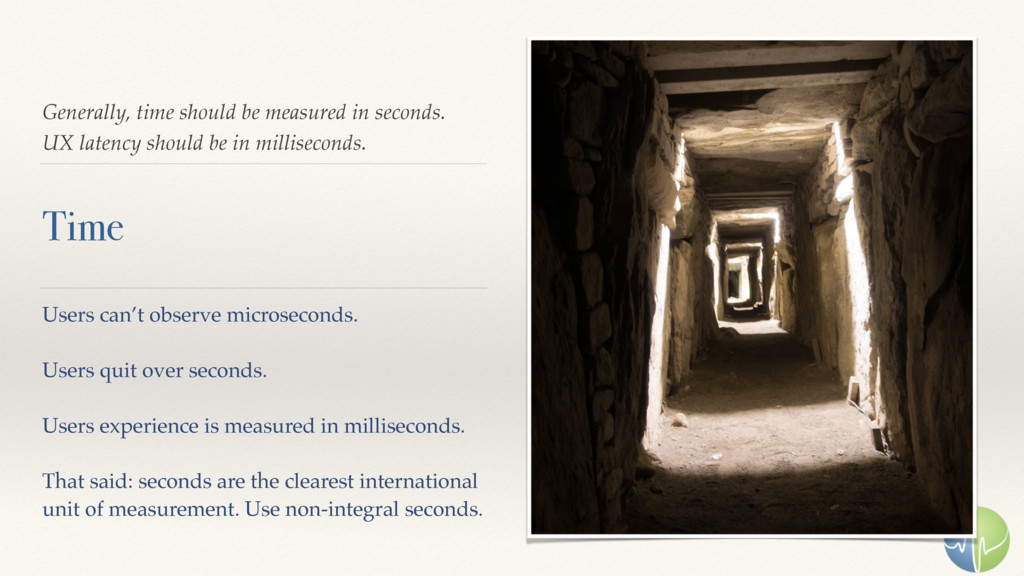
    be in milliseconds. Time Users can’t observe microseconds. Users quit over seconds. Users experience is measured in milliseconds.
 
 That said: seconds are the clearest international unit of measurement. Use non-integral seconds.
  5. –Theo Schlossnagle “Seconds are the clearest unit of time measurement.


    Use non-integral seconds for measuring time. Convert for people later.”
  6. Music is all about the space between the notes. Connectedness

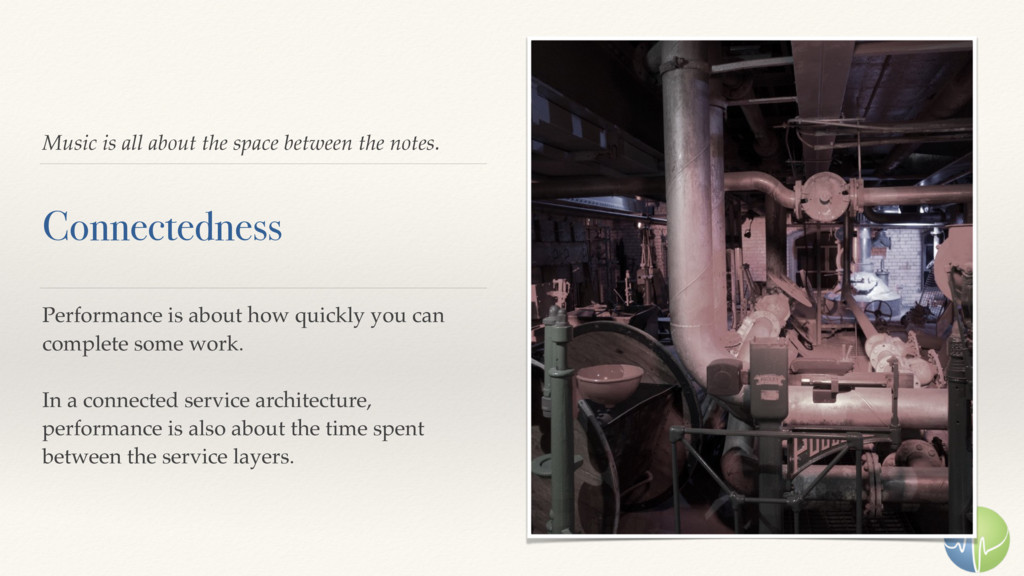
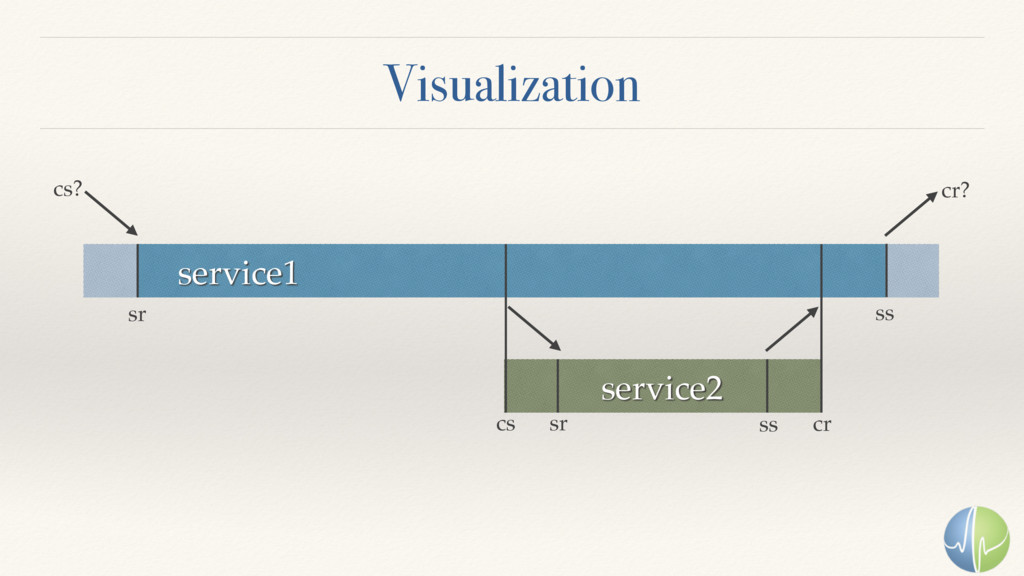
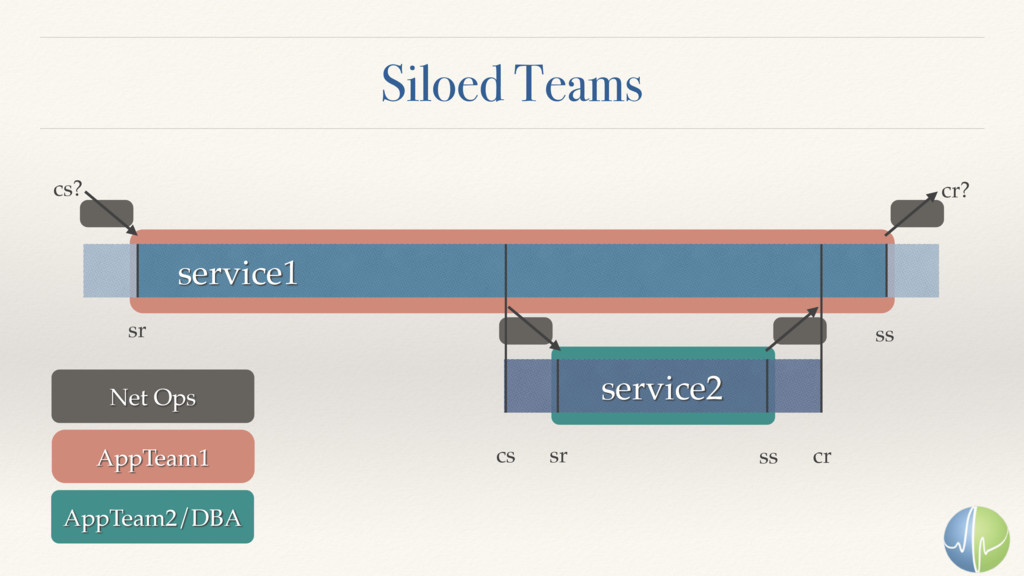
    Performance is about how quickly you can complete some work. In a connected service architecture, performance is also about the time spent between the service layers.
  7. Developing a Performance Culture It is easy to develop a

    rather unhealthy performance culture.
  8. What’s next? The Future of
 Systems Observability Have a deeply

    technical
 cross-team conversation
 about performance
  9. To predict the future,
 we look to the past. Web

    monitoring: • [2000]-> Synthetic Monitoring • [2010] -> RUM Systems monitoring: • [2010] -> Synthetic Monitoring • [????] -> Observed Behavior Monitoring
  10. A search for the best representation of behavior To win,


    we must compromise To conquer our information- theoretic issue, we must take a different approach.
  11. Path 1 Full system tracing.
 Sometimes. Fun… The way for

    deep contextual truth. Often dirty and expensive.
  12. Path 2 Keep the volume,
 Lose the dimensionality. You can’t

    find where
 each grain of sand came from. But you can
 understand an accurate topology
 of the beach over time
 and reason about it.
  13. Large-Scale Distributed Systems Tracing Infrastructure Dapper Google published a paper:

    research.google.com/pubs/pub36356.html As usual, code never saw the outside.
  14. Large-Scale Distributed Systems Tracing Infrastructure Dapper Google published a paper:

    research.google.com/pubs/pub36356.html As usual, code never saw the outside. web api data agg mq db data store cep alerting
  15. Siloed Teams service1 service2 sr sr ss cr cs ss

    cs? cr? Net Ops AppTeam1 AppTeam2/DBA
  16. Better Responsibilities service1 service2 sr sr ss cr cs ss

    cs? cr? Net Ops AppTeam1 AppTeam2/DBA
  17. This doesn’t work at all levels Imagine Service “Disk” If

    you trace into each disk request and record these spans… we now have an information-theoretic issue
  18. A pseudo-Dapper Zipkin OpenZipkin Twitter sought to (re)implement Dapper. Disappointingly

    few improvements. Some unfortunate UX issues. Sound. Simple. Valuable.
  19. Thrift and Scribe should both die. Scribe is Terrible Terrible.

    Terrible Terrible. Zipkin frames are thrift encoded. Scribe is “strings” in Thrift. Zipkin is Thift, in base64, in Thrift. WTF?
  20. The whole point is to be low overhead Screw Scribe

    We push raw thrift over Fq
 github.com/circonus-labs/fq Completely async publishing,
 lock free if using the C library. Consolidating Zipkin’s bad decisions: github.com/circonus-labs/fq2scribe
  21. Telling computers what to do. Zipkin is Java/Scala Wrote C

    support: github.com/circonus-labs/libmtev Wrote Perl support: github.com/circonus-labs/circonus-tracer-perl
  22. Celebration Day 1 Noticed unexpected topology queries. Found a data

    location caching issue. Shaved 350ms off every graph request.
  23. Celebration Day 4-7 Noticed frequent 150ms stalls in internal REST.

    Frequent == 90%+ Found a libcurl issue (async resolver). Shaved 150ms*(n*0.9) off ~50% of page loads.
  24. Sampling frequencies need to change. First some
 statistical realities If

    your model has outliers; and most do. It is rare that you can confidently claim a change in behavior from a single datapoint. You need a lot of data.