Share
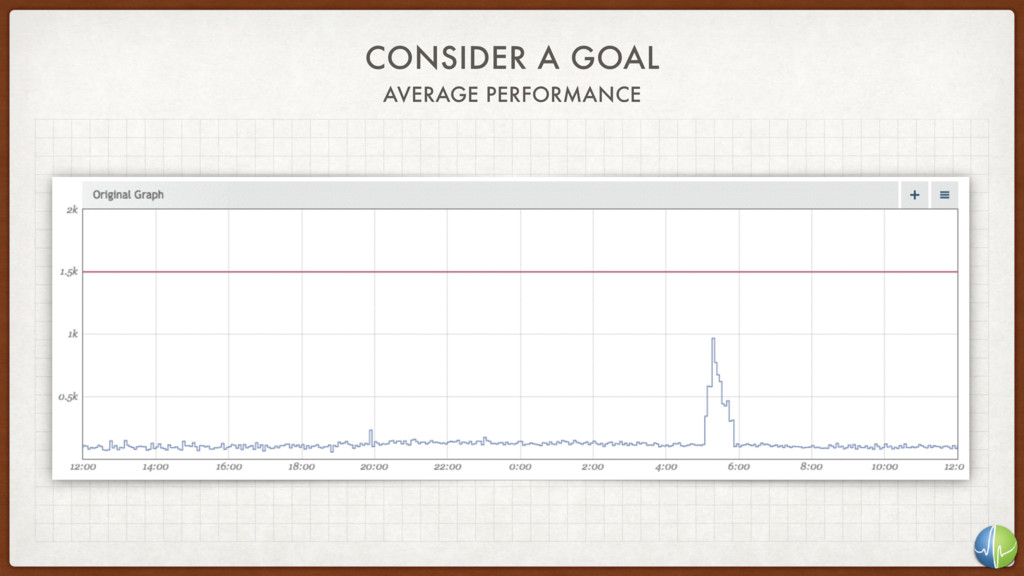
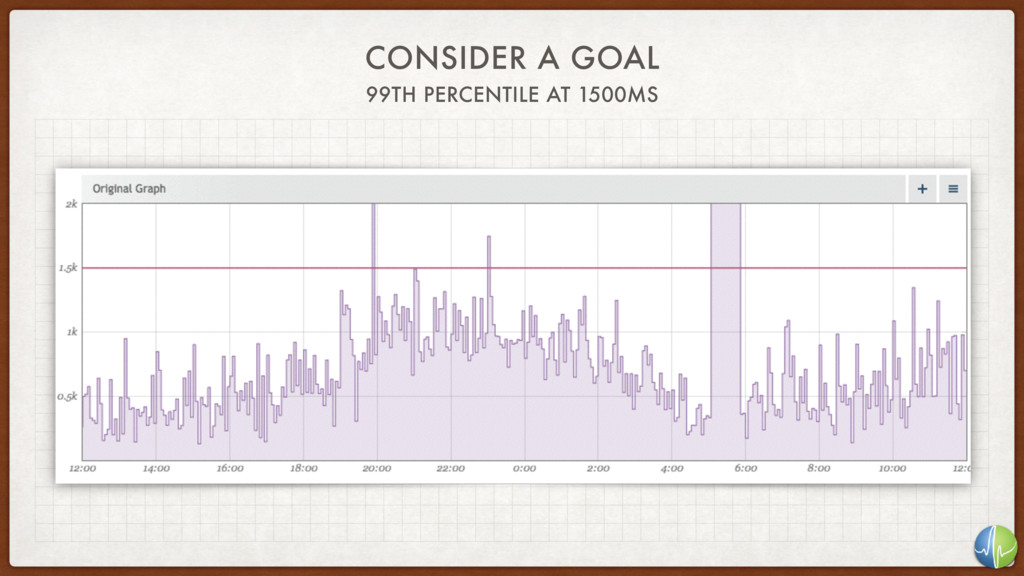
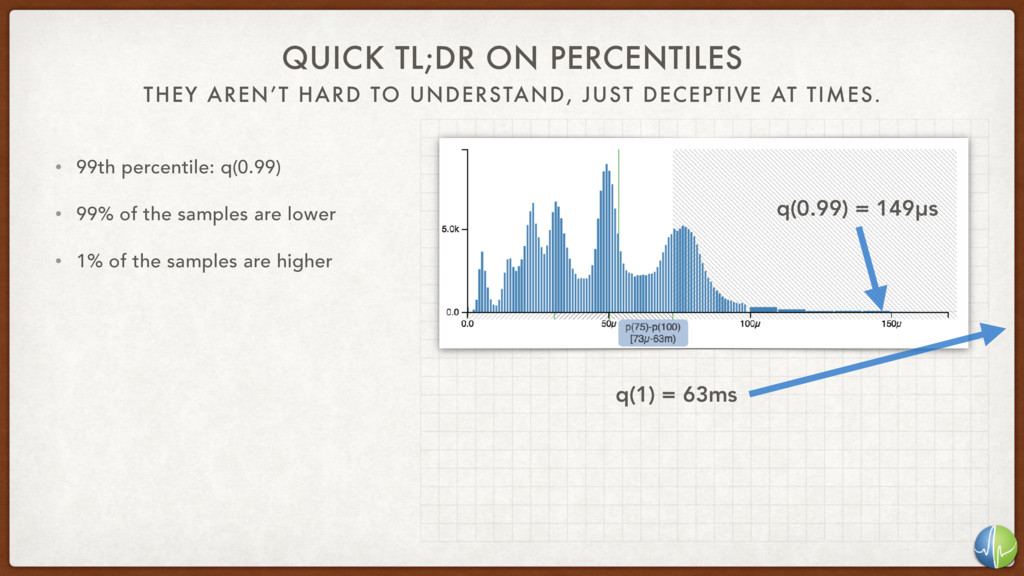
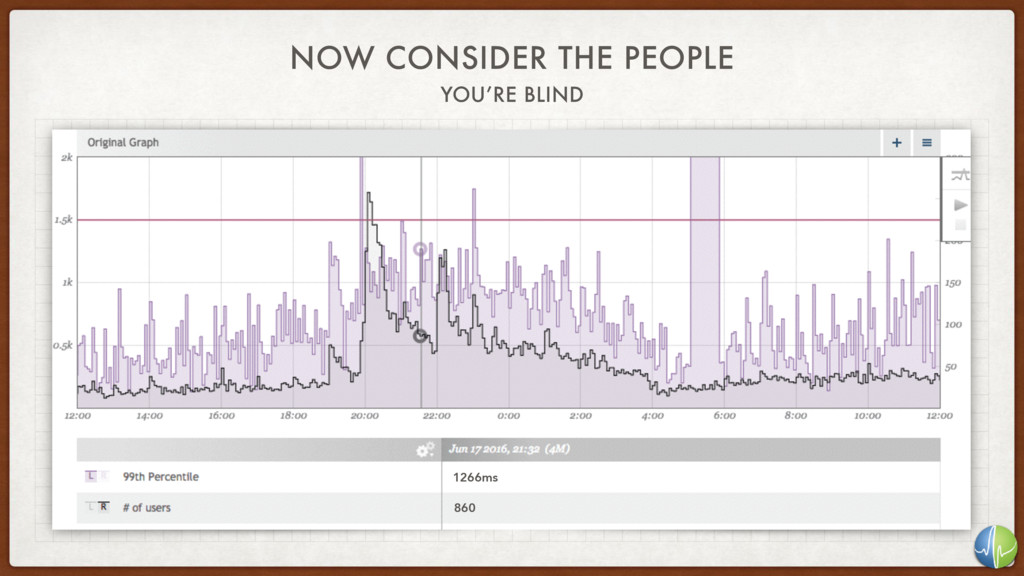
A discussion of the problems with using averages and other simple statistical reductions (such as percentiles) on rich data. An expose of histograms and a brief discussion of the challenges of timing low-latency systems behavior with 100% sampling.