Upgrade to Pro — share decks privately, control downloads, hide ads and more …

The math behind big systems analysis.

The math behind big systems analysis.

This presentations discusses the challenges in processing real-time, high-frequency time-series data for anomaly detection.

Theo Schlossnagle

November 12, 2014
Tweet

More Decks by Theo Schlossnagle

Other Decks in Technology

Transcript

  1. A tour through mathematical methods on systems telemetry Math in

    Big Systems If it was a
 simple math problem,
 we’d have
 solved all this by now.
  2. Choosing an approach is premature… Problems How do we determine

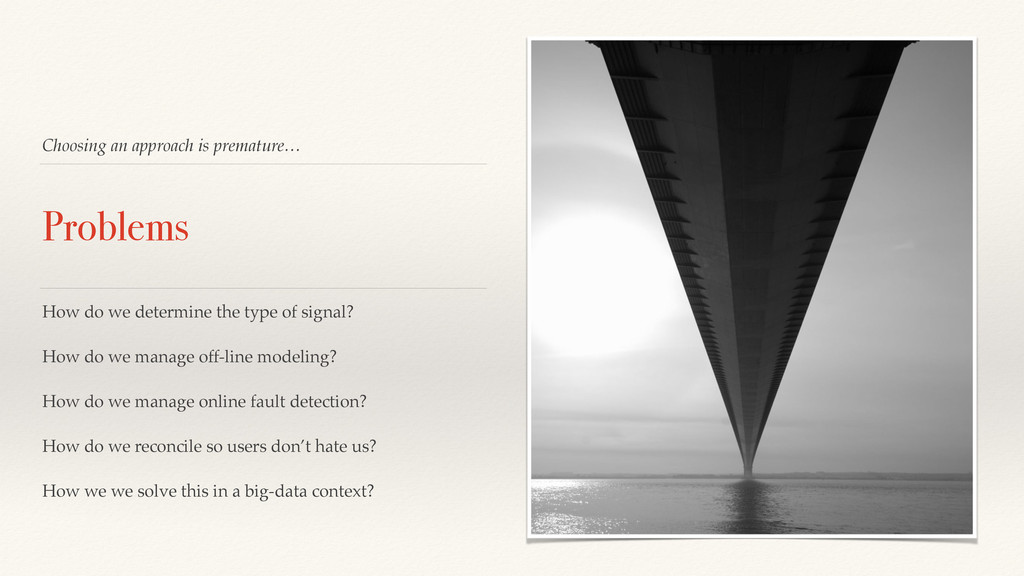
    the type of signal? How do we manage off-line modeling? How do we manage online fault detection? How do we reconcile so users don’t hate us? How we we solve this in a big-data context?
  3. Garbage in, category out. Classification Understanding a signal We found

    to be quite ad-hoc At least the feature extraction
  4. A year of service… I should be able to learn

    something. API requests/second 1 year
  5. A year of service… I should be able to learn

    something. API requests 1 year
  6. A year of service… I should be able to learn

    something. API requests 1 year ∆v ∆t , ∀ ∆v ≥ 0
  7. Some data goes both ways… Complicating Things Imagine disk space

    used… it makes sense as a gauge (how full) it makes sense as rate (fill rate)
  8. Error + error + guessing = success How we categorize

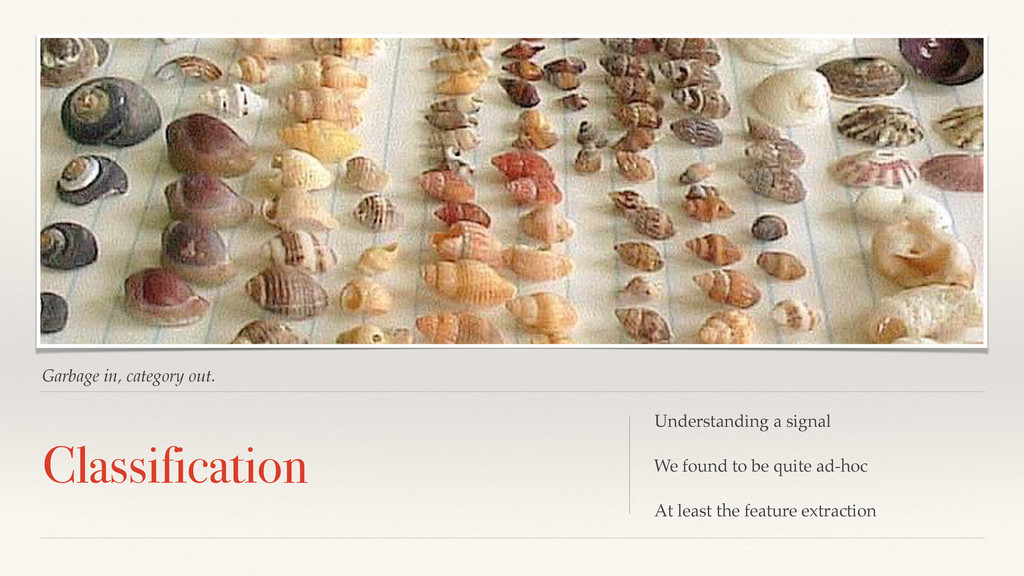
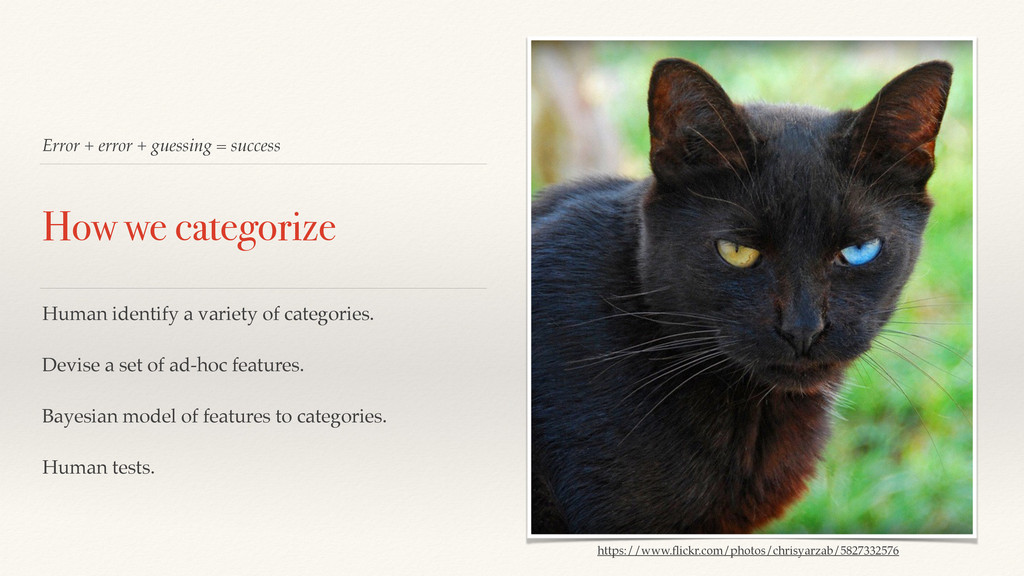
    Human identify a variety of categories. Devise a set of ad-hoc features. Bayesian model of features to categories. Human tests. https://www.flickr.com/photos/chrisyarzab/5827332576
  9. Many signals have significant noise around their averages Signal Noise

    A single “obviously wrong” measurement… is often a reasonable outlier.
  10. A year of service… I should be able to learn

    something. API requests/second 1 year
  11. Lies, damned lies, and statistics Simple Truths Statistics are only

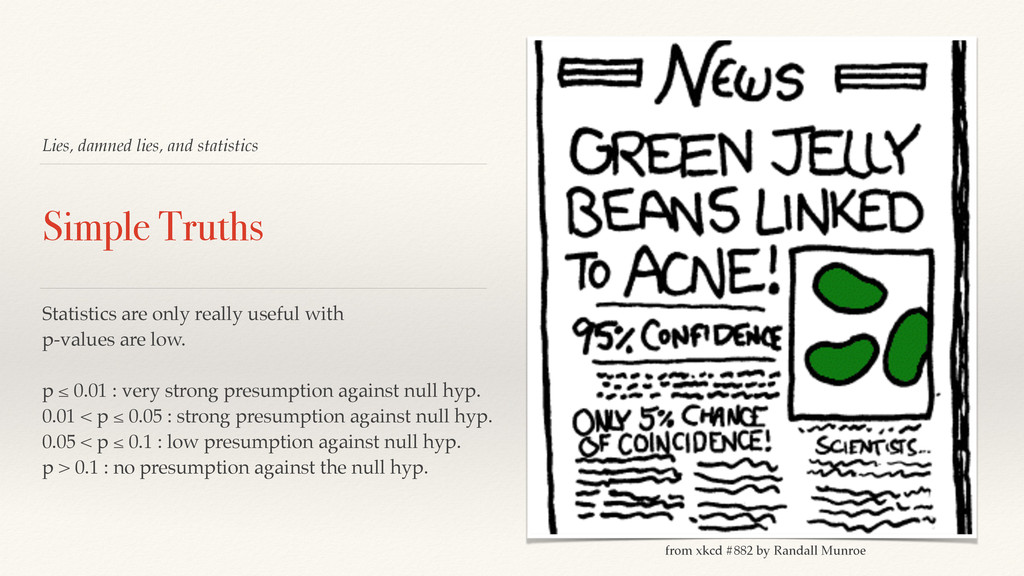
    really useful with p-values are low. p ≤ 0.01 : very strong presumption against null hyp. 0.01 < p ≤ 0.05 : strong presumption against null hyp. 0.05 < p ≤ 0.1 : low presumption against null hyp. p > 0.1 : no presumption against the null hyp. from xkcd #882 by Randall Munroe
  12. What does a p-value have to do with applying stats?

    The p-value problem It turns out a lot of measurement data (passive) is very infrequent. 60% of the time… it works every time.
  13. Our low frequencies lead us to questions of doubt… Given

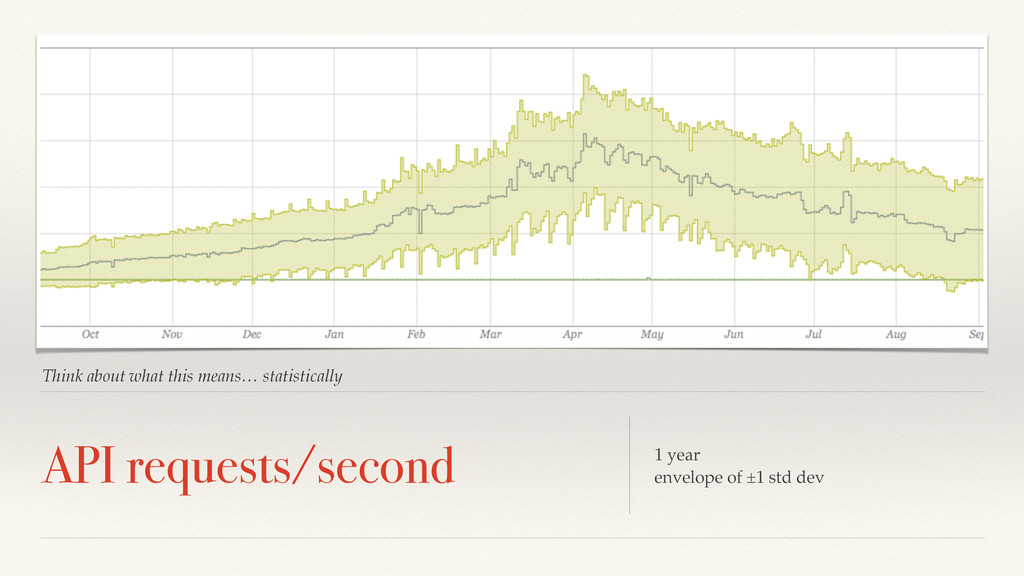
    a certain statistical model: How many few points need to be seen before we are sufficiently confident that it does not fit the model (presumption against the null hypothesis)? With few, we simply have outliers or insignificant aberrations. http://www.flickr.com/photos/rooreynolds/
  14. Solving the Frequency Problem More data, more often…
 (obviously) 1.

    sample faster
 (faster from the source) 2. analyze wider
 (more sources) OR
  15. Increasing frequency is the only option at times. Signals of

    Importance Without large-scale systems We must increase frequency https://www.flickr.com/photos/whosdadog/3652670385
  16. Most algorithms require measuring residuals from a mean Mean means

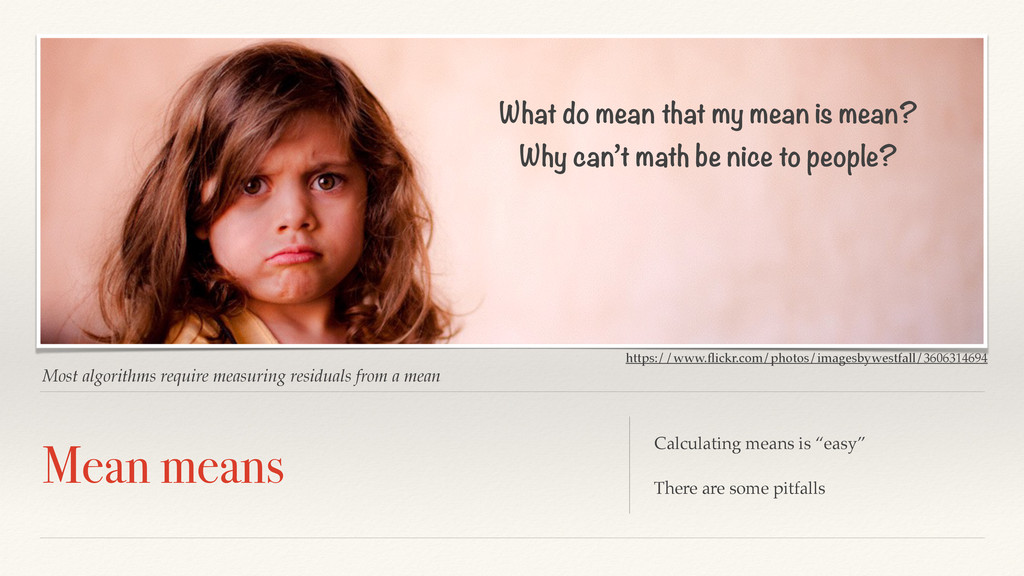
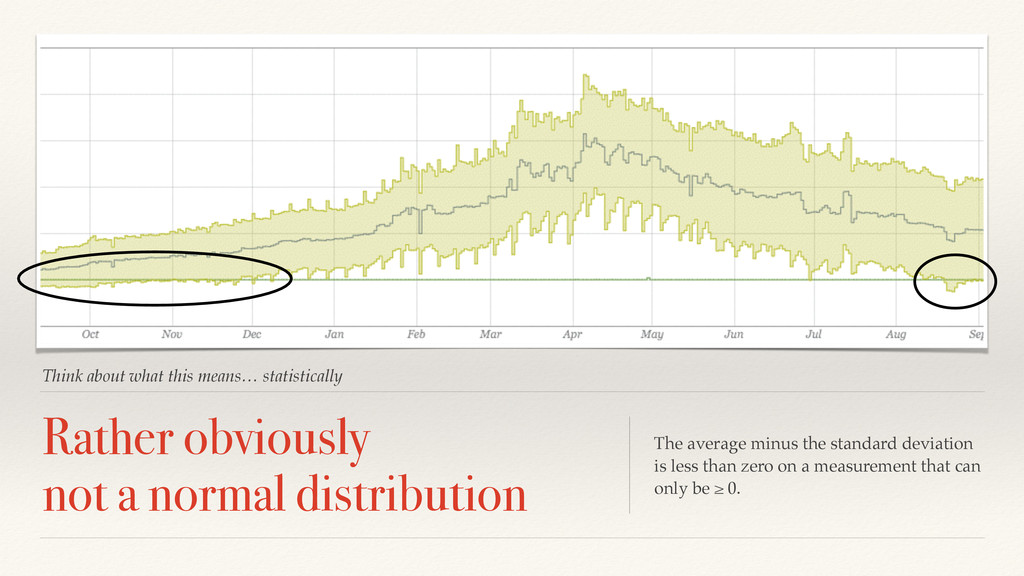
    Calculating means is “easy” There are some pitfalls What do mean that my mean is mean? Why can’t math be nice to people? https://www.flickr.com/photos/imagesbywestfall/3606314694
  17. Newer data should influence our model. Signals change The model

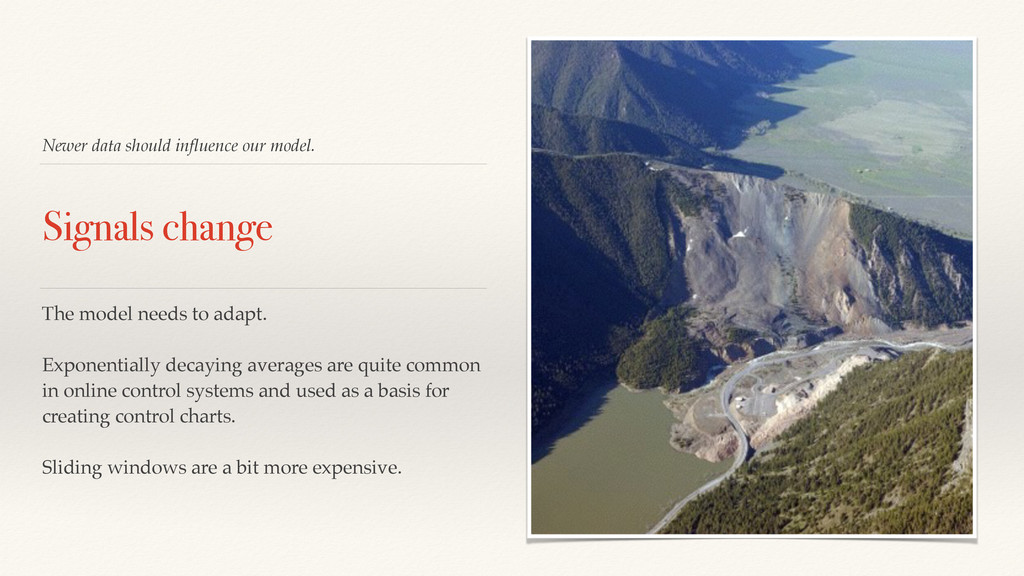
    needs to adapt. Exponentially decaying averages are quite common in online control systems and used as a basis for creating control charts. Sliding windows are a bit more expensive.
  18. EWM vs. SWM ❖ EWM : ST ❖ S1 =

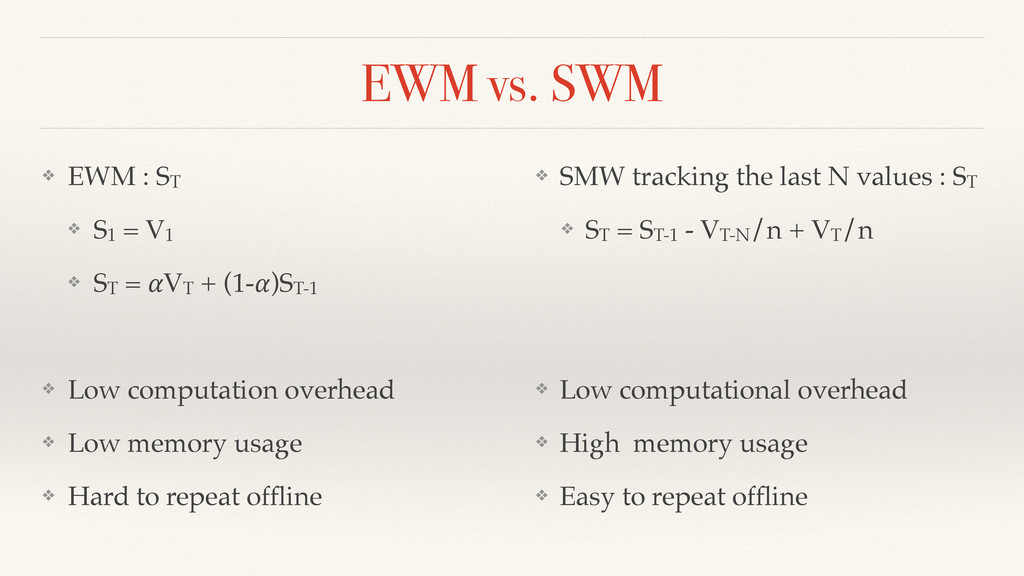
    V1 ❖ ST = VT + (1-)ST-1 ❖ Low computation overhead ❖ Low memory usage ❖ Hard to repeat offline ❖ SMW tracking the last N values : ST ❖ ST = ST-1 - VT-N/n + VT/n ❖ Low computational overhead ❖ High memory usage ❖ Easy to repeat offline
  19. Repeatable outcomes are needed In our system… We need our

    online algorithms to match our offline algorithms. This is because human beings get pissed off when they can’t repeat outcomes that woke them up in the middle of the night. EWM: not repeatable SWM: expensive in online application
  20. Can we do better? Investigations The CUSUM method has some

    issues. It’s challenging when signals are noise or of variable rate. We’re looking into the Tukey test: • compares all possible pairs of means • test is conservative in light of uneven sample sizes https://www.flickr.com/photos/st3f4n/4272645780
  21. Most statistical methods assume a normal distribution. Your telemetry data

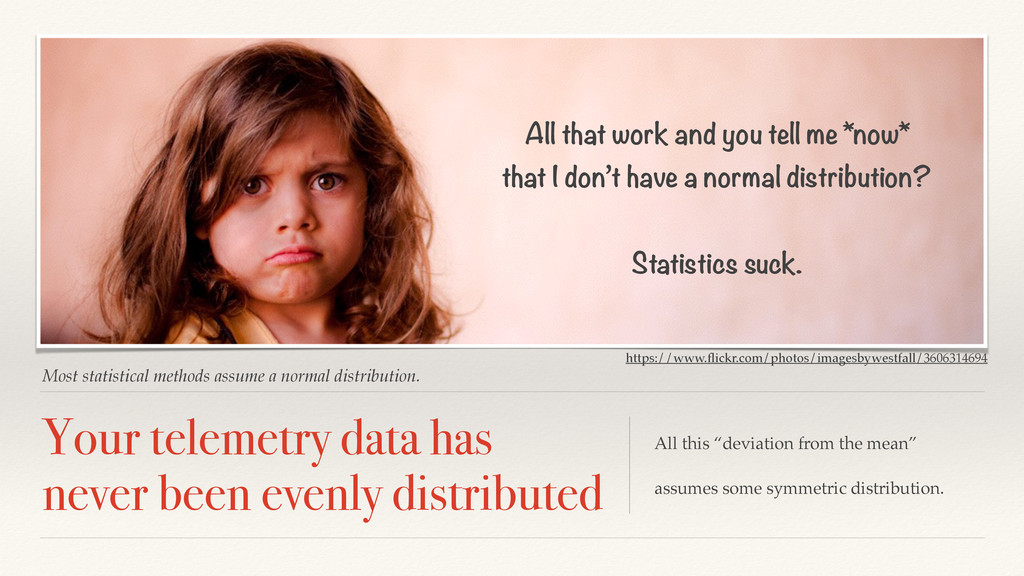
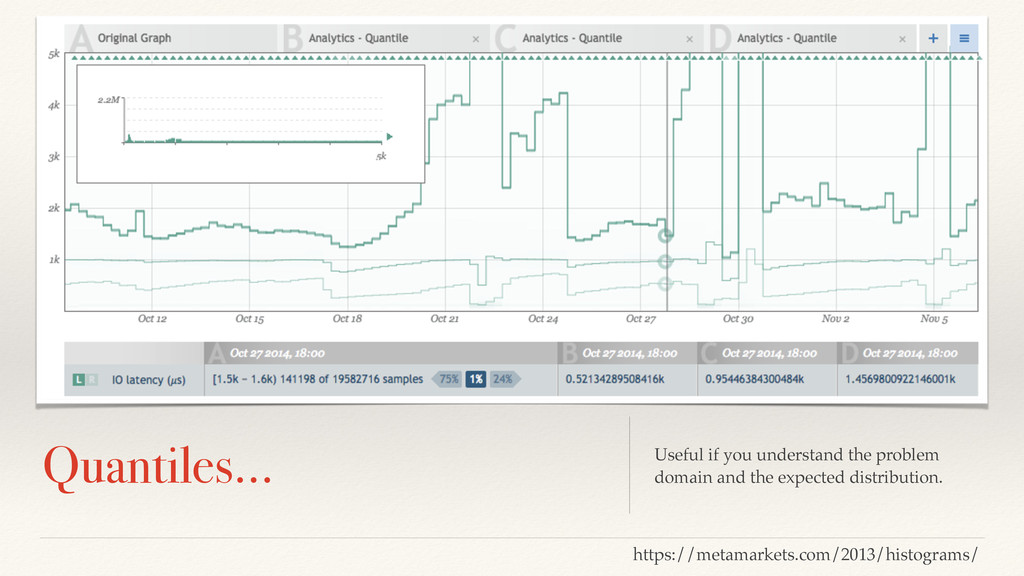
    has
 never been evenly distributed All this “deviation from the mean” assumes some symmetric distribution. All that work and you tell me *now* that I don’t have a normal distribution? Statistics suck. https://www.flickr.com/photos/imagesbywestfall/3606314694
  22. Think about what this means… statistically Rather obviously
 not a

    normal distribution The average minus the standard deviation is less than zero on a measurement that can only be ≥ 0.
  23. With all the data, we have a complete picture of

    population distribution. What if we had all the data? … full distribution Now we can do statistics
 that isn’t hand-wavy.
  24. High volume data requires a different strategy What happens when


    we get what we asked for? 10,000 measurements per second? more? on each stream… with millions of streams.
  25. Let’s understand the scope of the problem. First some realities

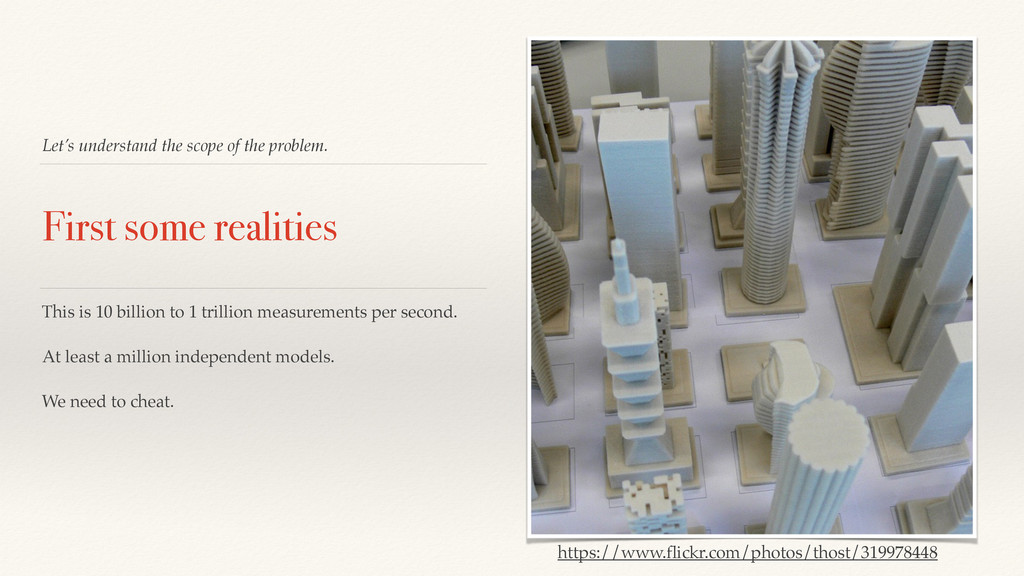
    This is 10 billion to 1 trillion measurements per second. At least a million independent models. We need to cheat. https://www.flickr.com/photos/thost/319978448
  26. When we have too much, simplify… Information compression We need

    to look to transform the data. Add error in the value space. Add error in the time space. https://www.flickr.com/photos/meddygarnet/3085238543
  27. Summarization & Extraction ❖ Take our high-velocity stream ❖ Summarize

    as a histogram over 1 minute (error) ❖ Extract useful less-dimensional characteristics ❖ Apply CUSUM and Tukey tests on characteristics
  28. Lorem Ipsum Dolor Modes & moments. Strong indicators of
 shifts

    in workload http://www.brendangregg.com/FrequencyTrails/modes.html
  29. Lorem Ipsum Dolor Quantiles… Useful if you understand the problem

    domain and the expected distribution. https://metamarkets.com/2013/histograms/
  30. Lorem Ipsum Dolor Inverse Quantiles… Q: “What quantile is 5ms

    of latency?” Useful if you understand the problem domain and the expected distribution.
  31. Thank ou! and thank you to the real brains behind

    Circonus’ analysis systems: Heinrich and George.