Upgrade to Pro — share decks privately, control downloads, hide ads and more …

2016 - Eben Freeman - Python tracing superpowers with systems tools

PyBay
August 20, 2016

2016 - Eben Freeman - Python tracing superpowers with systems tools

Description
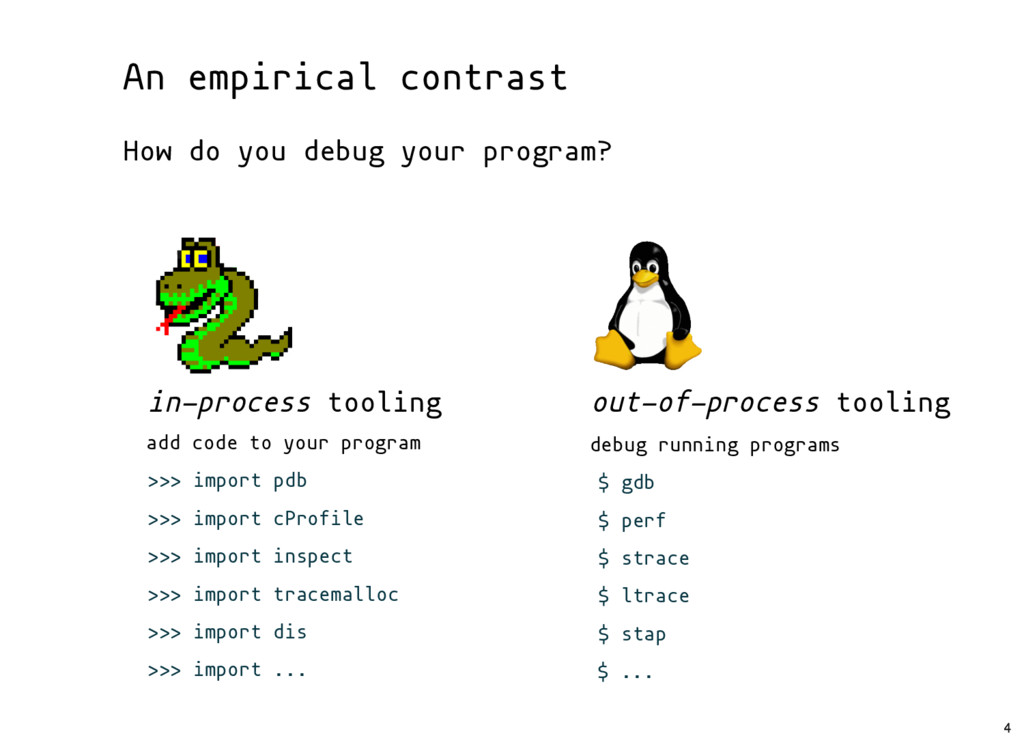
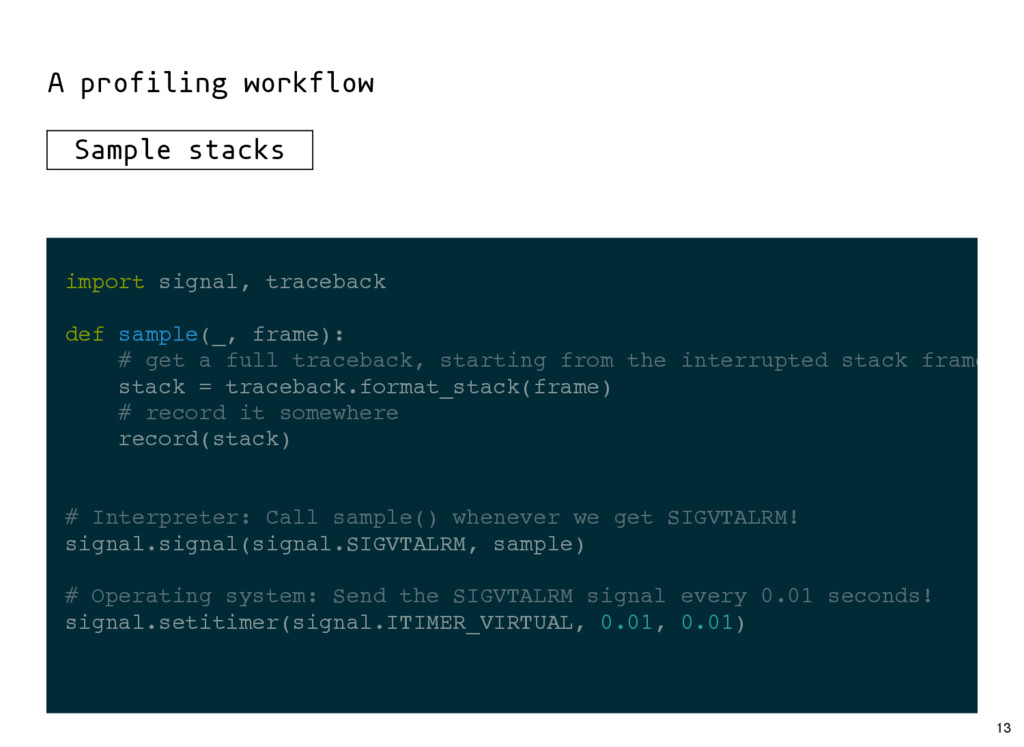
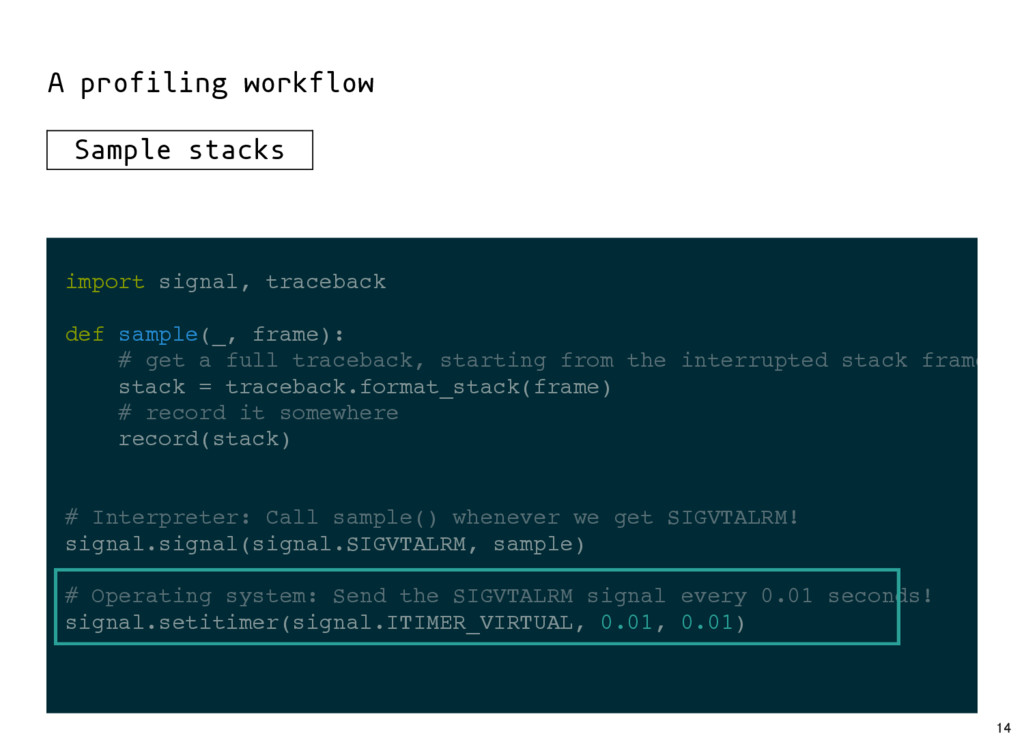
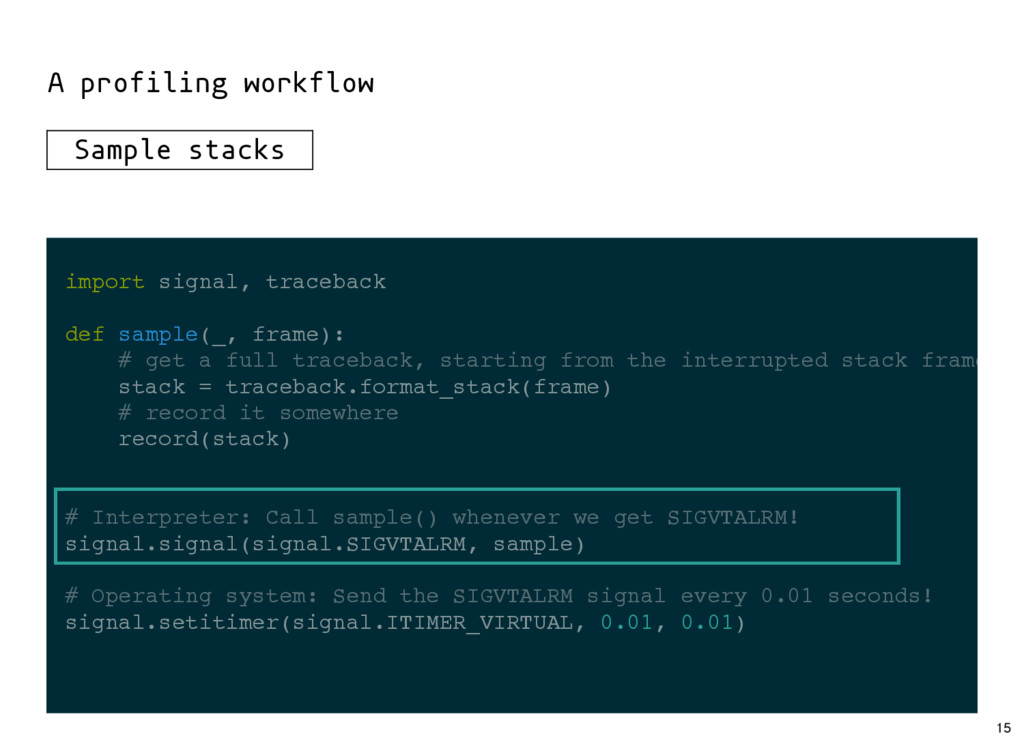
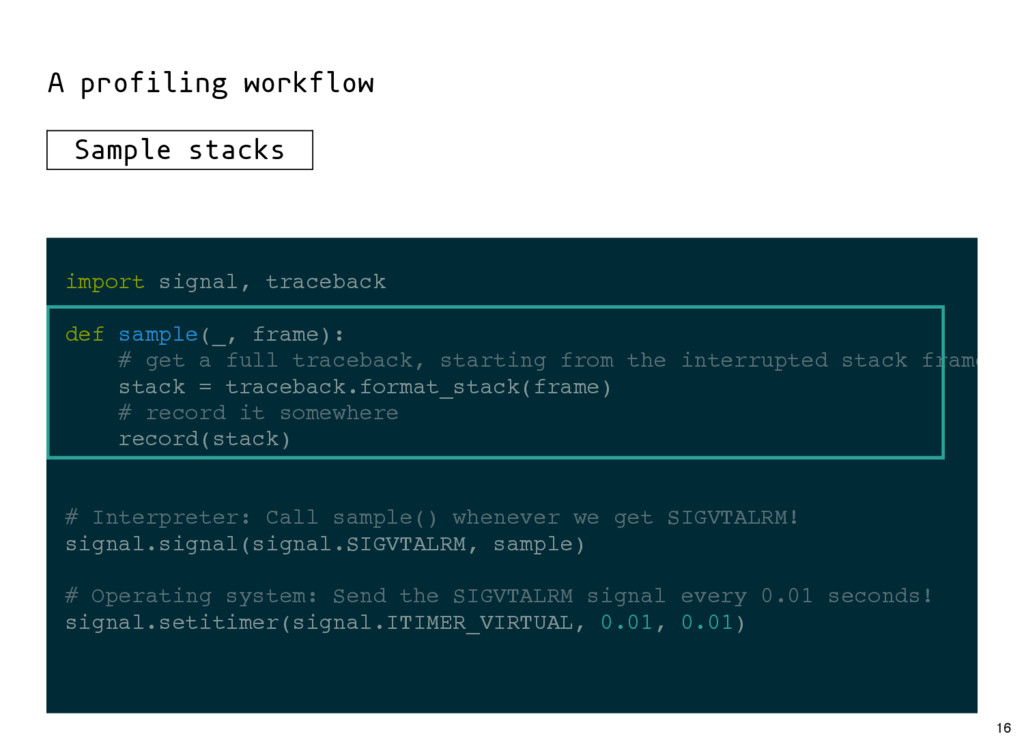
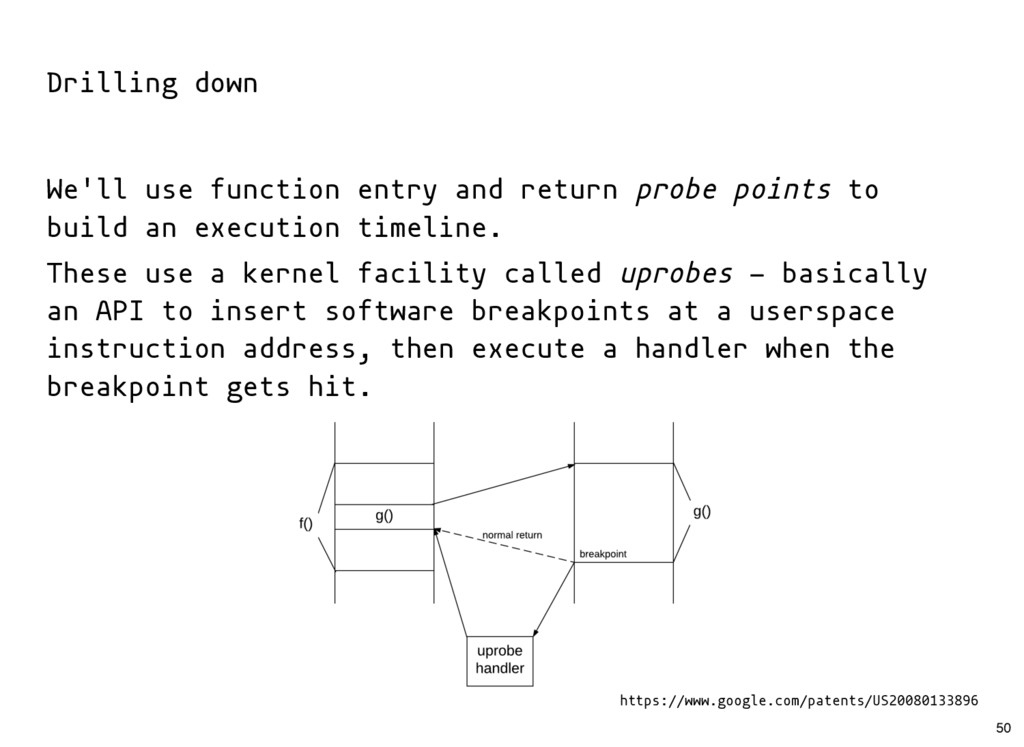
Modern system tracers like SystemTap or Dtrace are incredibly powerful. If they're not part of your arsenal of techniques for analyzing Python code, you might be missing out. In this talk, we'll explore how these tools work, and how they can be used for dynamic, low-overhead analysis of unmodified Python programs.

Abstract
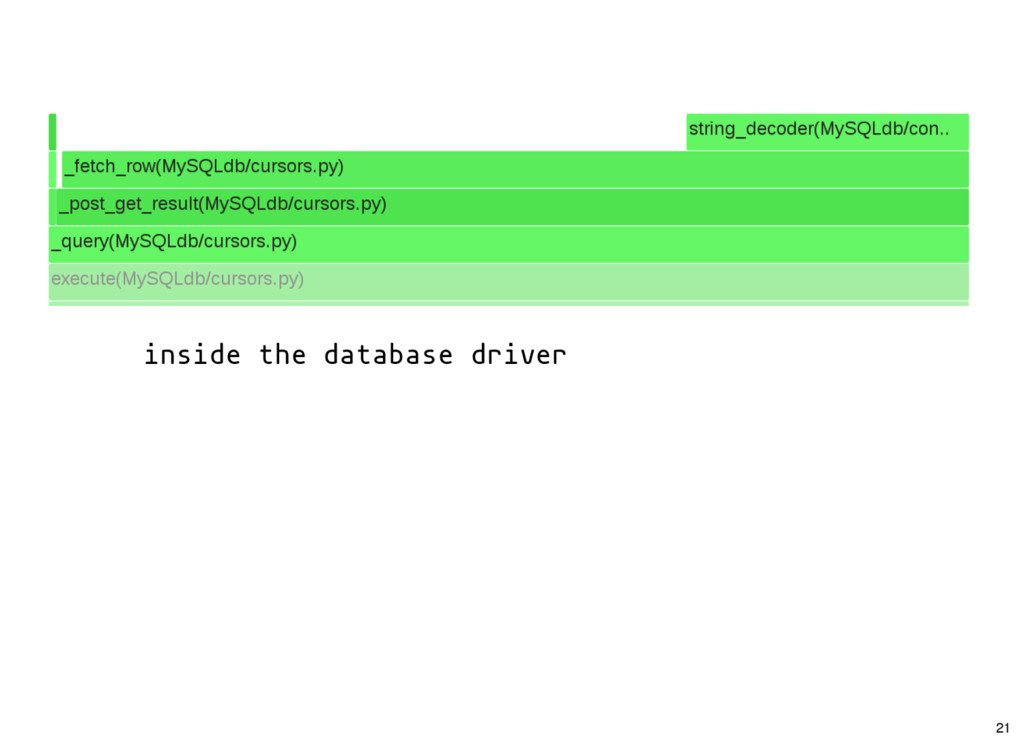
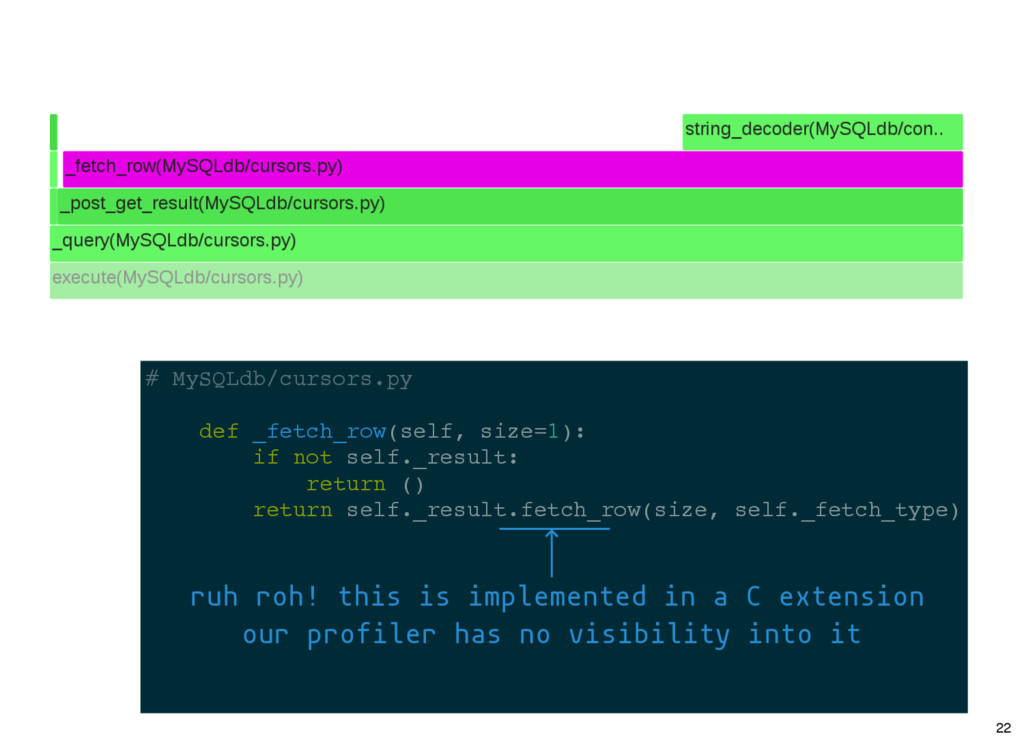
Maybe you want to profile your program, but it's running lots of C extension code and conventional profilers can't help you. Or maybe you're tracking down an emergent problem in a production system, but the logs are barren.

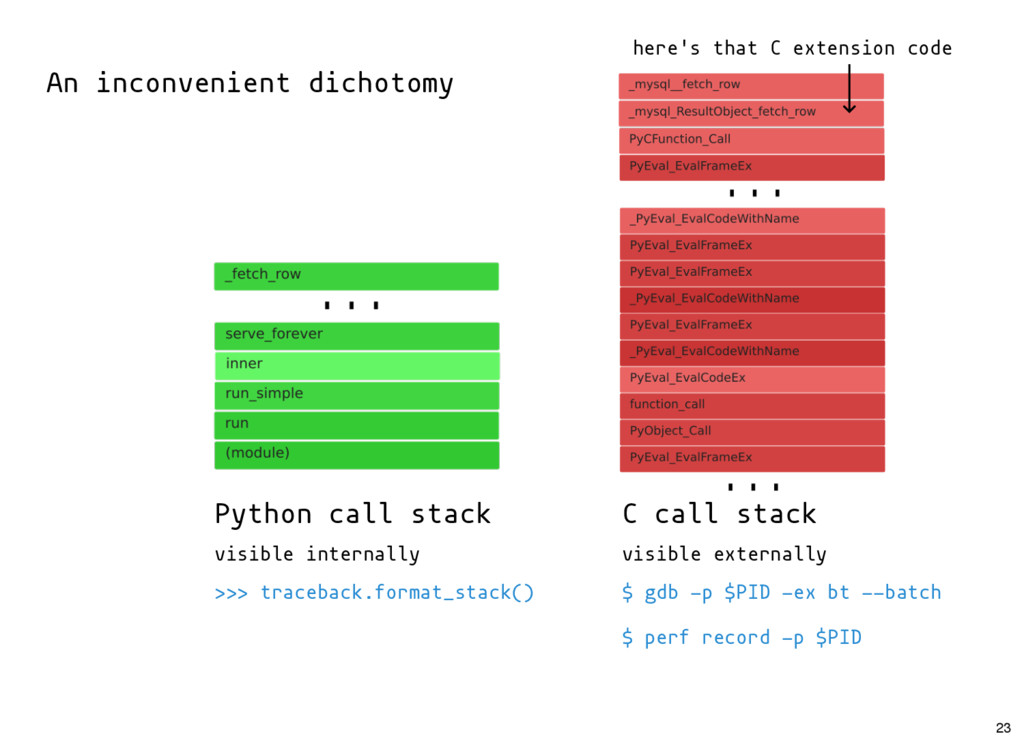
Advanced tracing toolkits like SystemTap can help you analyze your program in real time, without modifying or restarting it. But they can also seem dauntingly unfriendly, especially when applied to interpreted languages like Python.

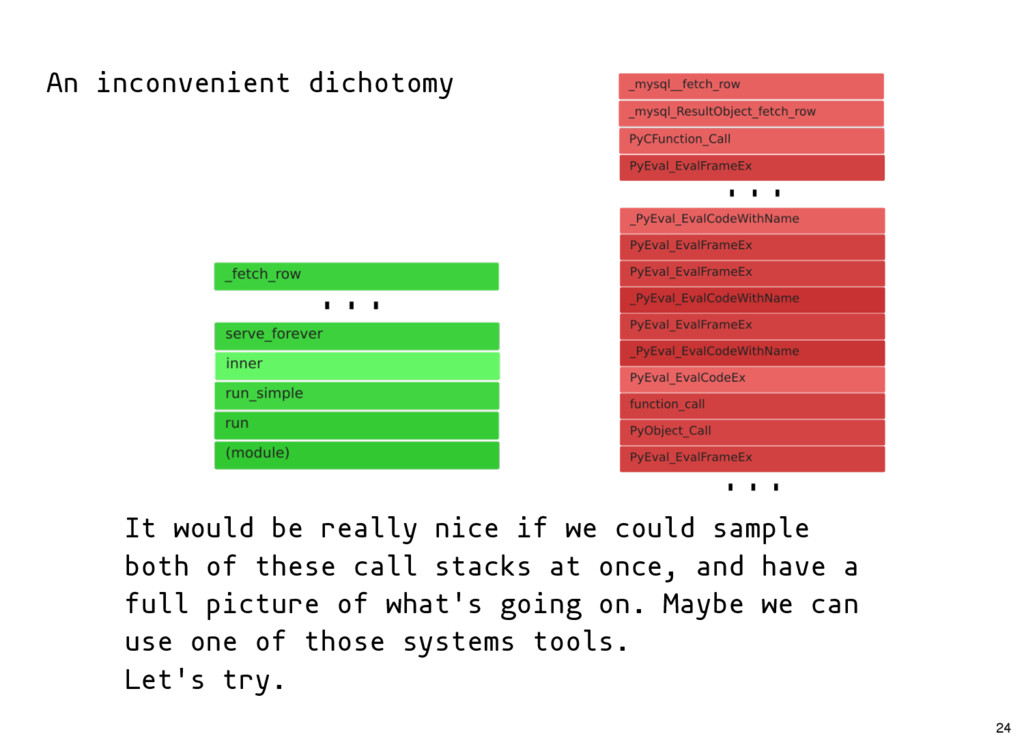
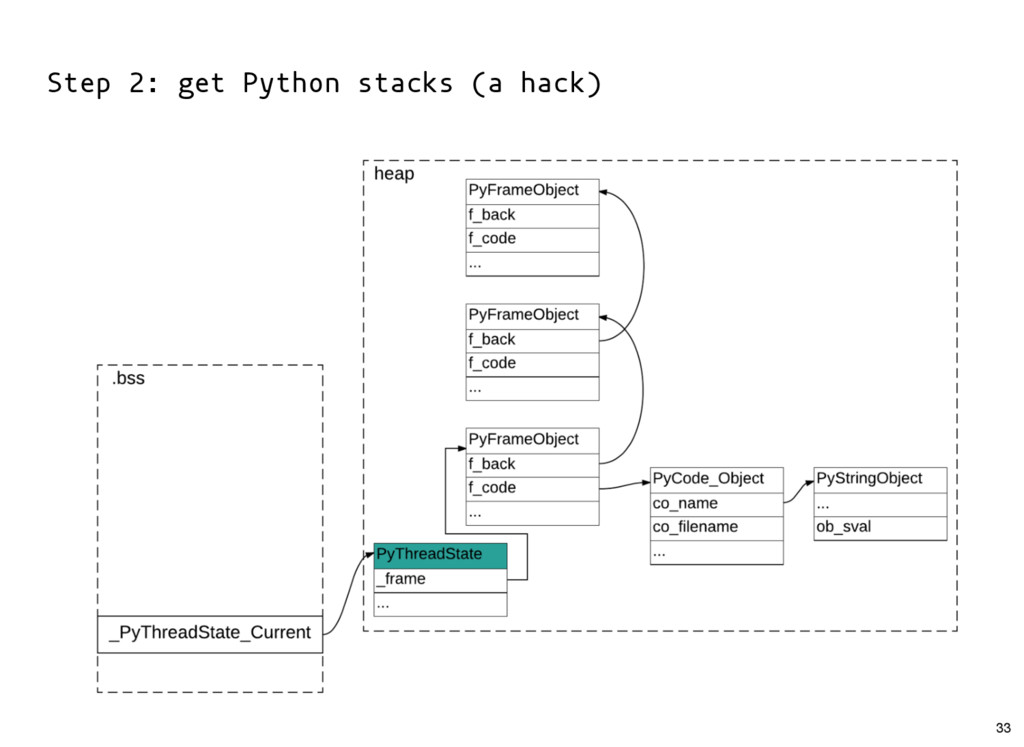
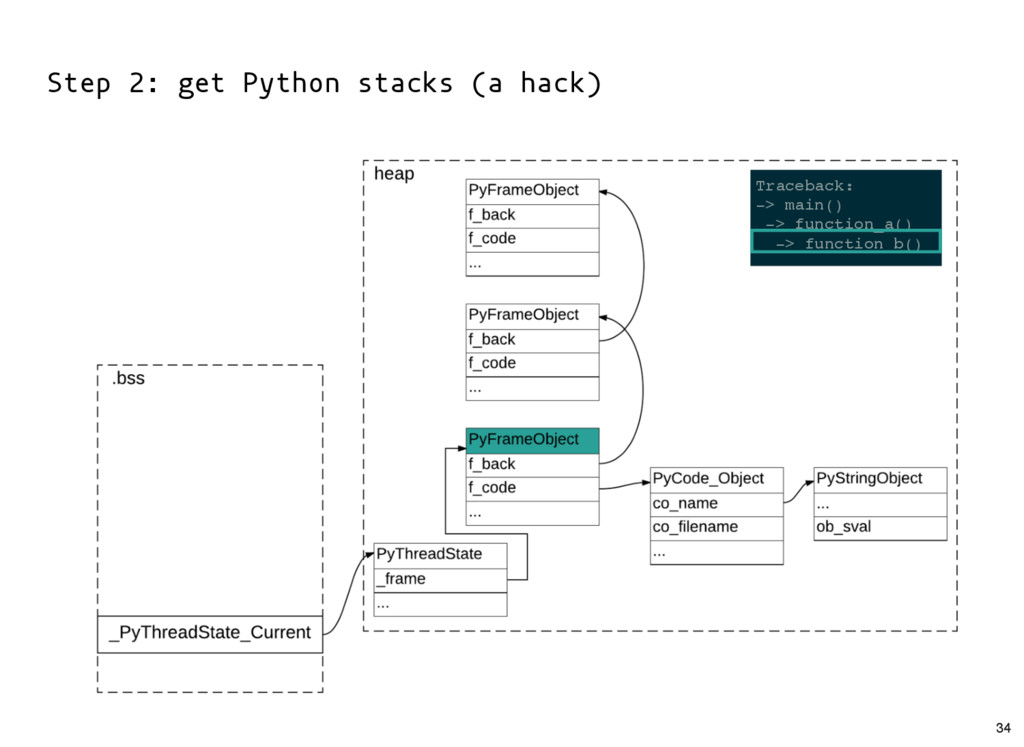
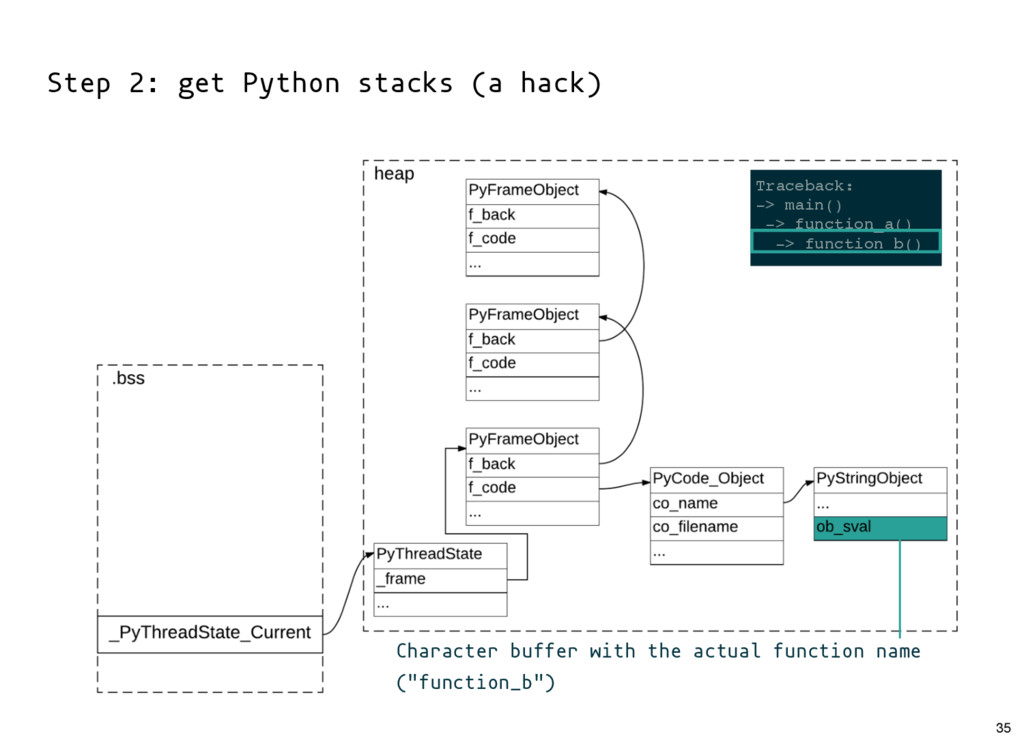
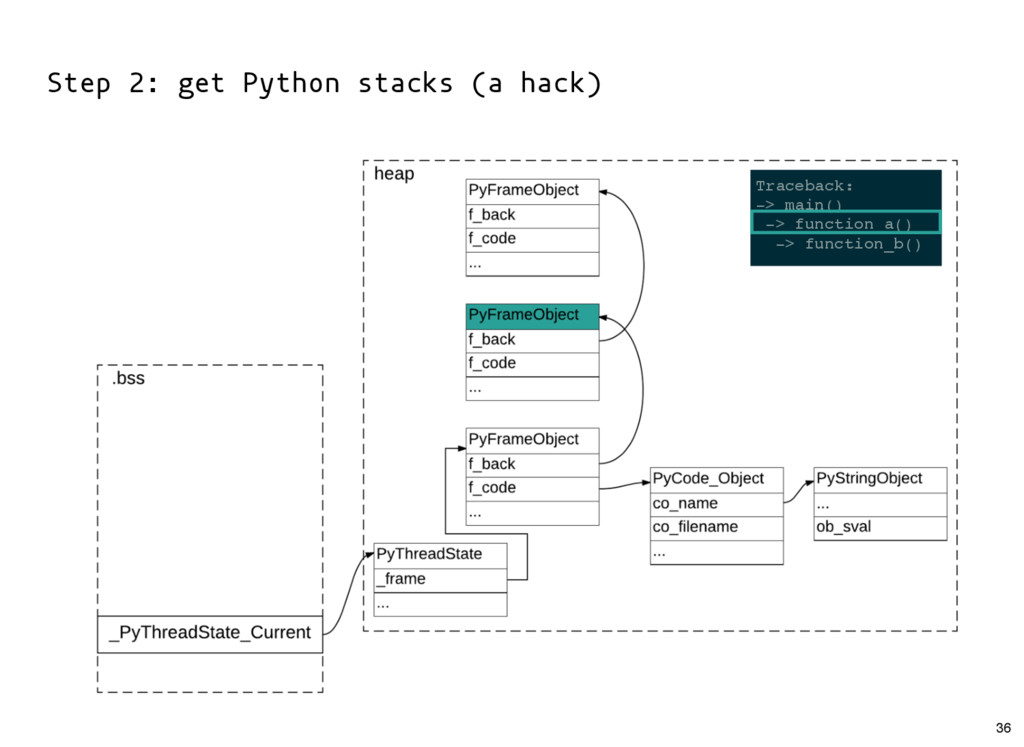
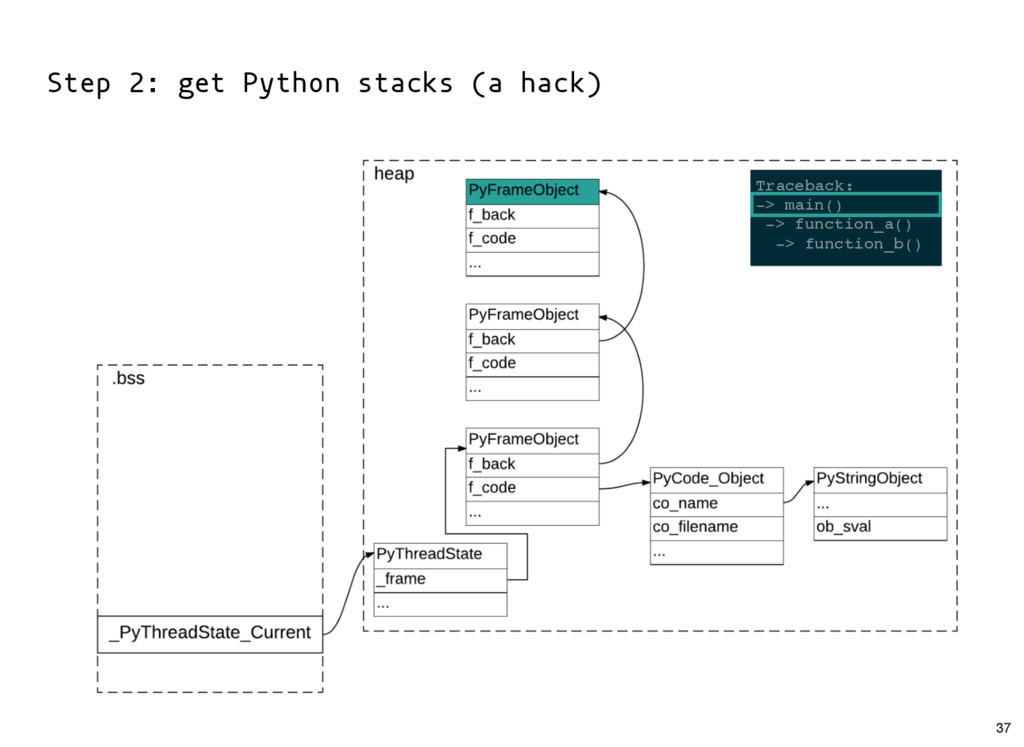
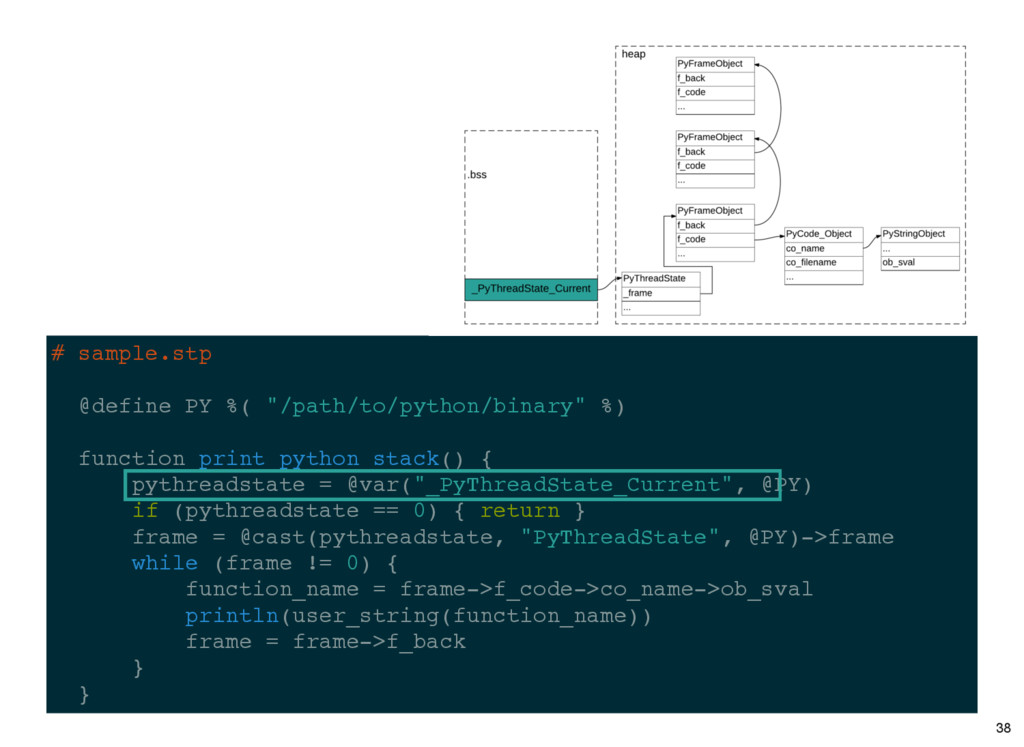
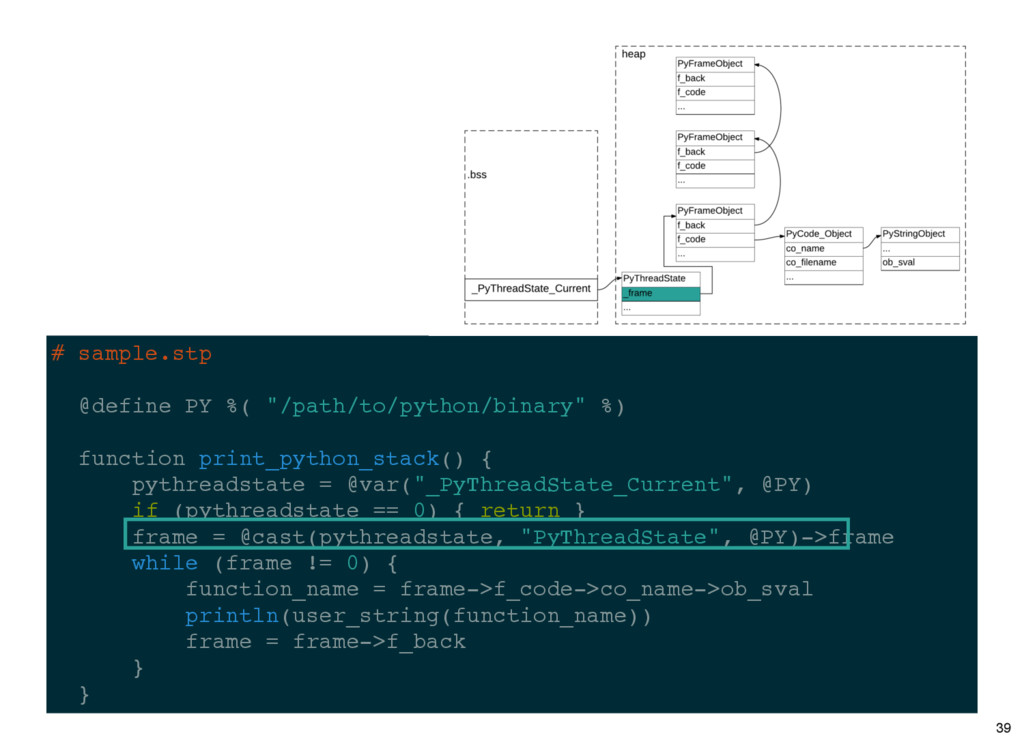
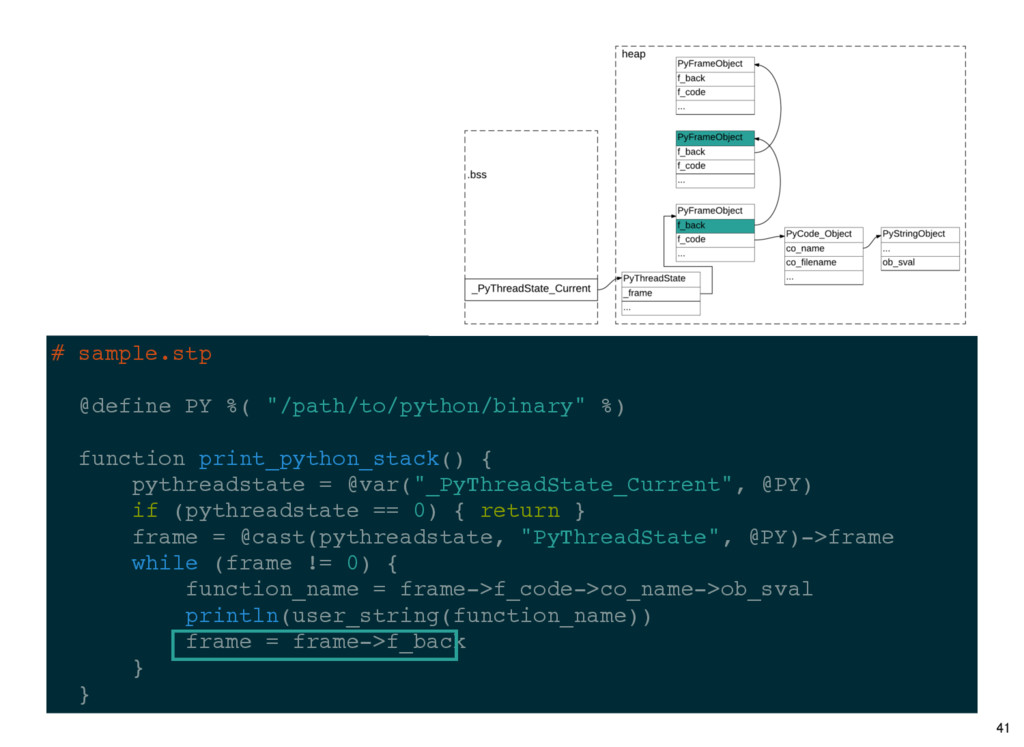
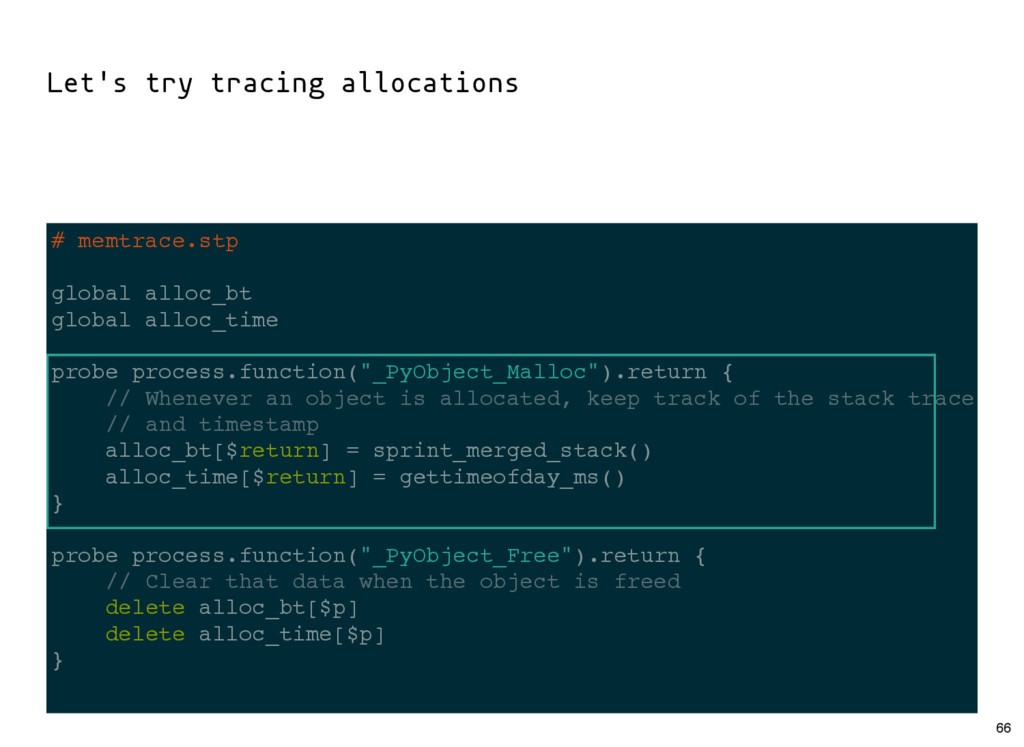
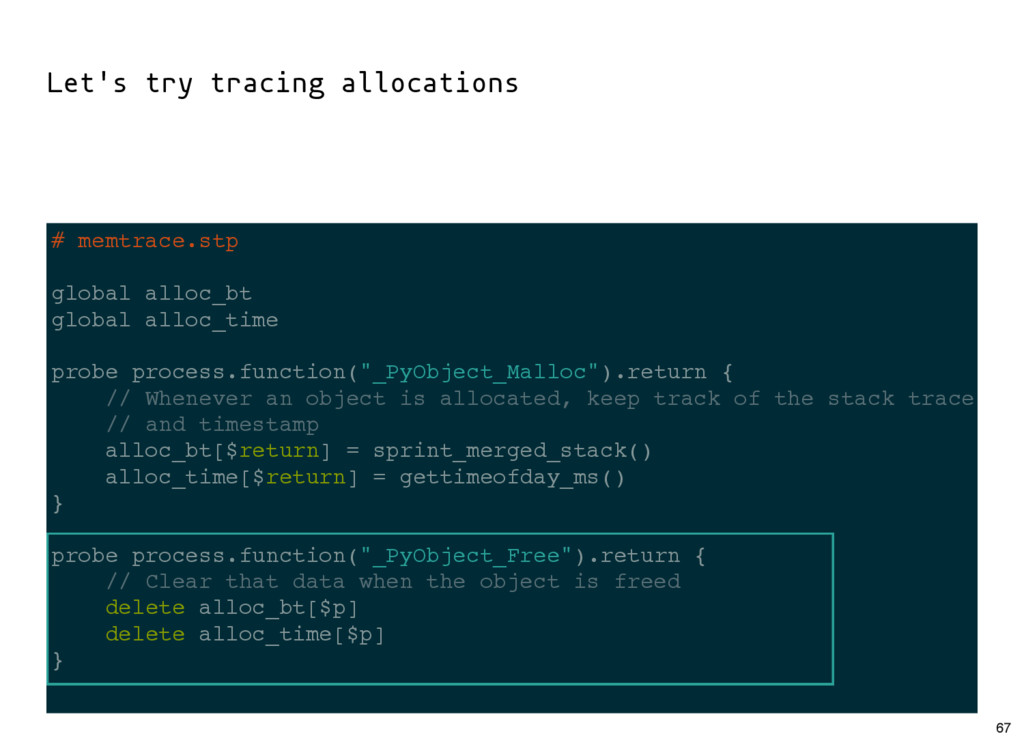
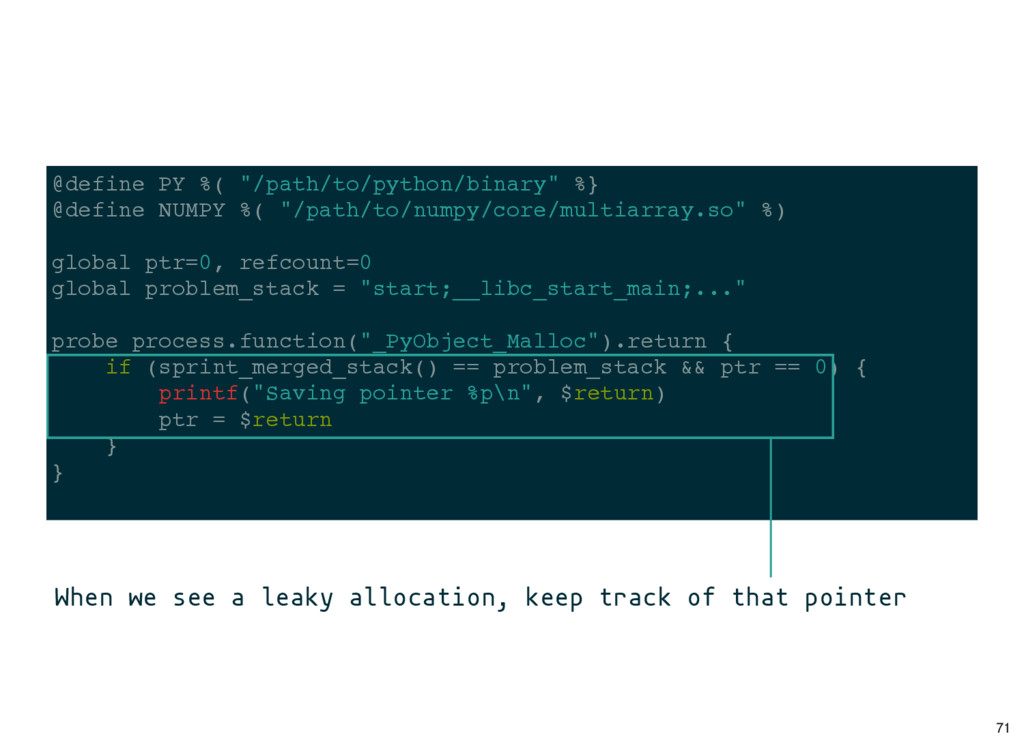
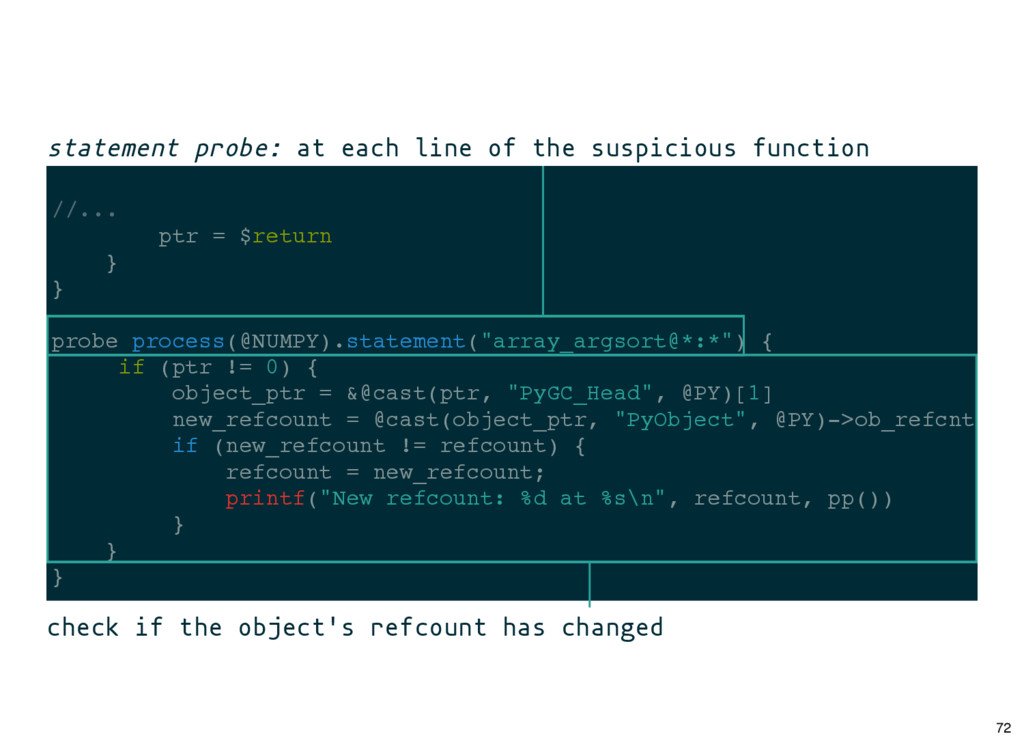
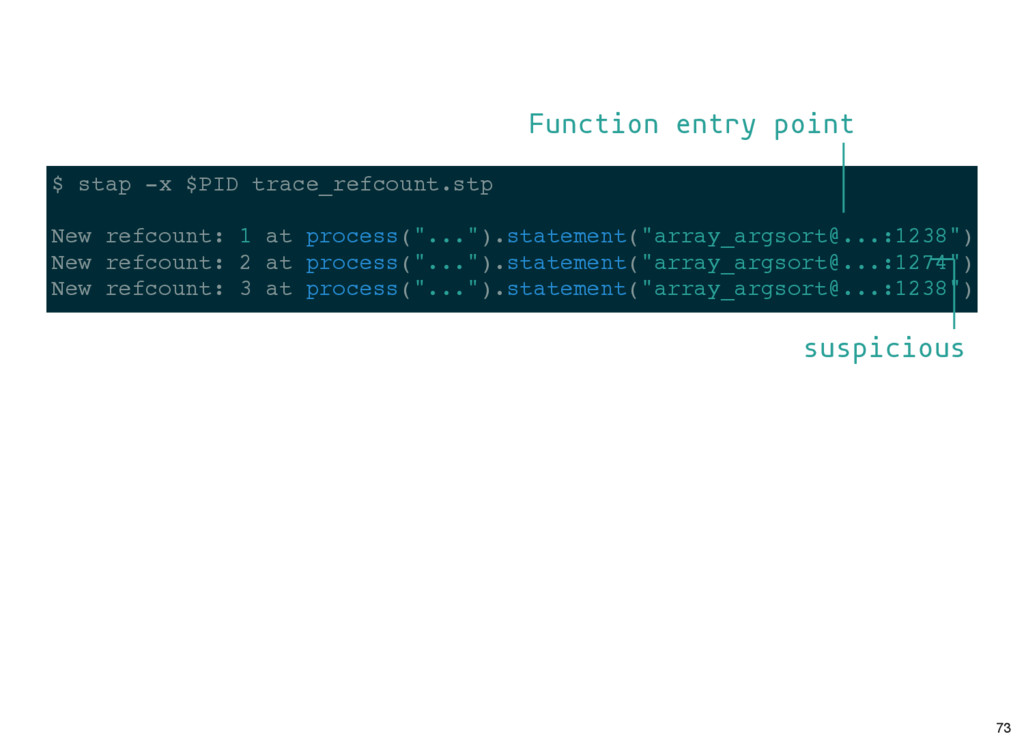
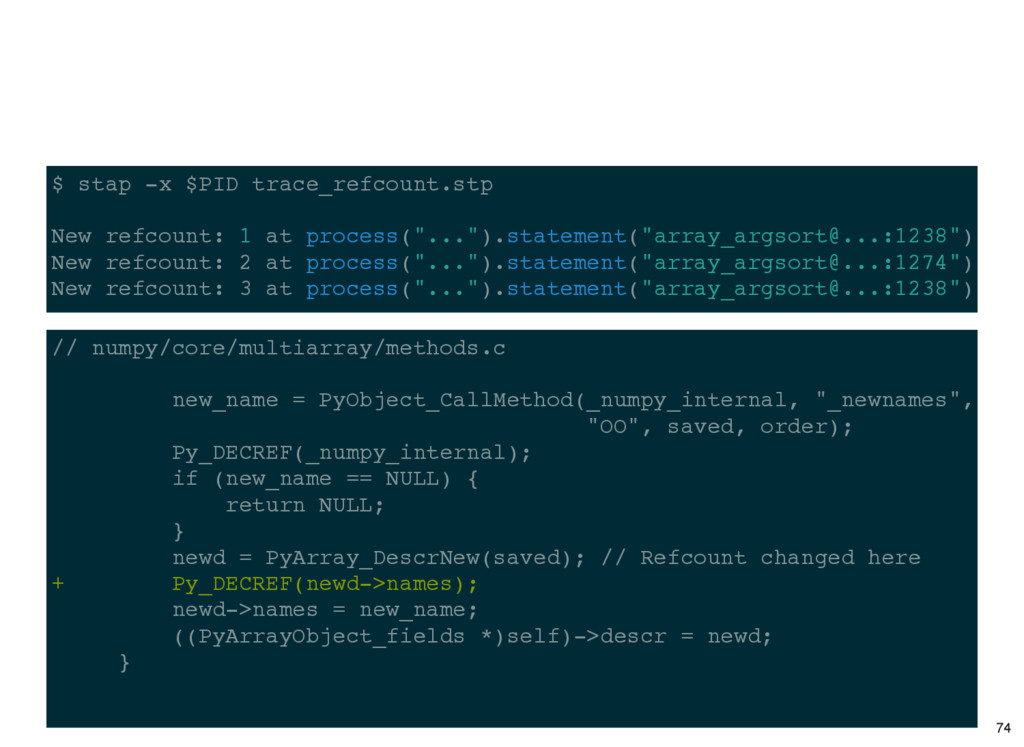
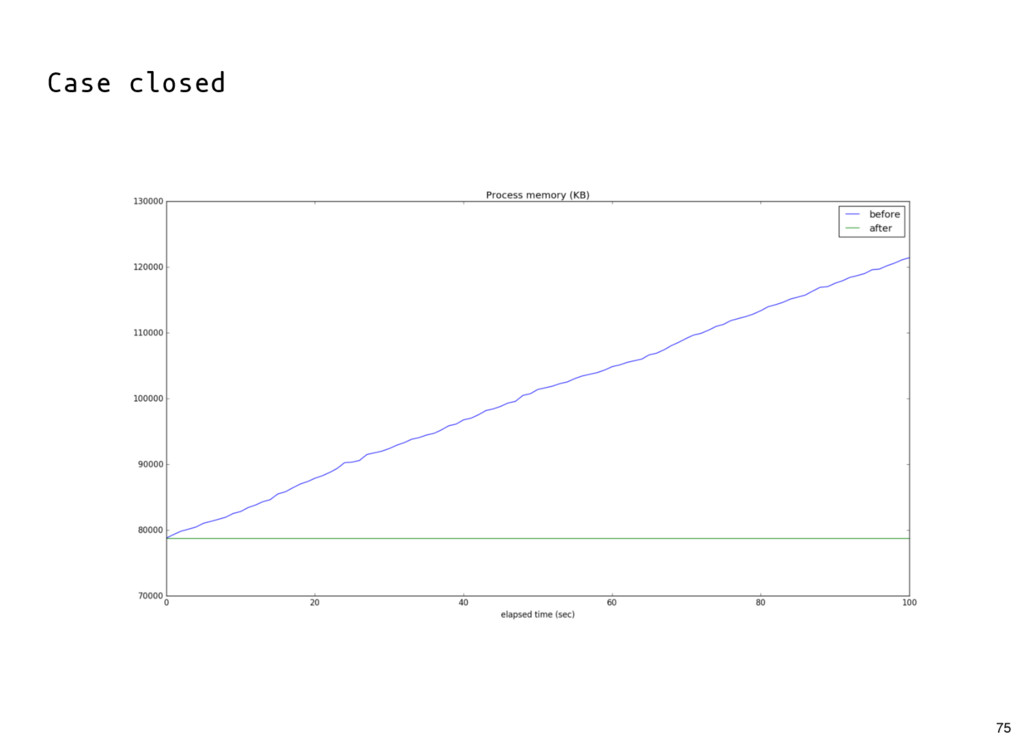
Fear not! We'll talk about how kernel tracing actually works, what tools are available, and what we need to know about the Python interpreter's internals to use them effectively. We'll see how to do mixed-mode profiling, and how to trace specific events, like memory allocations or network calls. We'll discuss some of the pros and cons of these techniques, and how they can be applied to debugging systems in other languages too.

​Bio
Eben is a software engineer based in San Francisco. He's used Python to do math research and build email infrastructure, among other things. He likes pie, and rock climbing.

PyBay

August 20, 2016
Tweet

More Decks by PyBay

Other Decks in Programming

Transcript

  1. in-process tooling >>> import pdb >>> import cProfile >>> import

    inspect >>> import tracemalloc >>> import dis >>> import ... out-of-process tooling $ gdb $ perf $ strace $ ltrace $ stap $ ... An empirical contrast How do you debug your program? add code to your program debug running programs 4
  2. Can we apply "systems" tracing tools to better understand what

    a Python program is doing, without interrupting or changing it? And a question 5
  3. In this talk - Deep dive into two case studies:

    - CPU profiling - memory leak analysis - Some low-level details along the way - Ideas for further exploration 6
  4. In this talk - Systems tools are system-dependent - We'll

    be talking about CPython on Linux - Inspiration, but not details, for other environments. 7
  5. 1. Instrument every function call - cProfile or sys.settrace() -

    often has significant overhead - generally not appropriate in production - can give distorted results In-process profiling: two common strategies 11
  6. 2. Sample the stack - record the call stack every

    n milliseconds - frequent stacks are hot code paths - generally low-overhead - many third-party implementations for Python https://github.com/joerick/pyinstrument https://github.com/bdarnell/plop https://github.com/nylas/nylas-perftools https://github.com/what-studio/profiling etc. In-process profiling: two common strategies 12
  7. import signal, traceback def sample(_, frame): # get a full

    traceback, starting from the interrupted stack frame stack = traceback.format_stack(frame) # record it somewhere record(stack) # Interpreter: Call sample() whenever we get SIGVTALRM! signal.signal(signal.SIGVTALRM, sample) # Operating system: Send the SIGVTALRM signal every 0.01 seconds! signal.setitimer(signal.ITIMER_VIRTUAL, 0.01, 0.01) A profiling workflow Sample stacks 13
  8. import signal, traceback def sample(_, frame): # get a full

    traceback, starting from the interrupted stack frame stack = traceback.format_stack(frame) # record it somewhere record(stack) # Interpreter: Call sample() whenever we get SIGVTALRM! signal.signal(signal.SIGVTALRM, sample) # Operating system: Send the SIGVTALRM signal every 0.01 seconds! signal.setitimer(signal.ITIMER_VIRTUAL, 0.01, 0.01) A profiling workflow Sample stacks 14
  9. import signal, traceback def sample(_, frame): # get a full

    traceback, starting from the interrupted stack frame stack = traceback.format_stack(frame) # record it somewhere record(stack) # Interpreter: Call sample() whenever we get SIGVTALRM! signal.signal(signal.SIGVTALRM, sample) # Operating system: Send the SIGVTALRM signal every 0.01 seconds! signal.setitimer(signal.ITIMER_VIRTUAL, 0.01, 0.01) A profiling workflow Sample stacks 15
  10. import signal, traceback def sample(_, frame): # get a full

    traceback, starting from the interrupted stack frame stack = traceback.format_stack(frame) # record it somewhere record(stack) # Interpreter: Call sample() whenever we get SIGVTALRM! signal.signal(signal.SIGVTALRM, sample) # Operating system: Send the SIGVTALRM signal every 0.01 seconds! signal.setitimer(signal.ITIMER_VIRTUAL, 0.01, 0.01) A profiling workflow Sample stacks 16
  11. { "execute;__call__;wsgi_app;full_dispatch_request;dispatch_request;route;<lambda>": 690, "execute;__call__;wsgi_app;full_dispatch_request;dispatch_request": 30, "execute;write;send_response;log_request;log;_log;info;_log;handle;callHandlers": 11, "execute;write;send_response": 10, "execute;write;send_response;log_request;log;_log;info;_log;handle":

    1, "execute;__call__;wsgi_app;auto_pop;pop;pop;do_teardown_appcontext": 1, "execute;__call__;wsgi_app;request_context;__init__;create_url_adapter": 2, "execute;__call__;wsgi_app;full_dispatch_request;dispatch_request;route": 1, stack count A profiling workflow Sample stacks Aggregate 17
  12. # MySQLdb/cursors.py def _fetch_row(self, size=1): if not self._result: return ()

    return self._result.fetch_row(size, self._fetch_type) ruh roh! this is implemented in a C extension our profiler has no visibility into it 22
  13. Python call stack C call stack visible internally visible externally

    An inconvenient dichotomy >>> traceback.format_stack() $ gdb -p $PID -ex bt --batch $ perf record -p $PID here's that C extension code 23
  14. An inconvenient dichotomy It would be really nice if we

    could sample both of these call stacks at once, and have a full picture of what's going on. Maybe we can use one of those systems tools. Let's try. 24
  15. Take 1: gdb $ gdb -p $PID -ex bt --batch

    #0 0x000000000047fe34 in lookdict_string (mp=0x7ffff7f64be8, key='True' hash=-1504860438477502276) at ../Objects/dictobject.c:430 #1 0x00000000005241b4 in PyEval_EvalFrameEx ( f=Frame 0x7ffff7f477c0, for file script.py, line 2, in f (), throwfl at ../Python/ceval.c:2107 #2 0x000000000052bcb7 in fast_function (func=<function at remote 0x7fff pp_stack=0x7fffffffdda0, n=0, na=0, nk=0) at ../Python/ceval.c:4119 #3 0x000000000052b9ca in call_function (pp_stack=0x7fffffffdda0, oparg= at ../Python/ceval.c:4054 #4 0x00000000005266ca in PyEval_EvalFrameEx ( f=Frame 0x7ffff7f475e8, for file script.py, line 6, in g (), throwfl at ../Python/ceval.c:2679 includes Python context (if gdb extensions are installed) Just run this in a loop to get a sample set. more: poormansprofiler.org 25
  16. Take 1: gdb Problem: slows down program by ~3x at

    10Hz sample rate $ gdb -p $PID -ex bt --batch #0 0x000000000047fe34 in lookdict_string (mp=0x7ffff7f64be8, key='True' hash=-1504860438477502276) at ../Objects/dictobject.c:430 #1 0x00000000005241b4 in PyEval_EvalFrameEx ( f=Frame 0x7ffff7f477c0, for file script.py, line 2, in f (), throwfl at ../Python/ceval.c:2107 #2 0x000000000052bcb7 in fast_function (func=<function at remote 0x7fff pp_stack=0x7fffffffdda0, n=0, na=0, nk=0) at ../Python/ceval.c:4119 #3 0x000000000052b9ca in call_function (pp_stack=0x7fffffffdda0, oparg= at ../Python/ceval.c:4054 #4 0x00000000005266ca in PyEval_EvalFrameEx ( f=Frame 0x7ffff7f475e8, for file script.py, line 6, in g (), throwfl at ../Python/ceval.c:2679 Can we do better? 26
  17. Take 2: SystemTap SystemTap is a toolkit and scripting language

    for dynamic instrumentation. - You write a script specifying probe points and handlers, e.g. probe nd_syscall.open { printf("%d %s\n", pid(), filename()) } // Every time a process opens a file, print the PID and filename - SystemTap compiles this into C and loads it as a kernel module. - Can be challenging to use, but very powerful. - less overhead for this use case than gdb, which uses the ptrace API. sourceware.org/systemtap/ 27
  18. Some caveats You need - "stapusr" privileges - a fairly

    recent Linux kernel - debuginfo in your Python binary But once you have this, you can do a lot of cool stuff! 28
  19. $ stap -x $PID \ # We only care about

    our Python process -e "probe perf.sw.task_clock.process # at every tick of its process clock { print_ubacktrace() }" # print a userspace backtrace Step 1: get C stacks 29
  20. $ stap -x $PID \ # We only care about

    our Python process -e "probe perf.sw.task_clock.process # at every tick of its process clock { print_ubacktrace() }" # print a userspace backtrace 0x46d1ad : lookdict_unicode_nodummy+0x4d/0x370 [/usr/bin/python3] 0x46f544 : PyDict_GetItem+0xe4/0x130 [/usr/bin/python3] 0x47e108 : PyObject_GenericGetAttr+0x128/0x240 [/usr/bin/python3] 0x47a8b8 : module_getattro+0x18/0xb0 [/usr/bin/python3] 0x4ef34f : PyEval_EvalFrameEx+0x36df/0x9470 [/usr/bin/python3] 0x4f59f7 : _PyEval_EvalCodeWithName+0x907/0x9c0 [/usr/bin/python3] 0x4f5ad2 : PyEval_EvalCodeEx+0x22/0x30 [/usr/bin/python3] 0x5a4805 : function_call+0x95/0x1b0 [/usr/bin/python3] 0x439713 : PyObject_Call+0x73/0x1b0 [/usr/bin/python3] 0x43ac07 : PyObject_CallFunctionObjArgs+0x187/0x230 [/usr/bin/python3] 0x459842 : listsort+0x152/0xb00 [/usr/bin/python3] 0x5a9f81 : PyCFunction_Call+0xf1/0x160 [/usr/bin/python3] 0x439713 : PyObject_Call+0x73/0x1b0 [/usr/bin/python3] . . . Step 1: get C stacks 30
  21. Step 2: get Python stacks Challenge: Python stack frames are

    represented by objects... somewhere in the interpreter heap. Let's find them! 31
  22. Step 2: get Python stacks (a hack) Traceback: -> main()

    -> function_a() -> function_b() 34
  23. Step 2: get Python stacks (a hack) Character buffer with

    the actual function name ("function_b") Traceback: -> main() -> function_a() -> function_b() 35
  24. Step 2: get Python stacks (a hack) Traceback: -> main()

    -> function_a() -> function_b() 36
  25. Step 2: get Python stacks (a hack) Traceback: -> main()

    -> function_a() -> function_b() 37
  26. # sample.stp @define PY %( "/path/to/python/binary" %) function print_python_stack() {

    pythreadstate = @var("_PyThreadState_Current", @PY) if (pythreadstate == 0) { return } frame = @cast(pythreadstate, "PyThreadState", @PY)->frame while (frame != 0) { function_name = frame->f_code->co_name->ob_sval println(user_string(function_name)) frame = frame->f_back } } 38
  27. # sample.stp @define PY %( "/path/to/python/binary" %) function print_python_stack() {

    pythreadstate = @var("_PyThreadState_Current", @PY) if (pythreadstate == 0) { return } frame = @cast(pythreadstate, "PyThreadState", @PY)->frame while (frame != 0) { function_name = frame->f_code->co_name->ob_sval println(user_string(function_name)) frame = frame->f_back } } 39
  28. # sample.stp @define PY %( "/path/to/python/binary" %) function print_python_stack() {

    pythreadstate = @var("_PyThreadState_Current", @PY) if (pythreadstate == 0) { return } frame = @cast(pythreadstate, "PyThreadState", @PY)->frame while (frame != 0) { function_name = frame->f_code->co_name->ob_sval println(user_string(function_name)) frame = frame->f_back } } 40
  29. # sample.stp @define PY %( "/path/to/python/binary" %) function print_python_stack() {

    pythreadstate = @var("_PyThreadState_Current", @PY) if (pythreadstate == 0) { return } frame = @cast(pythreadstate, "PyThreadState", @PY)->frame while (frame != 0) { function_name = frame->f_code->co_name->ob_sval println(user_string(function_name)) frame = frame->f_back } } 41
  30. $ stap -x $PID sample.stp _fetch_row _post_get_result _query execute fetch_data

    burrito_finder_api dispatch_request full_dispatch_request wsgi_app __call__ execute run_wsgi handle_one_request handle handle __init__ finish_request process_request _handle_request_noblock Step 2: get Python stacks (but it works!) 42
  31. Python call stack C call stack Step 3: glue them

    together Every Python stack frame corresponds to a call to PyEval_EvalFrameEx on the C call stack. 43
  32. Drilling down Let's trace a single execution of this function

    to better understand what's going on 49
  33. Drilling down We'll use function entry and return probe points

    to build an execution timeline. These use a kernel facility called uprobes - basically an API to insert software breakpoints at a userspace instruction address, then execute a handler when the breakpoint gets hit. https://www.google.com/patents/US20080133896 50
  34. Drilling down # trace-callgraph.stp function trace(is_entry) { if (tracing) {

    if (is_entry) { // print "-> my_func" on entry into function my_func() println("-> " . ppfunc()) } else { // print "<- my_func" on return from function my_func() println("<- " . ppfunc()) } // Start tracing whenever a trigger function // (passed as script argument) is called probe process.function(@1).call { tracing = 1 } probe process.function(@1).return { tracing = 0 } probe process.function("*").call { trace(1) } probe process.function("*").return { trace(-1) } 51
  35. Drilling down # trace-callgraph.stp function trace(is_entry) { if (tracing) {

    if (is_entry) { // print "-> my_func" on entry into function my_func() println("-> " . ppfunc()) } else { // print "<- my_func" on return from function my_func() println("<- " . ppfunc()) } // Start tracing whenever a trigger function // (passed as script argument) is called probe process.function(@1).call { tracing = 1 } probe process.function(@1).return { tracing = 0 } probe process.function("*").call { trace(1) } probe process.function("*").return { trace(-1) } 52
  36. Drilling down # trace-callgraph.stp function trace(is_entry) { if (tracing) {

    if (is_entry) { // print "-> my_func" on entry into function my_func() println("-> " . ppfunc()) } else { // print "<- my_func" on return from function my_func() println("<- " . ppfunc()) } // Start tracing whenever a trigger function // (passed as script argument) is called probe process.function(@1).call { tracing = 1 } probe process.function(@1).return { tracing = 0 } // Then trace all function entry / exits probe process.function("*").call { trace(1) } probe process.function("*").return { trace(-1) } 53
  37. Drilling down # trace-callgraph.stp function trace(is_entry) { if (tracing) {

    if (is_entry) { // print "-> my_func" on entry into function my_func() println("-> " . ppfunc()) } else { // print "<- my_func" on return from function my_func() println("<- " . ppfunc()) } // Start tracing whenever a trigger function // (passed as script argument) is called probe process.function(@1).call { tracing = 1 } probe process.function(@1).return { tracing = 0 } // Then trace all function entry / exits probe process.function("*").call { trace(1) } probe process.function("*").return { trace(-1) } 54
  38. Drilling down $ stap -x $PID trace-callgraph.stp 0 ->_mysql_row_to_tuple 6

    ->PyTuple_New 10 <-PyTuple_New 13 ->PyObject_CallFunction 17 ->Py_VaBuildValue 21 ->do_mkvalue 25 ->PyBytes_FromStringAndSize 29 ->PyObject_Malloc 33 ->_PyObject_Malloc 37 <-_PyObject_Malloc 38 <-PyObject_Malloc 40 <-PyBytes_FromStringAndSize 42 <-do_mkvalue 44 <-Py_VaBuildValue 46 ->PyTuple_New 49 <-PyTuple_New 51 ->PyObject_Call 55 ->function_call 59 ->PyEval_EvalCodeEx 63 ->_PyEval_EvalCodeWithName 55
  39. // mysqlclient/_mysql.c static PyObject * _mysql_field_to_python(PyObject *converter, char *rowitem, unsigned

    long len, MYSQL_FIELD *field) { PyObject *v; if (converter != Py_None) { v = PyObject_CallFunction(converter, "s#", rowitem, (int)len)); } else { v = PyBytes_FromStringAndSize(rowitem, (int)len); } // ... if rowitem is a string-encoded float ("2.2718") Then this turns rowitem into a Python string, then calls float() on it Here, the database driver is turning raw character buffers from the database into Python objects. 59
  40. // proof-of-concept patch static PyObject * _mysql_field_to_python(PyObject *converter, char *rowitem,

    unsigned long len, MYSQL_FIELD *field) { PyObject *v; - if (converter != Py_None) { + if (field_type == FIELD_TYPE_FLOAT) { + v = PyFloat_FromDouble(strtod(rowitem, NULL)); + } else if (converter != Py_None) { v = PyObject_CallFunction(converter, "s#", rowitem, (int)len); } else { v = PyBytes_FromStringAndSize(rowitem, (int)len); } // ... Result: ~15% more requests served per second Let's do that conversion in C 60
  41. We were able to go all the way from an

    aggregate view of our application's hotspots, down to the execution profile of a single extension function, without needing to stop or change our application. 61
  42. 63

  43. import numpy as np while True: names = ['field{}'.format(i) for

    i in range(200)] dt = np.dtype({"names": names, "formats": 200 * [np.uint8]}) array = np.zeros((1000,), dt) sortedIndices = np.argsort(array, order='field0') The problem script "calling argsort() on a structured array creates a leak" We'll just let this run in the background while we trace it. 64
  44. # memtrace.stp global alloc_bt global alloc_time probe process.function("_PyObject_Malloc").return { //

    Whenever an object is allocated, keep track of the stack trace // and timestamp alloc_bt[$return] = sprint_merged_stack() alloc_time[$return] = gettimeofday_ms() } probe process.function("_PyObject_Free").return { // Clear that data when the object is freed delete alloc_bt[$p] delete alloc_time[$p] } Let's try tracing allocations 65
  45. # memtrace.stp global alloc_bt global alloc_time probe process.function("_PyObject_Malloc").return { //

    Whenever an object is allocated, keep track of the stack trace // and timestamp alloc_bt[$return] = sprint_merged_stack() alloc_time[$return] = gettimeofday_ms() } probe process.function("_PyObject_Free").return { // Clear that data when the object is freed delete alloc_bt[$p] delete alloc_time[$p] } Let's try tracing allocations 66
  46. # memtrace.stp global alloc_bt global alloc_time probe process.function("_PyObject_Malloc").return { //

    Whenever an object is allocated, keep track of the stack trace // and timestamp alloc_bt[$return] = sprint_merged_stack() alloc_time[$return] = gettimeofday_ms() } probe process.function("_PyObject_Free").return { // Clear that data when the object is freed delete alloc_bt[$p] delete alloc_time[$p] } Let's try tracing allocations 67
  47. _start __libc_start_main main Py_Main PyRun_SimpleFileExFlags PyRun_FileExFlags PyEval_EvalCode _PyEval_EvalCodeWithName <module>(leak.py) PyObject_Call

    type_call arraydescr_new PyArray_DescrConverter _convert_from_dict PySequence_Tuple PyList_AsTuple PyTuple_New _PyObject_GC_NewVar Let's run the test case in the background, and trace for ~30 seconds. If we take the output and graph "surviving allocations over time" ... okay, looks leaky. 68
  48. _start __libc_start_main main Py_Main PyRun_SimpleFileExFlags PyRun_FileExFlags PyEval_EvalCode _PyEval_EvalCodeWithName <module>(leak.py) PyObject_Call

    type_call arraydescr_new PyArray_DescrConverter _convert_from_dict PySequence_Tuple PyList_AsTuple PyTuple_New _PyObject_GC_NewVar This is in C extension code -- likely caused by a missing call to Py_DECREF. Can we figure out where that call should go? 69
  49. import numpy as np while True: names = ['field{}'.format(i) for

    i in range(200)] # find a leaky allocation here dt = np.dtype({"names": names, "formats": 200 * [np.uint8]}) array = np.zeros((1000,), dt) # track its refcount as this function executes sortedIndices = np.argsort(array, order='field0') The problem script "calling argsort() on a structured array creates a leak" 70
  50. @define PY %( "/path/to/python/binary" %} @define NUMPY %( "/path/to/numpy/core/multiarray.so" %)

    global ptr=0, refcount=0 global problem_stack = "start;__libc_start_main;..." probe process.function("_PyObject_Malloc").return { if (sprint_merged_stack() == problem_stack && ptr == 0) { printf("Saving pointer %p\n", $return) ptr = $return } } When we see a leaky allocation, keep track of that pointer 71
  51. //... ptr = $return } } probe process(@NUMPY).statement("array_argsort@*:*") { if

    (ptr != 0) { object_ptr = &@cast(ptr, "PyGC_Head", @PY)[1] new_refcount = @cast(object_ptr, "PyObject", @PY)->ob_refcnt if (new_refcount != refcount) { refcount = new_refcount; printf("New refcount: %d at %s\n", refcount, pp()) } } } check if the object's refcount has changed statement probe: at each line of the suspicious function 72
  52. $ stap -x $PID trace_refcount.stp New refcount: 1 at process("...").statement("array_argsort@...:1238")

    New refcount: 2 at process("...").statement("array_argsort@...:1274") New refcount: 3 at process("...").statement("array_argsort@...:1238") Function entry point suspicious 73
  53. $ stap -x $PID trace_refcount.stp New refcount: 1 at process("...").statement("array_argsort@...:1238")

    New refcount: 2 at process("...").statement("array_argsort@...:1274") New refcount: 3 at process("...").statement("array_argsort@...:1238") // numpy/core/multiarray/methods.c new_name = PyObject_CallMethod(_numpy_internal, "_newnames", "OO", saved, order); Py_DECREF(_numpy_internal); if (new_name == NULL) { return NULL; } newd = PyArray_DescrNew(saved); // Refcount changed here + Py_DECREF(newd->names); newd->names = new_name; ((PyArrayObject_fields *)self)->descr = newd; } 74
  54. Wrapping up Those were just two examples of using one

    tool. Other things you could do: - Show a live latency histogram for a particular function in your code - Correlate your application's behavior with network or other system activity - Whatever you come up with. 76
  55. Wrapping up This strategy has tradeoffs! Pros: - Enables interactive/dynamic

    instrumentation of running programs - Can show lots of low-level detail - Language-agnostic: can be applied to debug other parts of your stack as well. Cons: - Steep learning curve - Some initial setup cost 77
  56. Wrapping up Can we apply "systems" tracing tools to better

    understand what a Python program is doing? 78
  57. The road ahead Lots of room for improvement! - documentation,

    best practices, wrapper scripts (github.com/emfree/systemtap-python-tools) - standalone/userspace tools for out-of-process profiling, etc. (github.com/eklitzke/pystack, github.com/jvns/ruby-stacktrace) - interpreter support for external tracers 80
  58. What about PyPy? (Pyston, ...) - I don't have much

    firsthand experience :( - github.com/vmprof/vmprof-python was built to profile PyPy, including JIT introspection. - Linux `perf` supports JITted runtimes like Node.js and Java if they write a symbol map to /tmp/perf-PID.map. PyPy could do that too. 83
  59. What about other OSes? - OS X and some others

    have DTrace (similar to SystemTap) - Others: I don't know. Sorry :( 84
  60. What about runtime code injection? - Pyrasite, socketconsole, etc. -

    Can be useful - Definitely easier to use for some debugging - Kind of scares me - Still can't get really low level detail 85
  61. Performance engineering lessions - Know your interpreter! - Play with

    power [debugging] tools! - Build visualizations! 86