Description
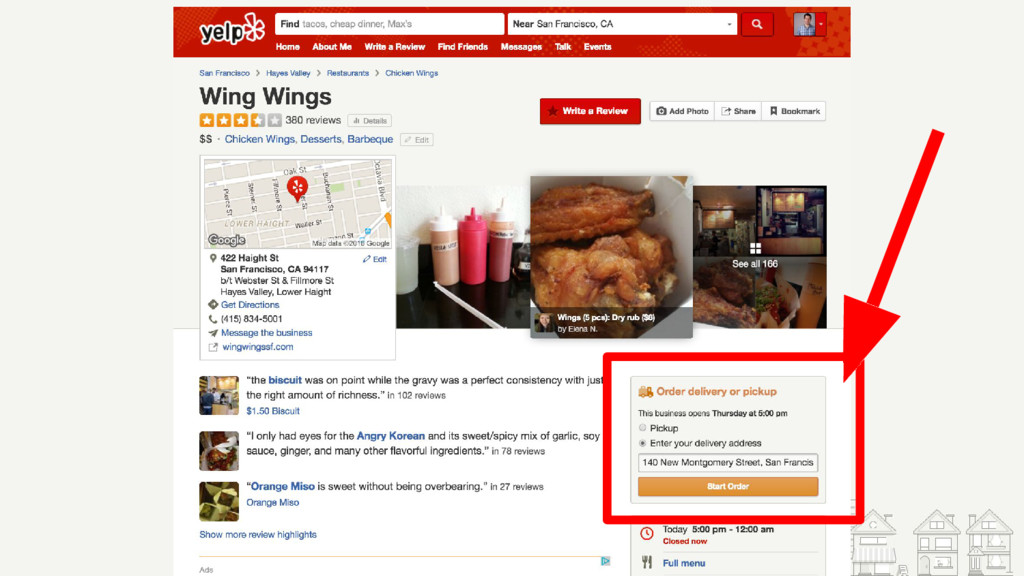
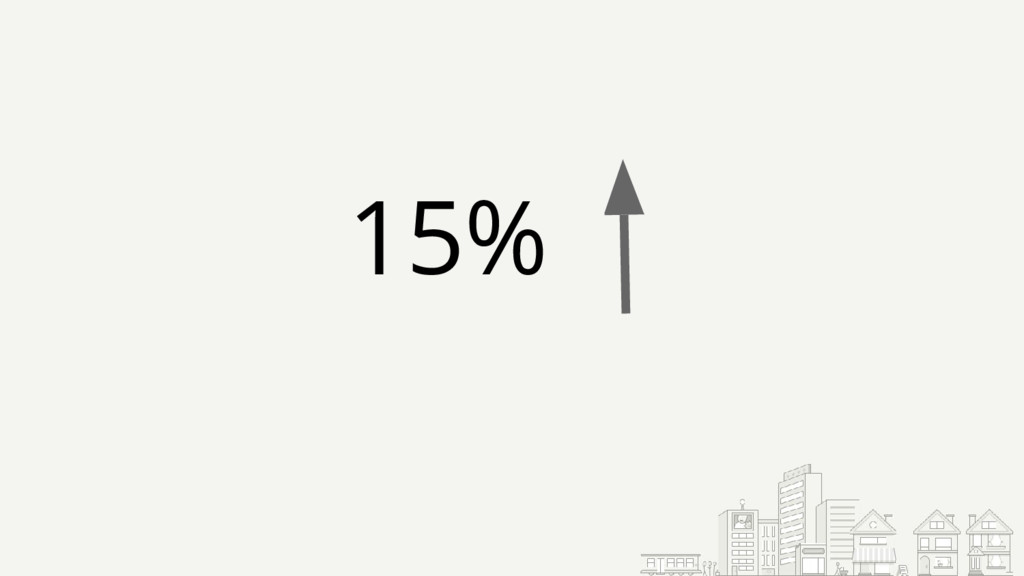
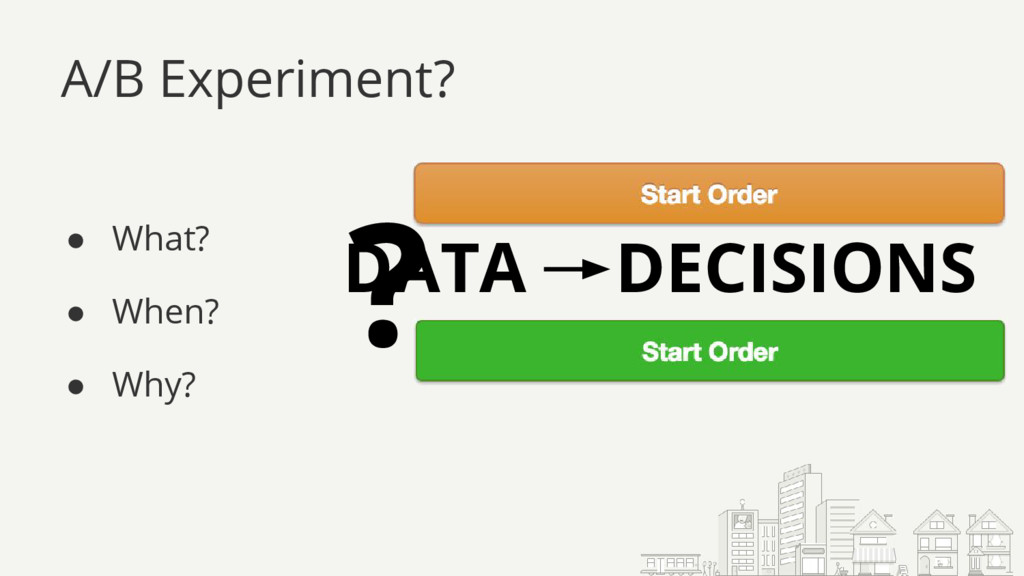
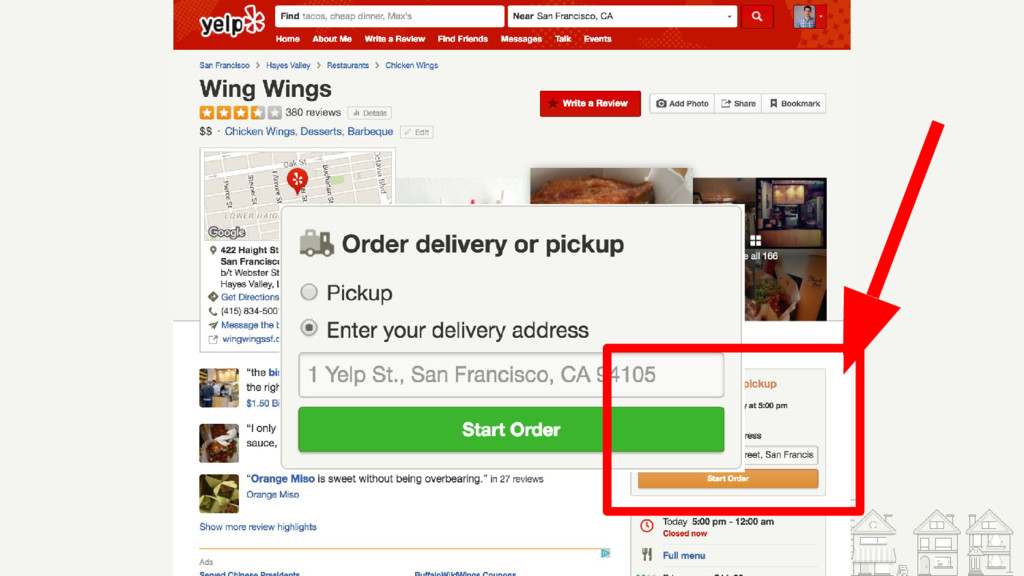
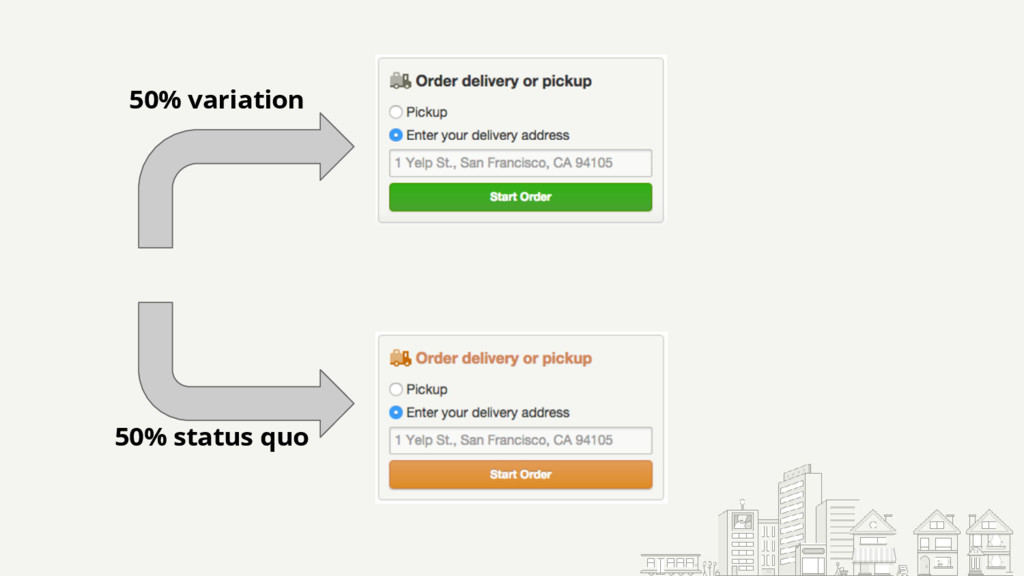
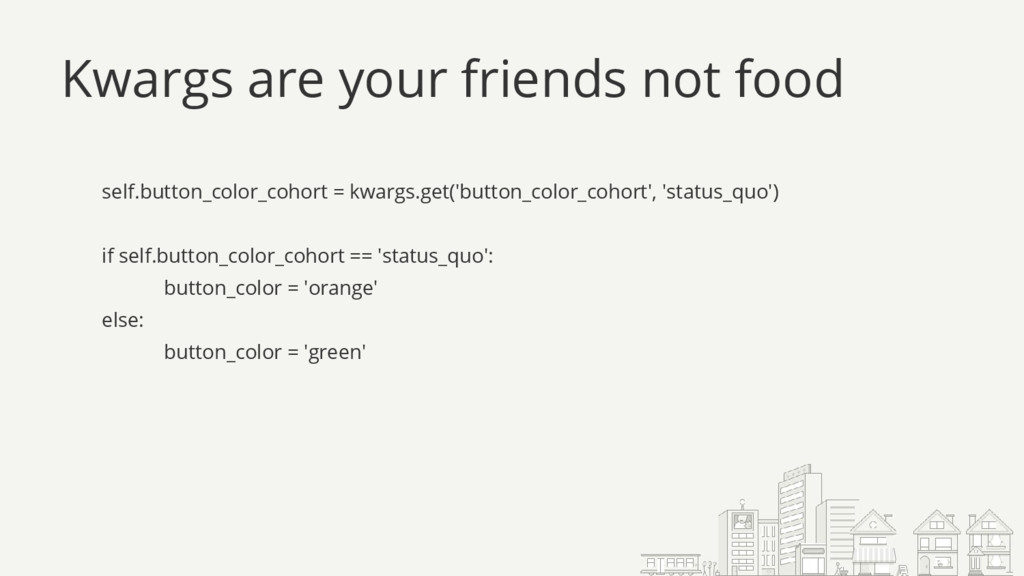
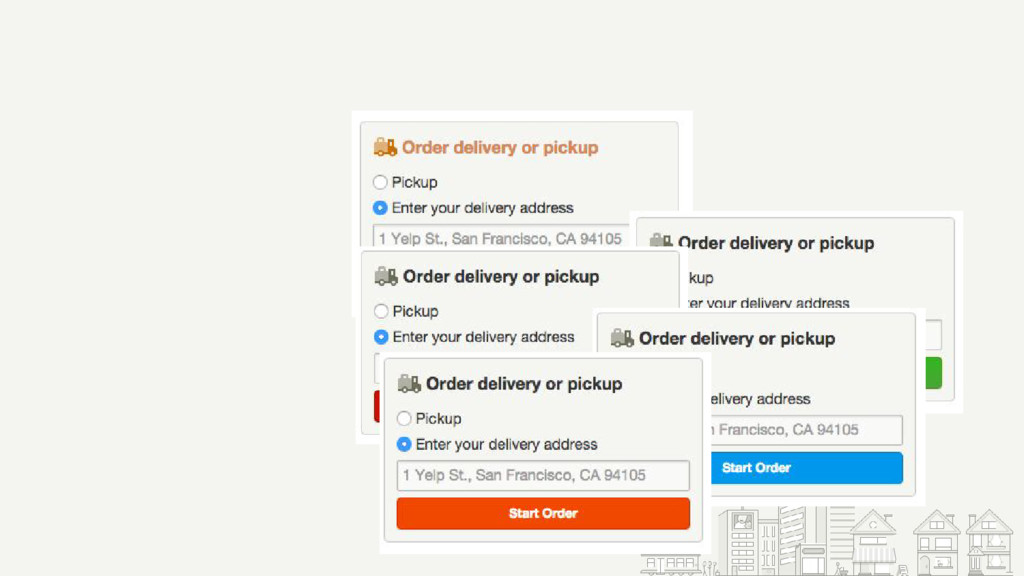
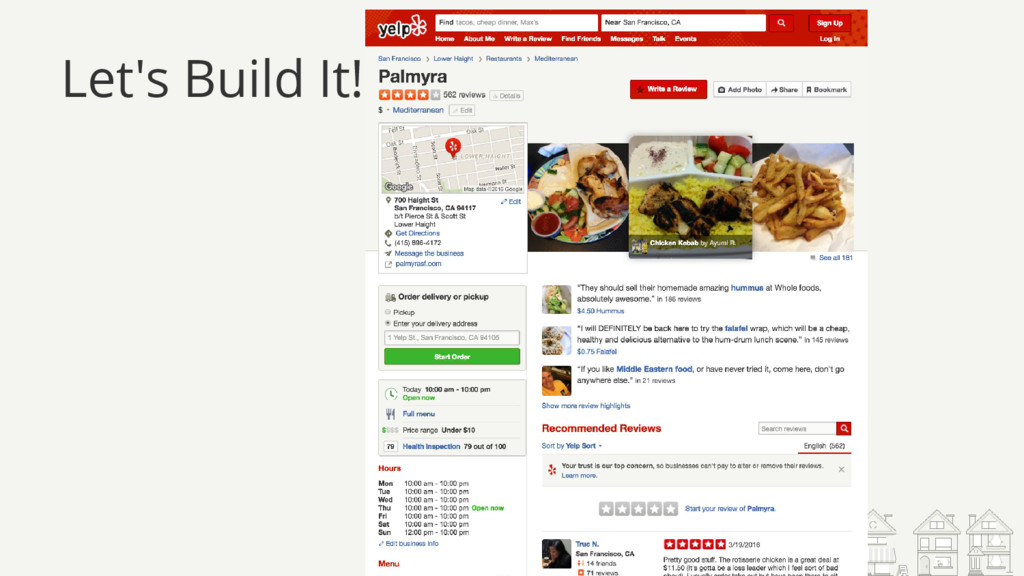
Is your Product Manager asking you to test out different text or button colors? Not sure where to start? This talk will contain methodology and two case studies from Yelp’s Transaction Platform on how to properly run an experiment and get the best result. Learn about how to run a simple button color experiment, avoid pitfalls, test, and analyze the results with confidence. Statistical confidence!
Abstract
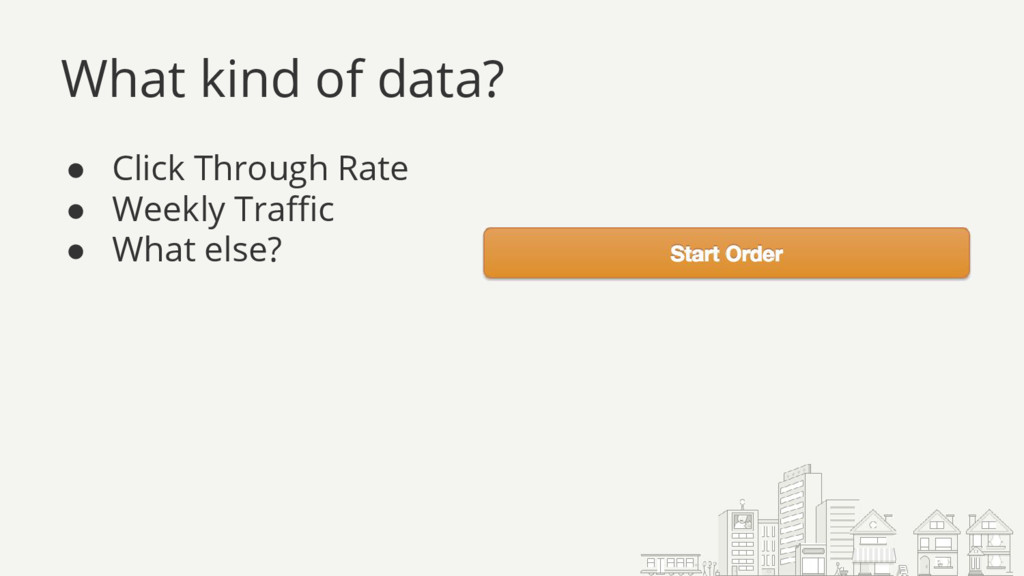
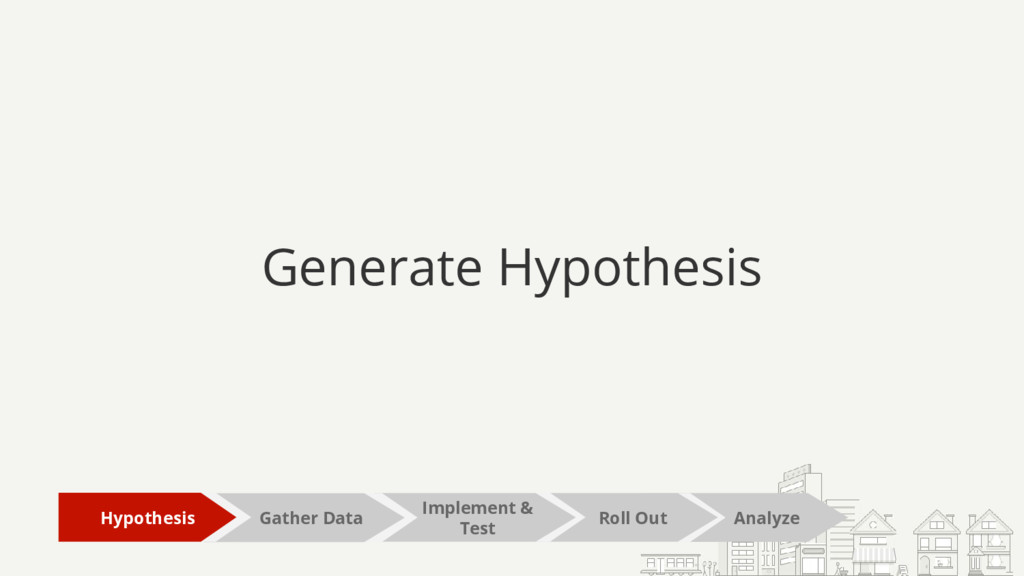
A/B testing is a common practice for websites...but where do you begin? This data-driven approach allows you to launch experiments and features with confidence. So how do you prepare, launch, and analyze an A/B experiment? How do you know for how long to keep it running? What about which metrics to track?
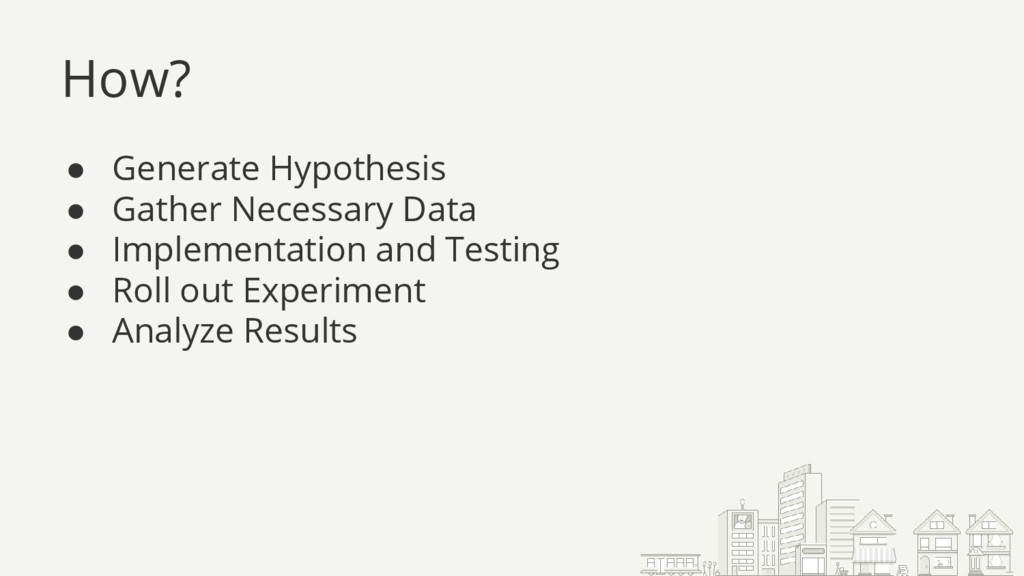
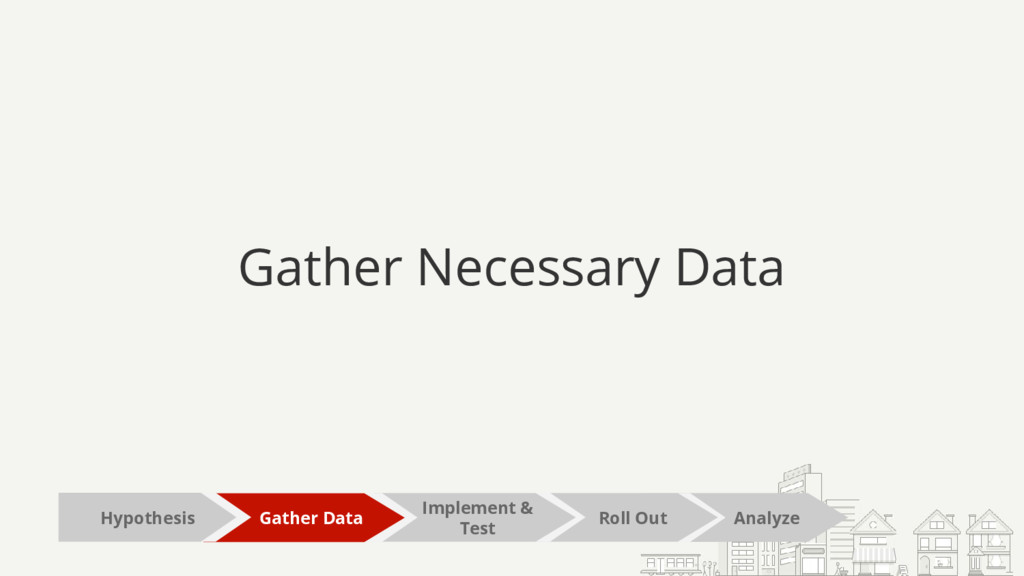
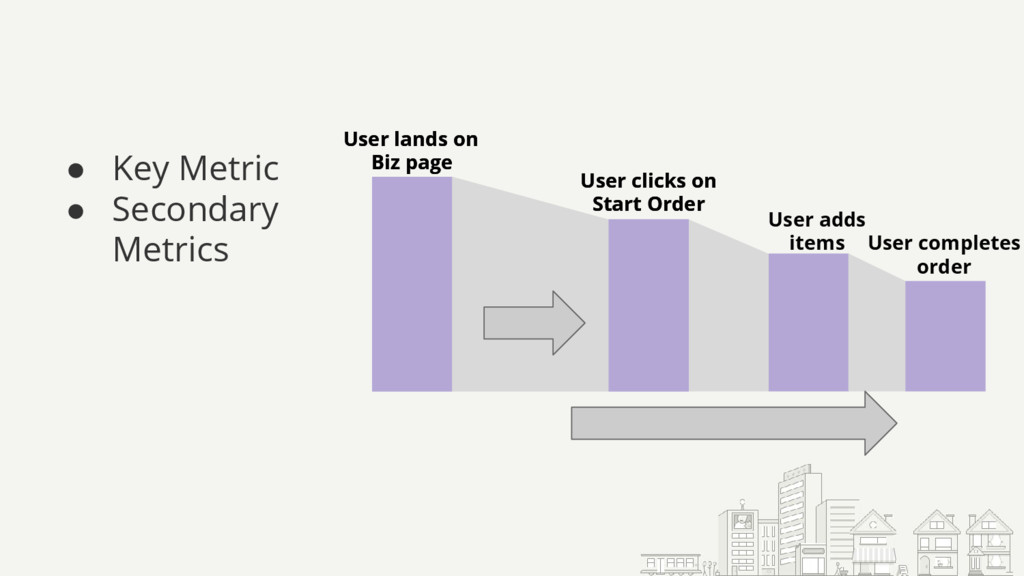
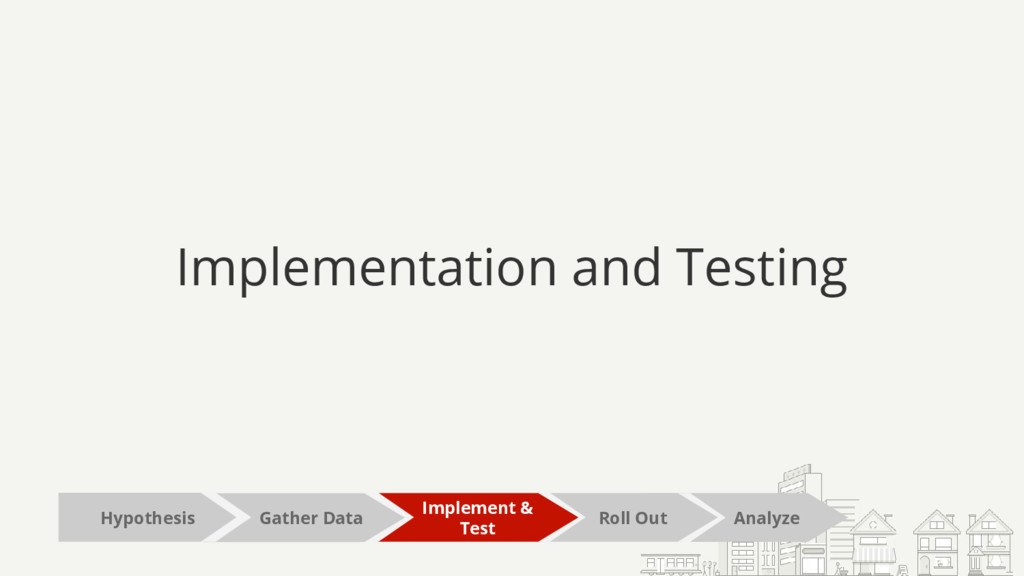
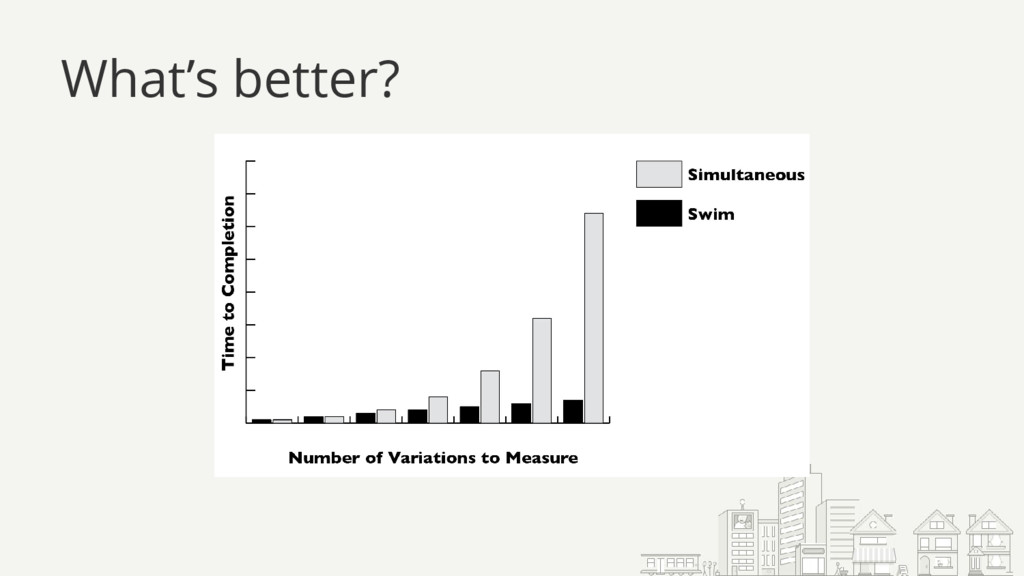
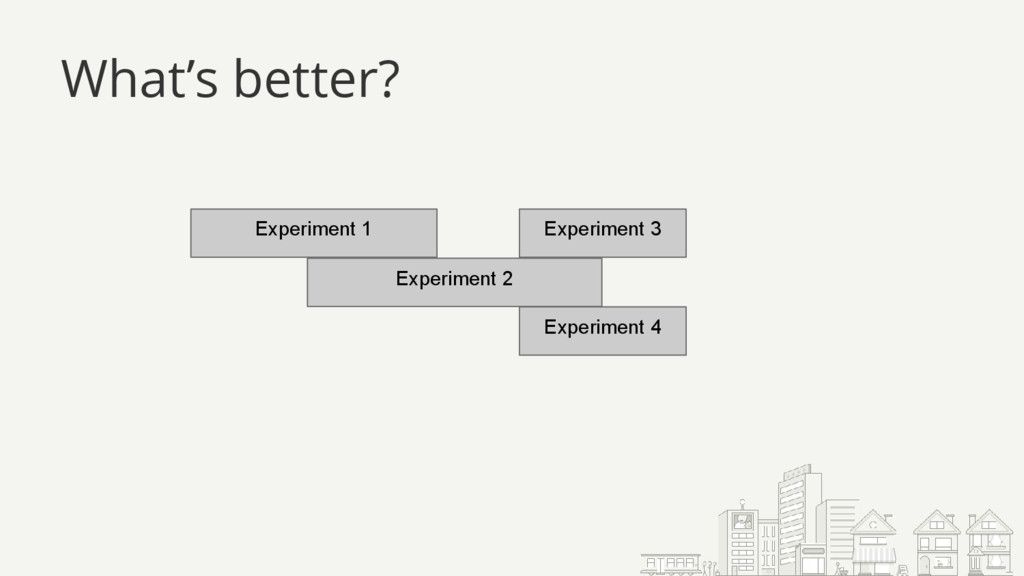
This talk will present a procedure developed to run an A/B experiment, from planning the task and understanding the key metrics to analyzing the results. We will cover both simple and more complex case study, which help us understand the challenges involved in running experiments.
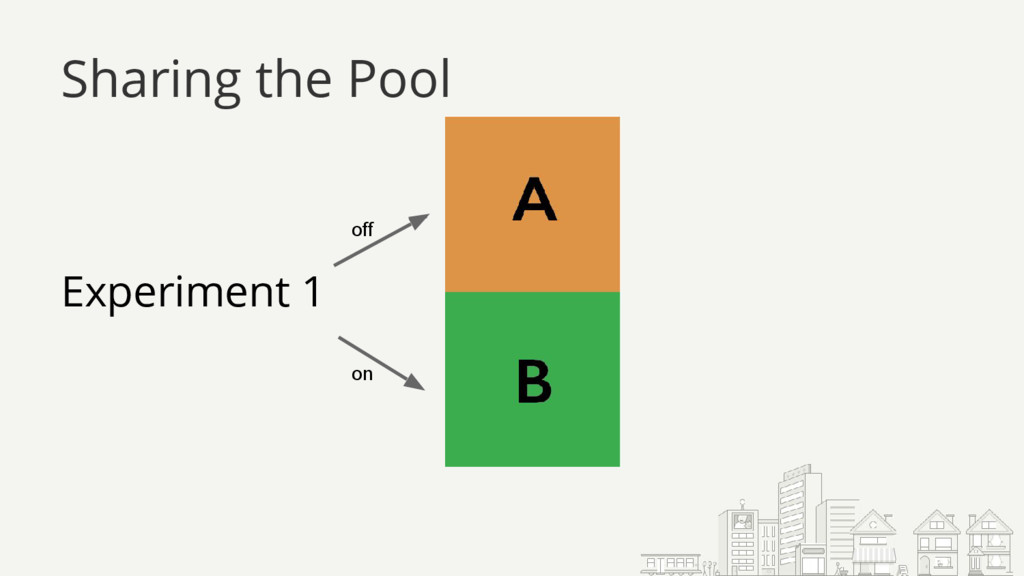
This talk will cover a topic that will enable developers to make more data-driven decisions but has not been covered at Pycon. By providing case studies as motivation and a procedure to implement A/B testing this talk will excite the audience. Yelp runs multiple experiments on different aspects and the Transaction Platform team has gotten unique experience of needing to create experiments with limited traffic which will be discussed in the talk.
Bio
Or Weizman is an engineer for Yelp's Transaction Platform team, which enables users to transact with Yelp's extensive set of businesses through many third party providers.
https://youtu.be/7SA3a_AXA1g