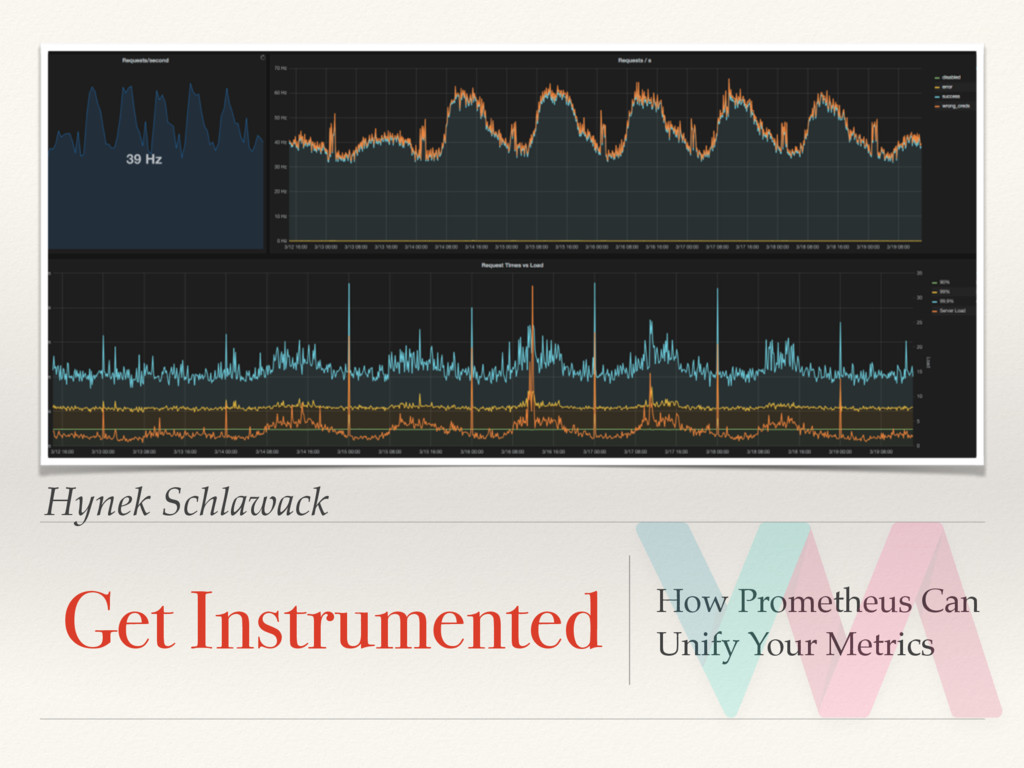
To get real time insight into your running applications you need to instrument them and collect metrics: count events, measure times, expose numbers. Sadly this important aspect of development was a patchwork of half-integrated solutions for years. Prometheus changed that and this talk will walk you through instrumenting your apps and servers, building dashboards, and monitoring using metrics.
https://us.pycon.org/2016/schedule/presentation/1601/
![Aggregation sum( rate( req_seconds_count[1m] ) )](https://files.speakerdeck.com/presentations/76d3e23ec7774528920344610b7f03a6/slide_81.jpg)
![Aggregation sum( rate( req_seconds_count[1m] ) )](https://files.speakerdeck.com/presentations/76d3e23ec7774528920344610b7f03a6/slide_82.jpg)
![Aggregation sum( rate( req_seconds_count[1m] ) )](https://files.speakerdeck.com/presentations/76d3e23ec7774528920344610b7f03a6/slide_83.jpg)
![Aggregation sum( rate( req_seconds_count[1m] ) )](https://files.speakerdeck.com/presentations/76d3e23ec7774528920344610b7f03a6/slide_84.jpg)
![Aggregation sum( rate( req_seconds_count{dc="west"}[1m] ) )](https://files.speakerdeck.com/presentations/76d3e23ec7774528920344610b7f03a6/slide_85.jpg)
![Aggregation sum( rate( req_seconds_count[1m] ) ) by (dc)](https://files.speakerdeck.com/presentations/76d3e23ec7774528920344610b7f03a6/slide_86.jpg)
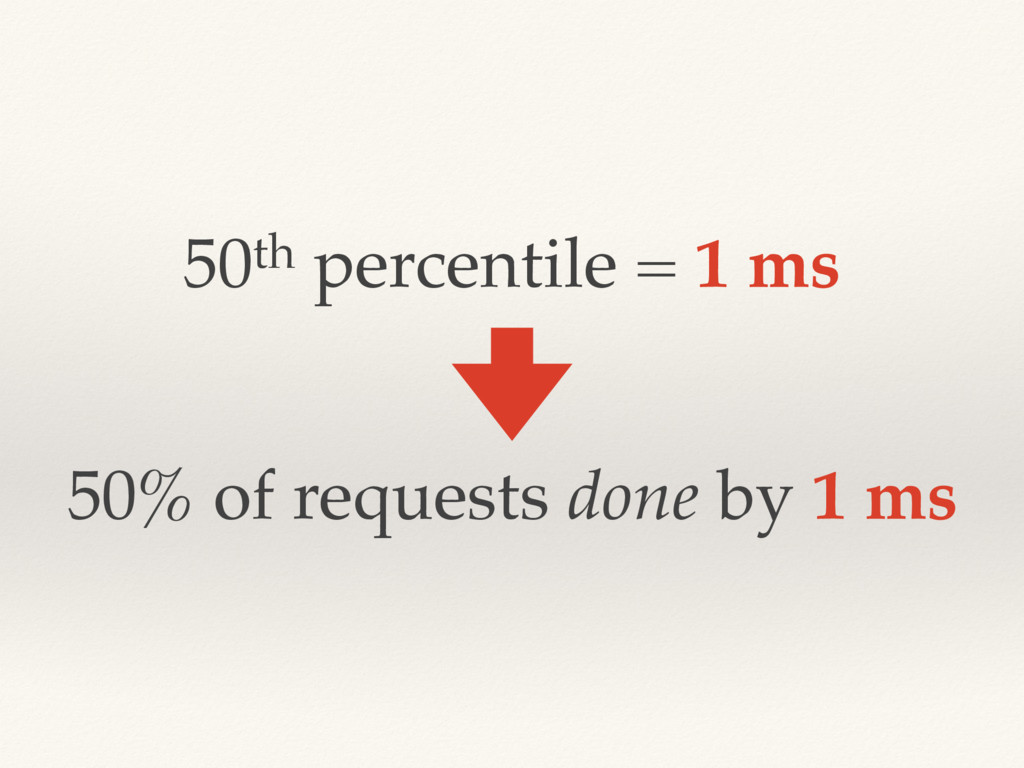
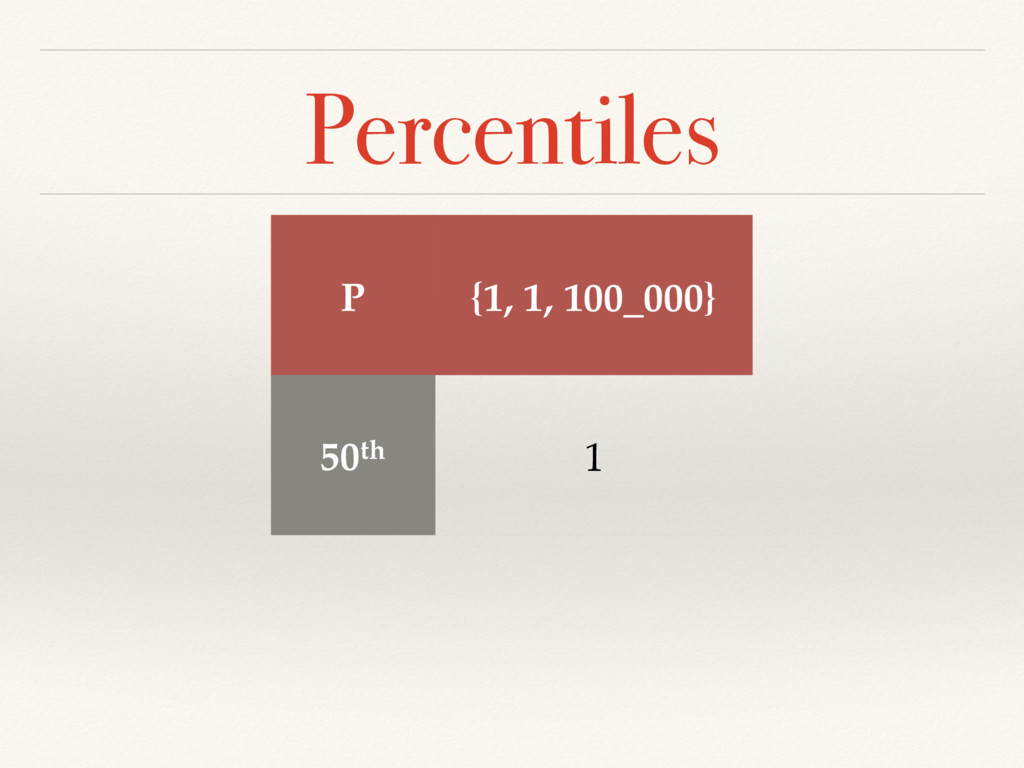
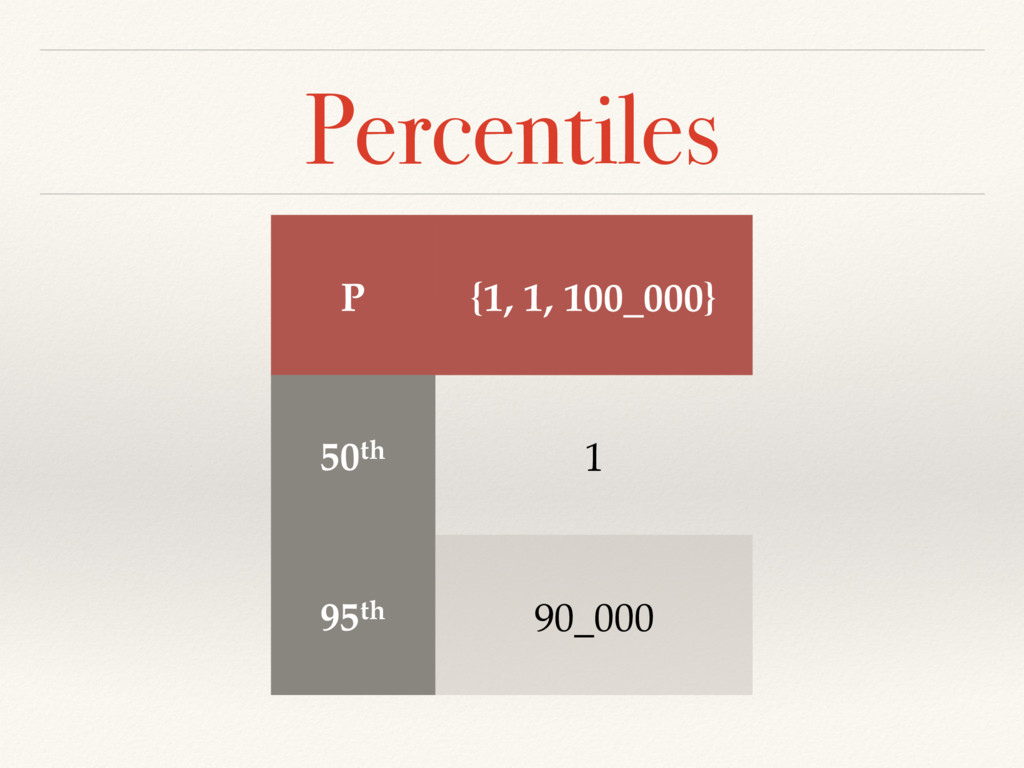
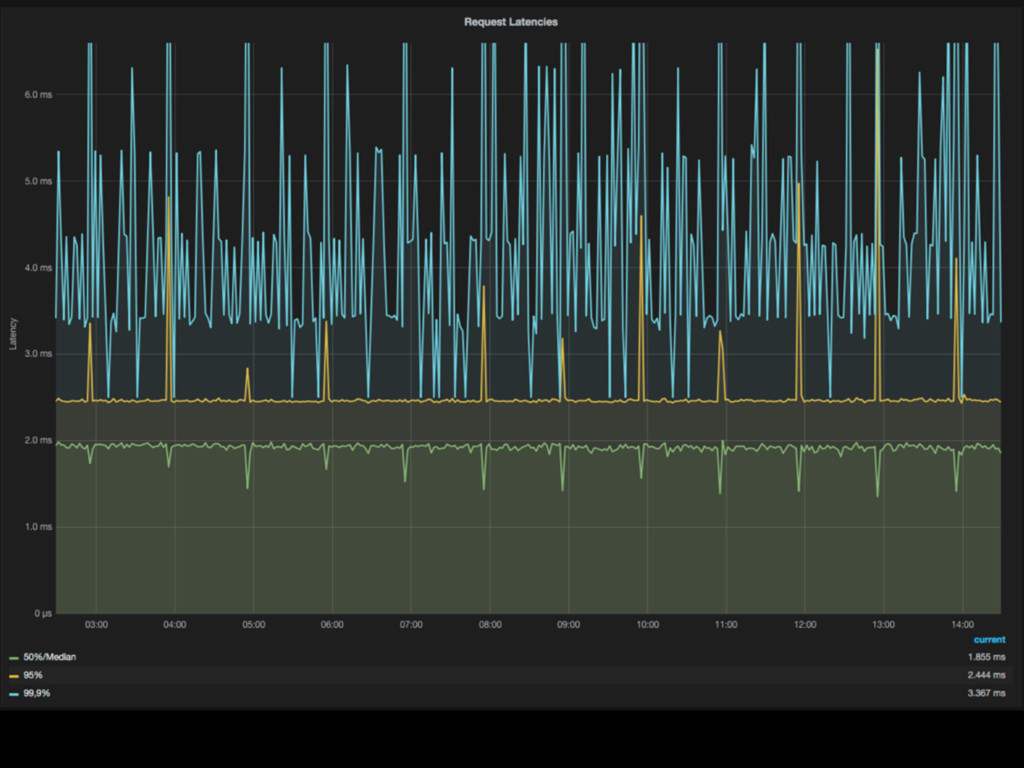
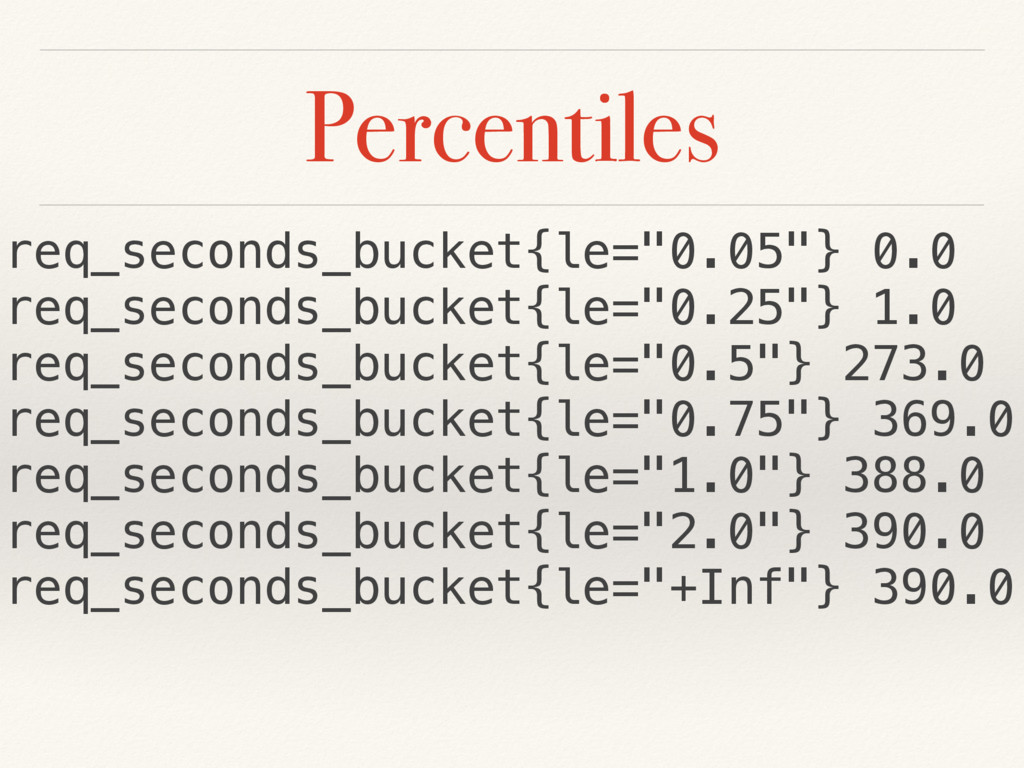
![Percentiles histogram_quantile( 0.9, rate( req_seconds_bucket[10m] ))](https://files.speakerdeck.com/presentations/76d3e23ec7774528920344610b7f03a6/slide_87.jpg)
![Percentiles histogram_quantile( 0.9, rate( req_seconds_bucket[10m] ))](https://files.speakerdeck.com/presentations/76d3e23ec7774528920344610b7f03a6/slide_88.jpg)
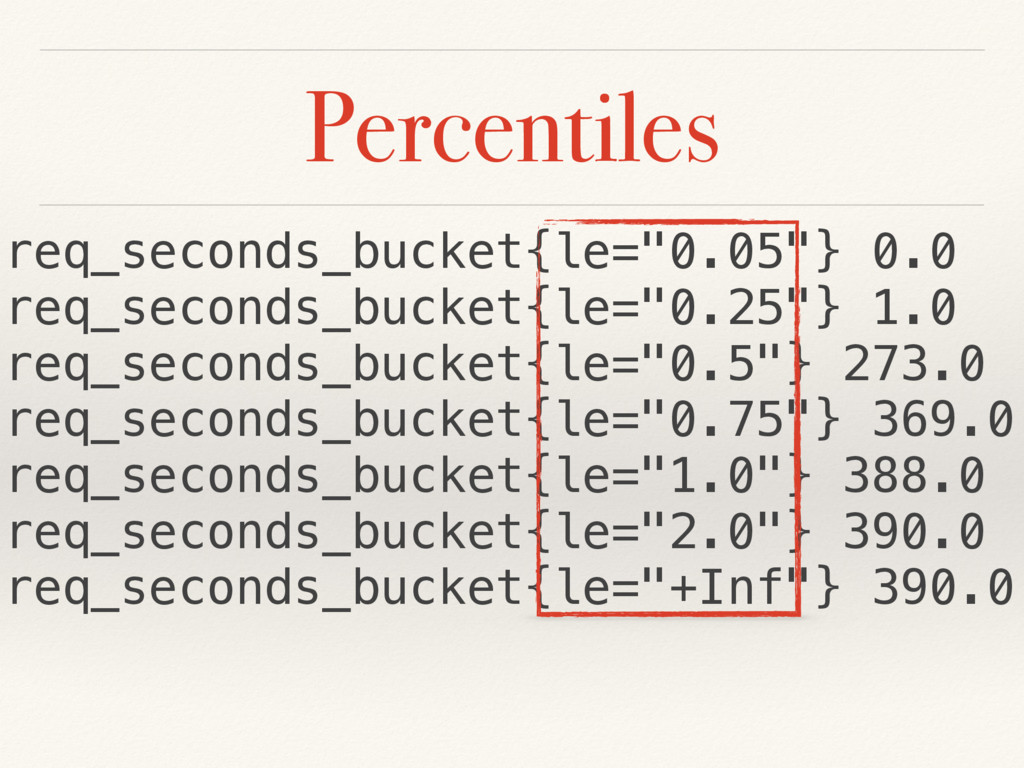
![Percentiles histogram_quantile( 0.9, rate( req_seconds_bucket[10m] ))](https://files.speakerdeck.com/presentations/76d3e23ec7774528920344610b7f03a6/slide_89.jpg)
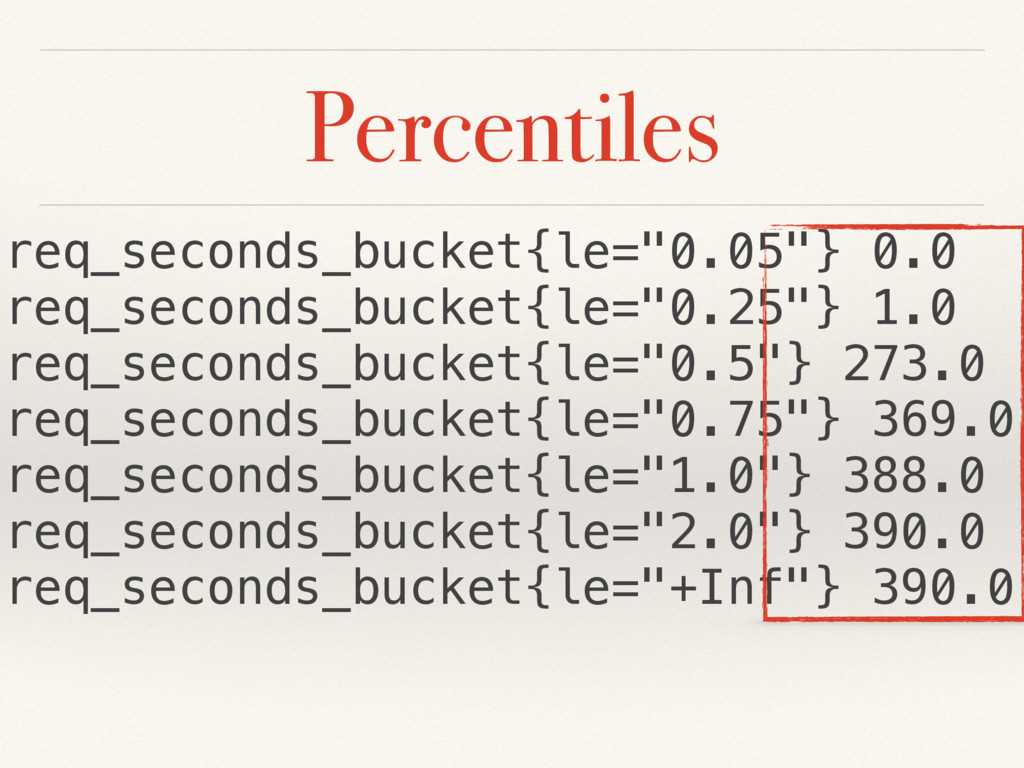
![Percentiles histogram_quantile( 0.9, rate( req_seconds_bucket[10m] ))](https://files.speakerdeck.com/presentations/76d3e23ec7774528920344610b7f03a6/slide_90.jpg)
![Percentiles histogram_quantile( 0.9, rate( req_seconds_bucket[10m] ))](https://files.speakerdeck.com/presentations/76d3e23ec7774528920344610b7f03a6/slide_91.jpg)
![Alerts & Scrying ALERT DiskWillFillIn4Hours IF predict_linear( node_filesystem_free[1h], 4*3600) <](https://files.speakerdeck.com/presentations/76d3e23ec7774528920344610b7f03a6/slide_109.jpg)
![Alerts & Scrying ALERT DiskWillFillIn4Hours IF predict_linear( node_filesystem_free[1h], 4*3600) <](https://files.speakerdeck.com/presentations/76d3e23ec7774528920344610b7f03a6/slide_110.jpg)
![Alerts & Scrying ALERT DiskWillFillIn4Hours IF predict_linear( node_filesystem_free[1h], 4*3600) <](https://files.speakerdeck.com/presentations/76d3e23ec7774528920344610b7f03a6/slide_111.jpg)
![Alerts & Scrying ALERT DiskWillFillIn4Hours IF predict_linear( node_filesystem_free[1h], 4*3600) <](https://files.speakerdeck.com/presentations/76d3e23ec7774528920344610b7f03a6/slide_112.jpg)
![Alerts & Scrying ALERT DiskWillFillIn4Hours IF predict_linear( node_filesystem_free[1h], 4*3600) <](https://files.speakerdeck.com/presentations/76d3e23ec7774528920344610b7f03a6/slide_113.jpg)
![Alerts & Scrying ALERT DiskWillFillIn4Hours IF predict_linear( node_filesystem_free[1h], 4*3600) <](https://files.speakerdeck.com/presentations/76d3e23ec7774528920344610b7f03a6/slide_114.jpg)
![@IN_PROGRESS.track_inprogress() @REQUEST_TIME.time() @app.route("/analyze", methods=["POST"]) def analyze(): g.auth.check(request) with ANALYZE_TIME.time(): result](https://files.speakerdeck.com/presentations/76d3e23ec7774528920344610b7f03a6/slide_164.jpg)
![@IN_PROGRESS.track_inprogress() @REQUEST_TIME.time() @app.route("/analyze", methods=["POST"]) def analyze(): g.auth.check(request) with ANALYZE_TIME.time(): result](https://files.speakerdeck.com/presentations/76d3e23ec7774528920344610b7f03a6/slide_165.jpg)
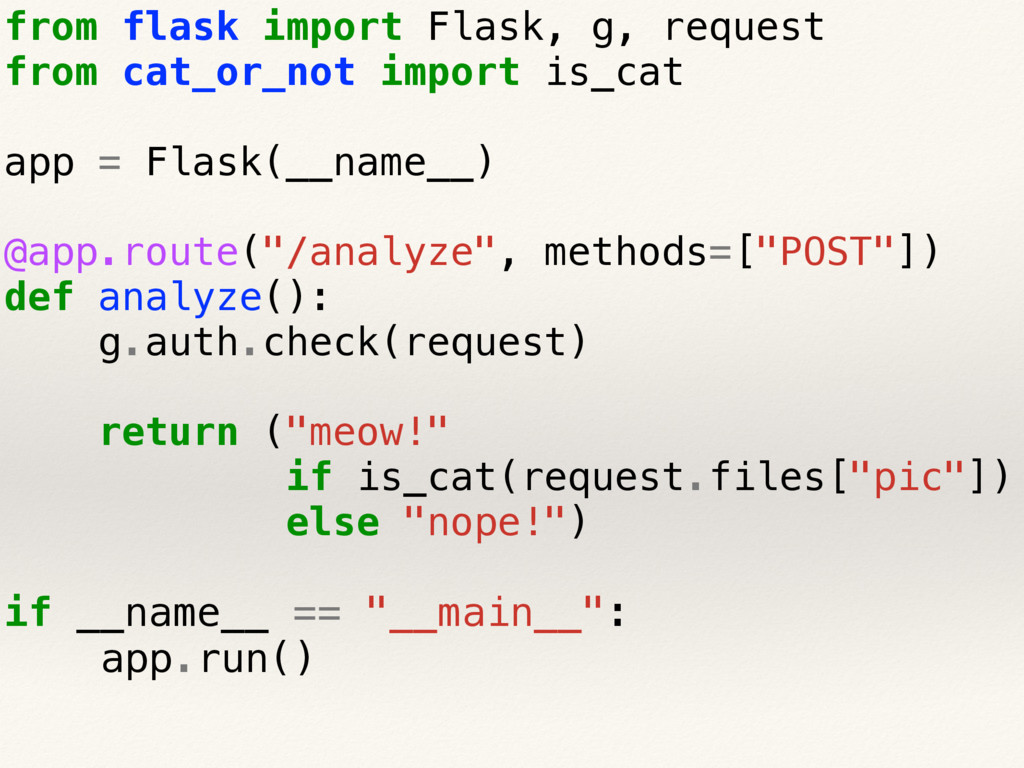
![@app.route("/analyze", methods=["POST"]) def analyze(): g.auth.check(request) with ANALYZE_TIME.time(): result = is_cat(](https://files.speakerdeck.com/presentations/76d3e23ec7774528920344610b7f03a6/slide_170.jpg)