Upgrade to Pro — share decks privately, control downloads, hide ads and more …

Wendy Grus - When is it good to be bad? Web scraping and data analysis of NHL penalties

Wendy Grus - When is it good to be bad? Web scraping and data analysis of NHL penalties

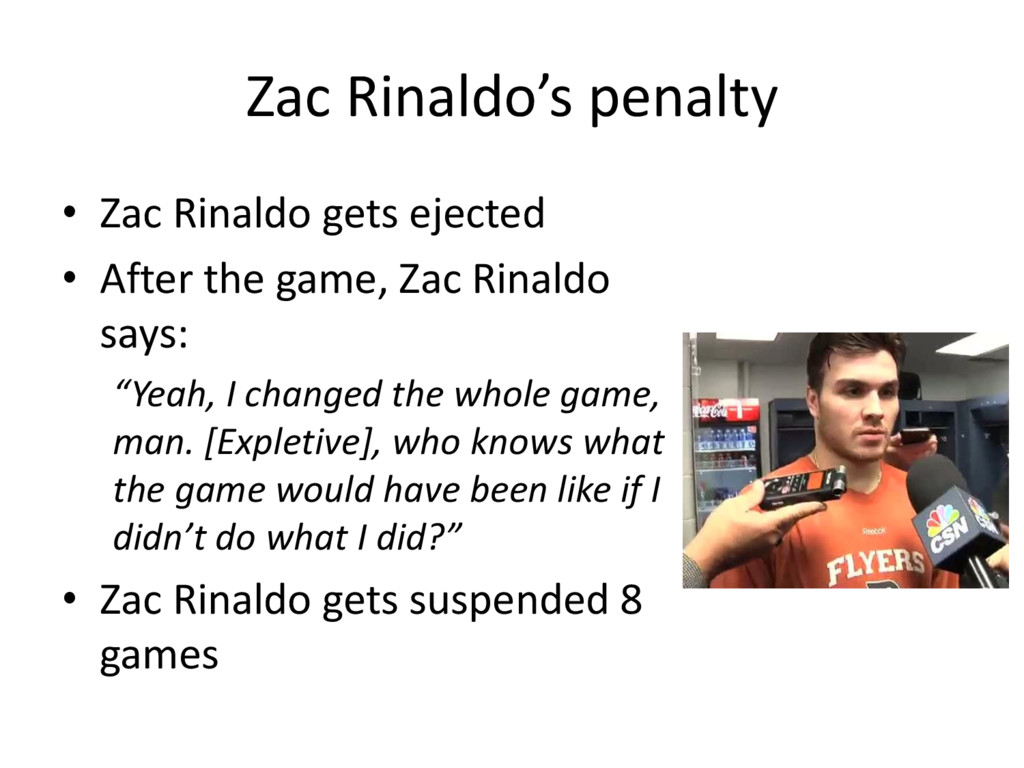
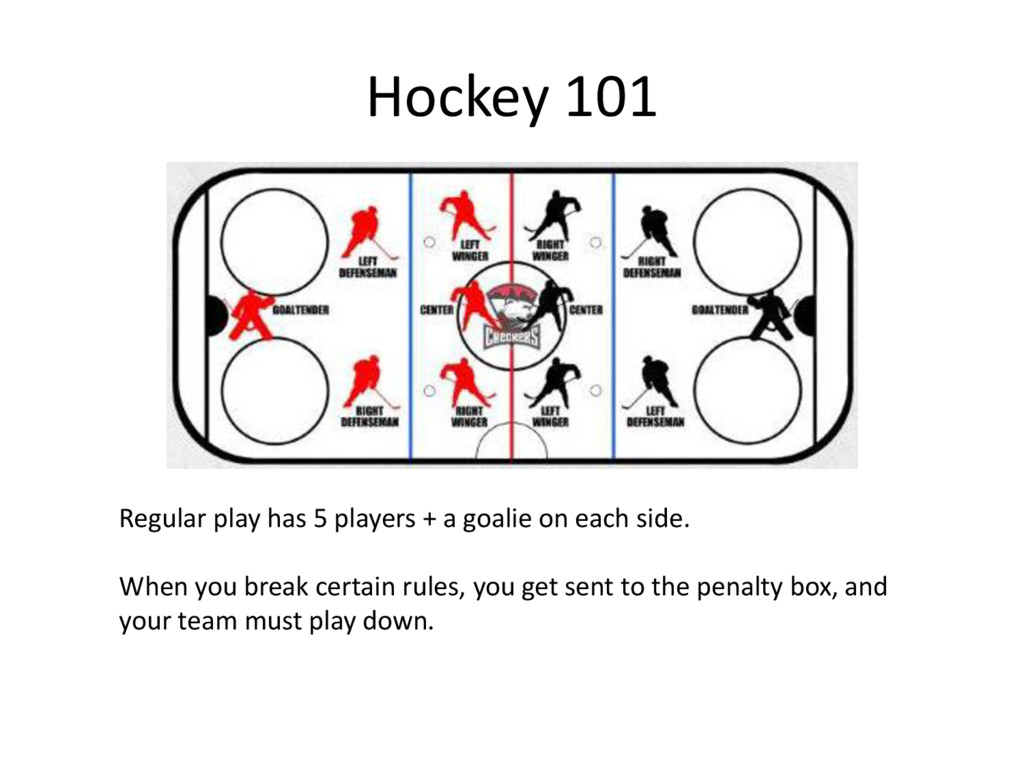
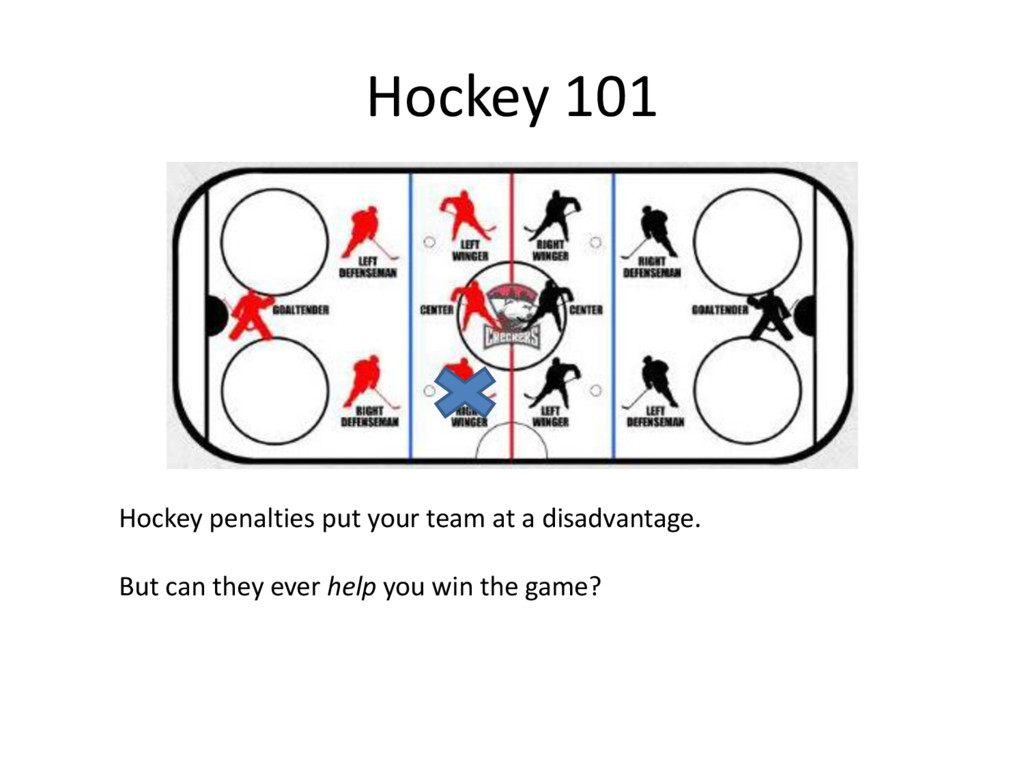
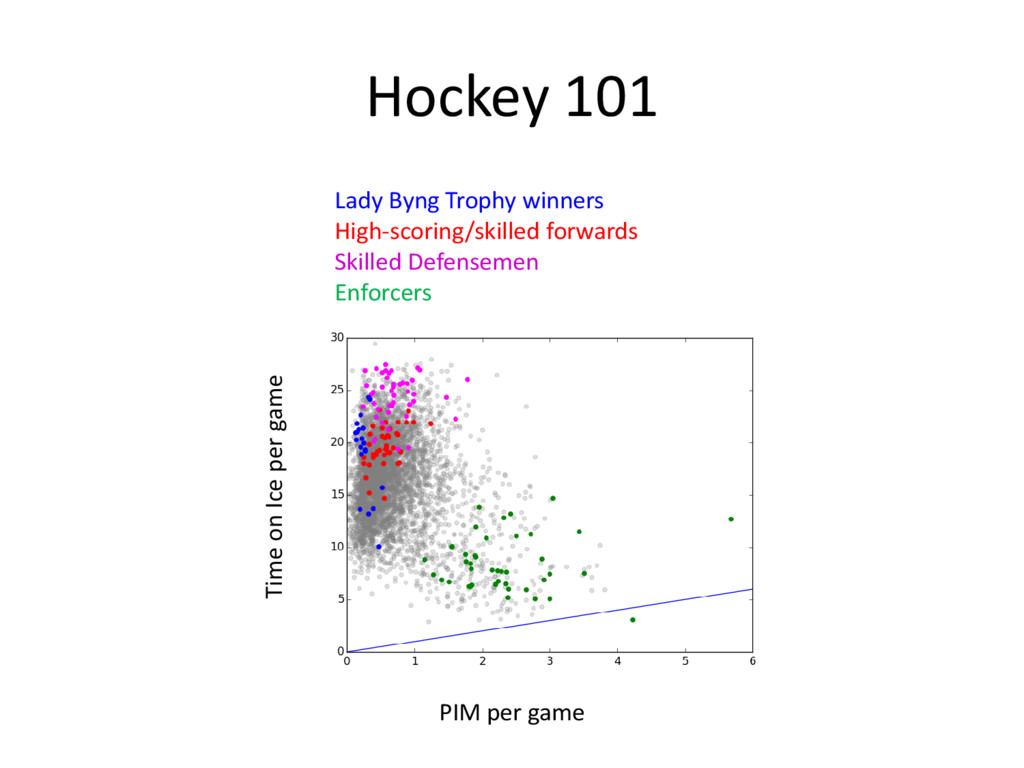
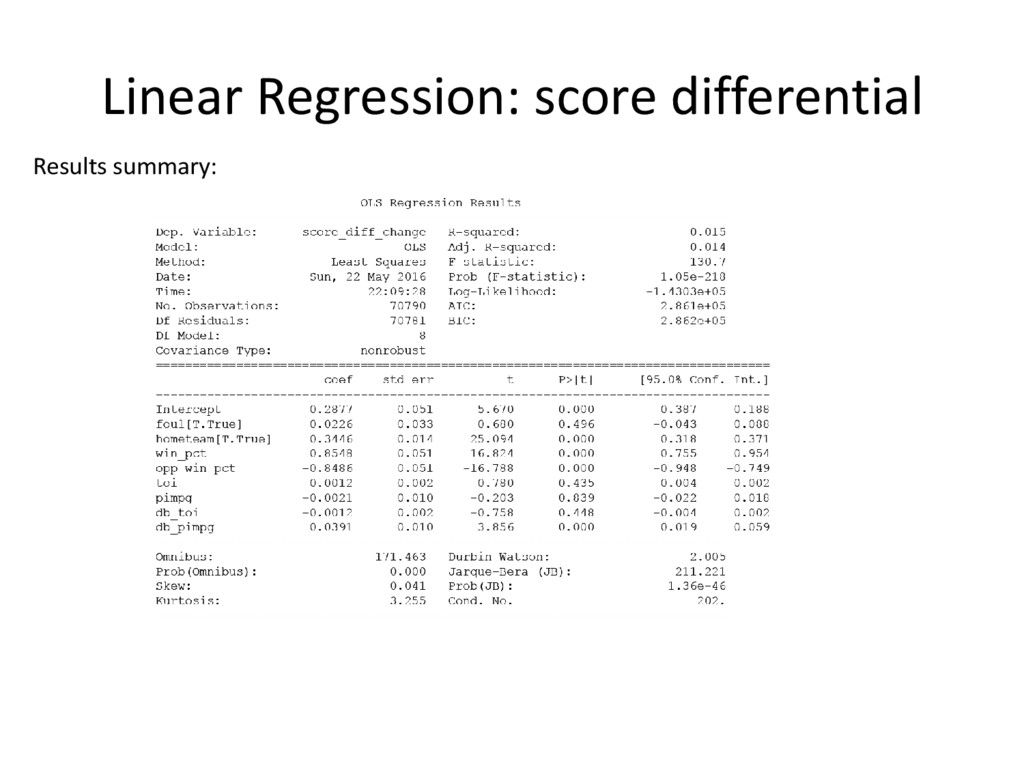
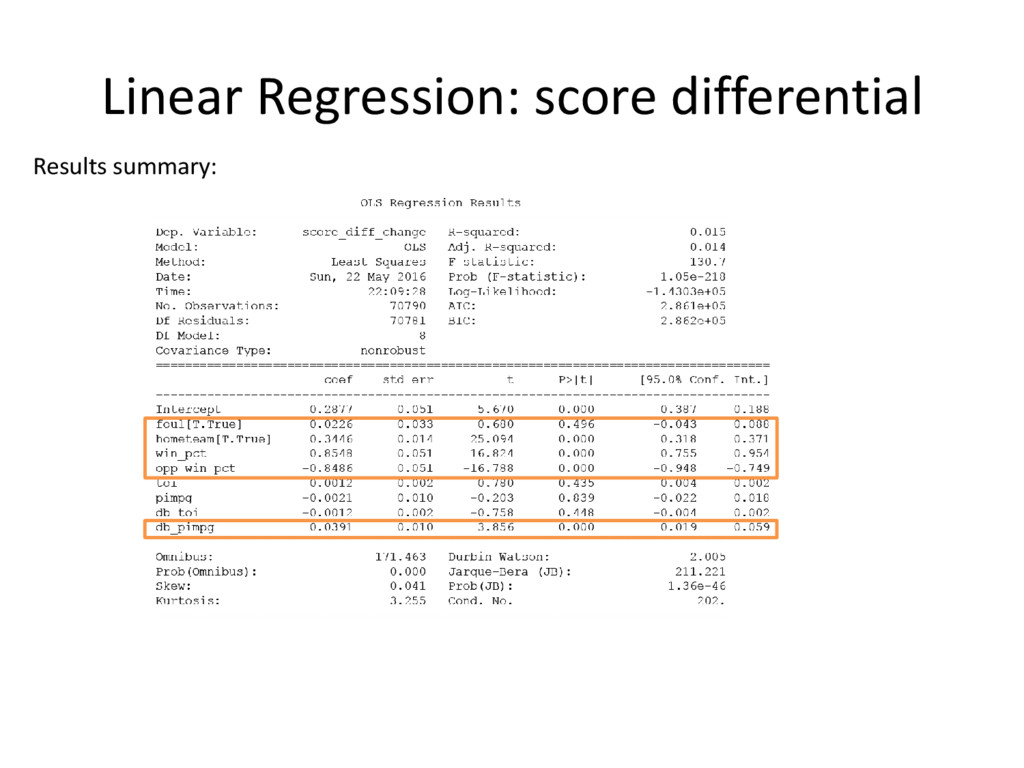
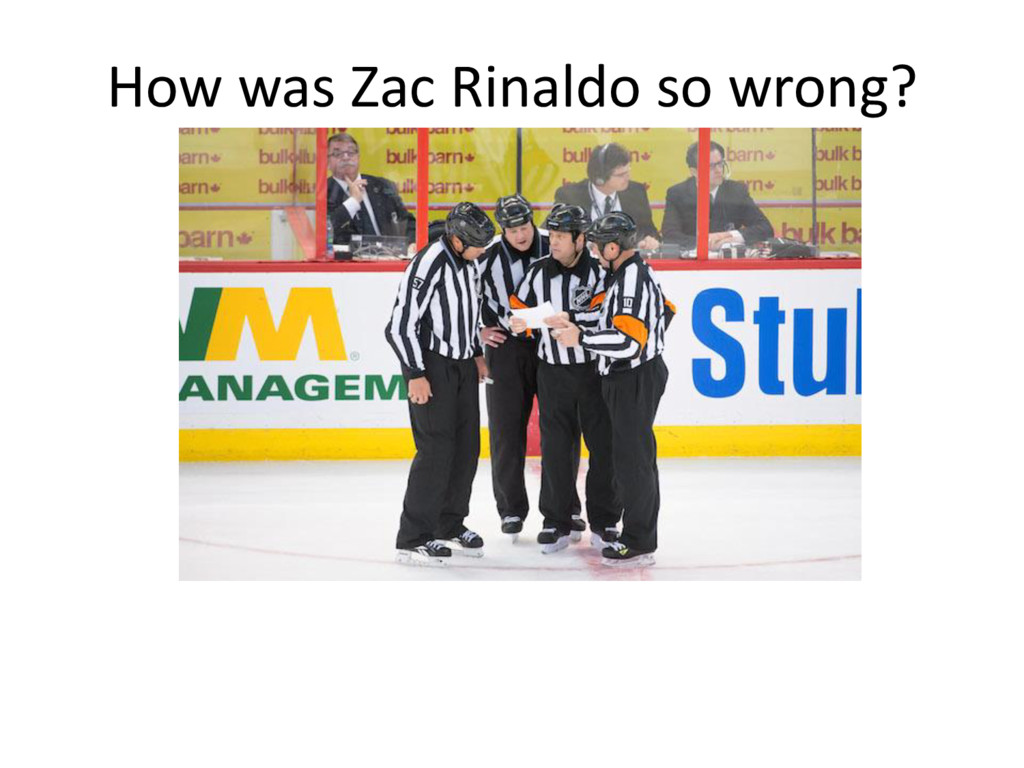
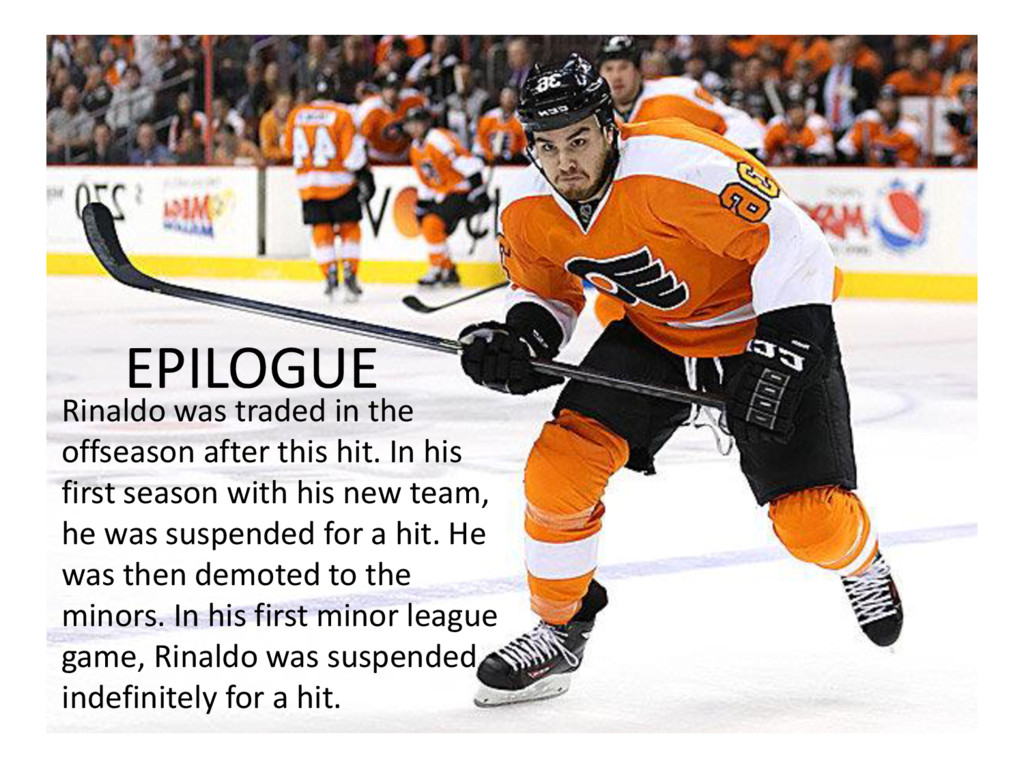
On Jan. 20, Philadelphia Flyers forward Zac Rinaldo was ejected from a game after boarding Penguins defenseman Kris Letang. The Flyers came back to win. After the game, Rinaldo said he "changed the game" (for which he was suspended 8 games). Using Python for webscraping and data analysis, I explore data from 10 NHL seasons to investigate how hockey penalties affect the outcome of the game.

https://us.pycon.org/2016/schedule/presentation/1725/

PyCon 2016

May 29, 2016
Tweet

More Decks by PyCon 2016

Other Decks in Programming

Transcript

  1. When is it good to be bad? Web scraping and

    data analysis of NHL penalties Wendy Grus @wgrus [email protected]
  2. Zac Rinaldo’s penalty • Zac Rinaldo gets ejected • After

    the game, Zac Rinaldo says: “Yeah, I changed the whole game, man. [Expletive], who knows what the game would have been like if I didn’t do what I did?” • Zac Rinaldo gets suspended 8 games
  3. Hockey 101 Regular play has 5 players + a goalie

    on each side. When you break certain rules, you get sent to the penalty box, and your team must play down.
  4. Hockey 101 Hockey penalties put your team at a disadvantage.

    But can they ever help you win the game?
  5. Hockey 101 PIM per game Time on Ice per game

    Lady Byng Trophy winners High-scoring/skilled forwards Skilled Defensemen Enforcers
  6. When is it good to be bad? To quantitatively evaluate

    Rinaldo’s question, I can analyze NHL hockey penalty data.
  7. Webscraping Webscraping is extracting data from websites that do not

    have APIs that allow you access to the data programmatically.
  8. Webscraping: Things to think about 1. What data do I

    need? 2. What features should I look for in the website? 3. How do I collect, combine, and analyze data?
  9. Webscraping: Things to think about 1. What data do I

    need? 2. What features should I look for in the website? 3. How do I collect, combine, and analyze data? BRAIN Requests, BeautifulSoup, pandas, statsmodels
  10. What data do I need: Designing your experiment 1. What

    question do you want to answer? 2. What data will you need? 3. What data is available?
  11. What features should I look for in website? 1. Is

    it easy to automate moving from page to page? 2. Is the data easy to parse from the source code?
  12. 1. Is it easy to automate moving from page to

    page? A: season B: constant, PL – playbyplay 02 – regular season C: game in the season (0001-1230) A B C
  13. Browser-rendered site Look at the source code 2. Is the

    data easy to parse from the source code?
  14. How do I collect the data? Sped up penalty parser

    by switching from BeautifulSoup to lxml to extract content!
  15. For every penalty, parsed out: season, game#, game_time, type, team,

    player, drawnby, servedby, period, length, score_diff, next_goal, score_differential, positive_change Combined in team information: hometeam, win_pct, opp_win_pct Combined in player information for player and drawn by player: time on ice, penalties in min per game How do I combine the data?
  16. When using multiple data sources, data fields may not be

    named the same. TEAMS: New Jersey Devils can be N.J on one site and NJD on another PLAYERS: play-by-play recaps gave players by # lastname team player stats gave players by firstname lastname teams How do I combine the data?
  17. When looking at data over time, the data fields may

    change names. How do I combine the data?
  18. When looking at many classes of data, it can be

    useful to reduce the data into a smaller number of categories. I reduced the 113 distinct penalty names into 8 penalty types: Physical foul Stick infraction Delay of game Altercation Penalty Shot Bench Illegal behavior Impeding behavior How do I combine the data?
  19. How do I analyze data? Evaluating three outcomes: 1) Next

    goal: Team that gets the penalty scores the next goal 2) Positive change: final state better than state at the time of the penalty 3) Score differential: score difference between the time of penalty and the end of the game (not including overtime)
  20. How do I analyze data? Use logistic regression (next goal

    and positive change) and linear regression (score differential) to build models that predicts the outcome of the game based on penalty, game, and player features. Logistic: Linear:
  21. How do I analyze data? Choosing covariates: 1) Physical foul

    indicator 2) Hometeam indicator 3) Team strength: Win percentage 4) Opponent strength: Opponent’s win percentage 5) Penalized player strength: time on ice and penalty minutes per game 6) Drawing player strength: time on ice and penalty minutes per game
  22. How do I analyze data? 91476 total penalties 82990 penalties

    with drawn by information 77542 penalties with a next goal scored Filtered combined dataset for analysis
  23. Analyze data: importing data to pandas Import data into a

    pandas dataframe Adjust column names
  24. Logistic Regression: next goal Use statsmodels Logit to evaluate if

    taking a penalty increases the odds of your team scoring the next goal.
  25. Logistic Regression: next goal Use statsmodels Logit to evaluate if

    taking a penalty increases the odds of your team scoring the next goal.
  26. Linear Regression: score differential Use statsmodels OLS to evaluate if

    taking a penalty increases the score differential from the time of the penalty to the end of regulation.
  27. When is it good to be bad? • When you

    have a better record than your opponent • When you are the home team
  28. EPILOGUE Rinaldo was traded in the offseason after this hit.

    In his first season with his new team, he was suspended for a hit. He was then demoted to the minors. In his first minor league game, Rinaldo was suspended indefinitely for a hit.