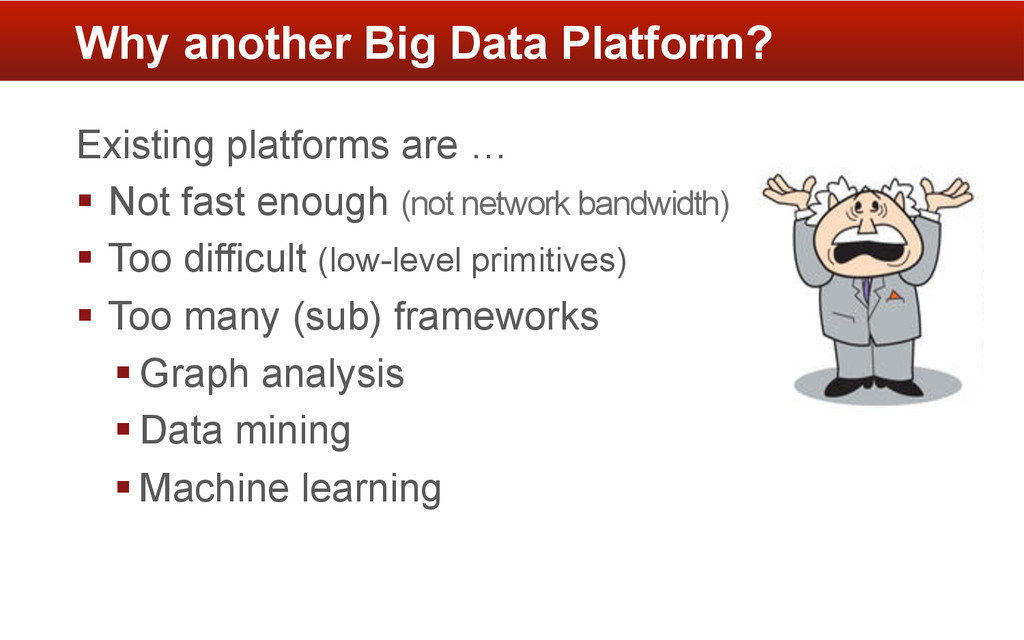
bandwidth) § Too difficult (low-level primitives) § Too many (sub) frameworks § Graph analysis § Data mining § Machine learning Why another Big Data Platform?
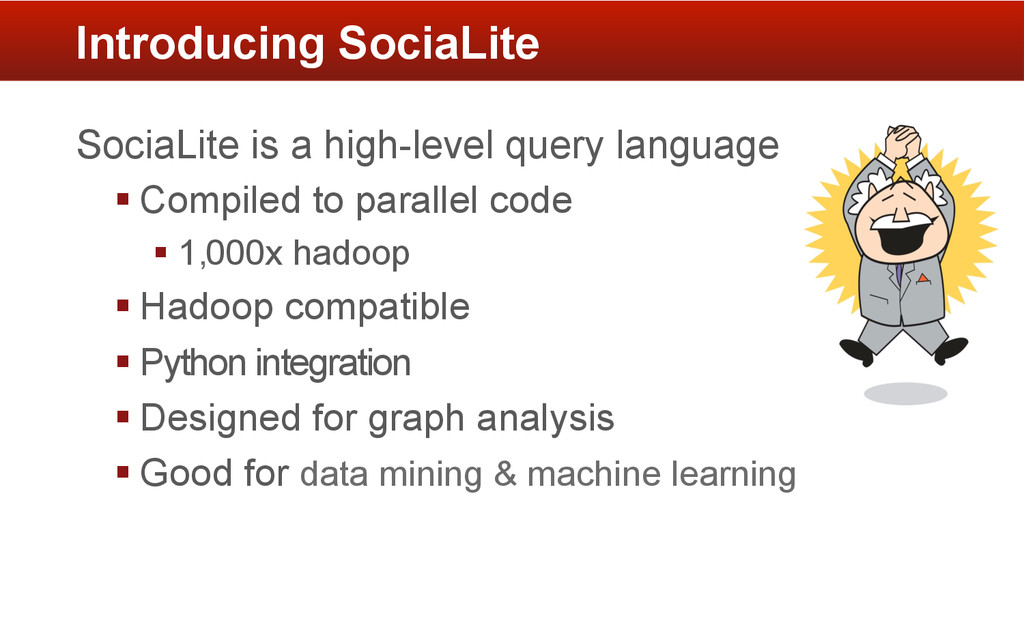
§ 1,000x hadoop § Hadoop compatible § Python integration § Designed for graph analysis § Good for data mining & machine learning Introducing SociaLite
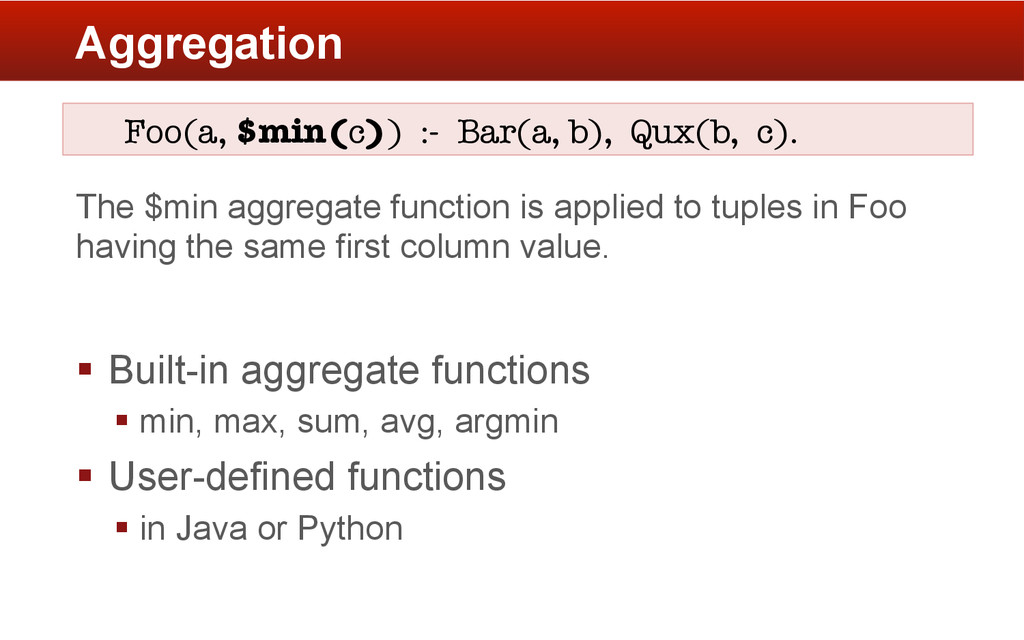
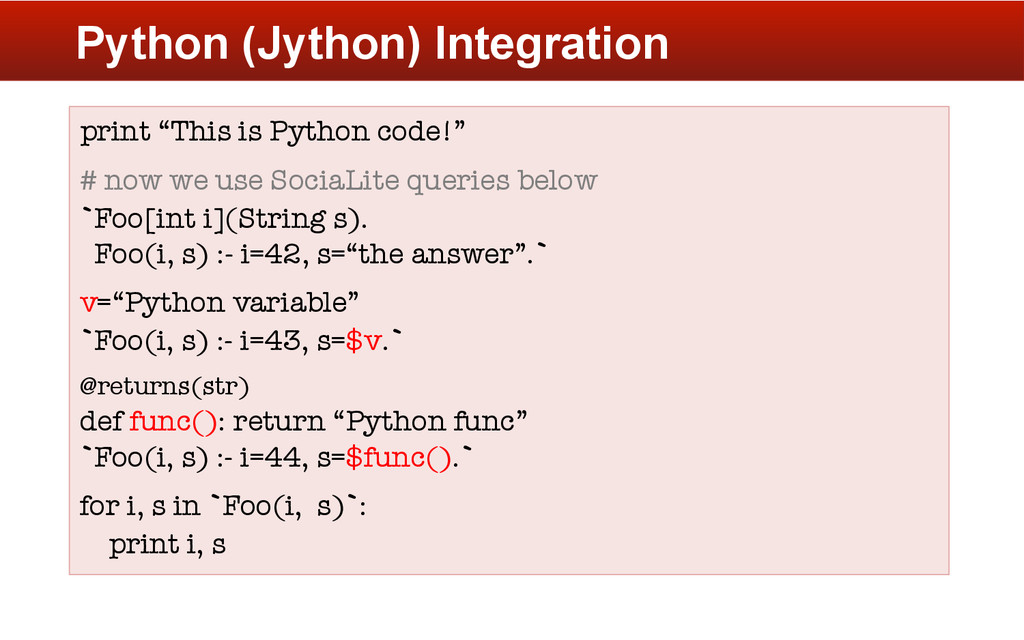
aggregate function is applied to tuples in Foo having the same first column value. § Built-in aggregate functions § min, max, sum, avg, argmin § User-defined functions § in Java or Python
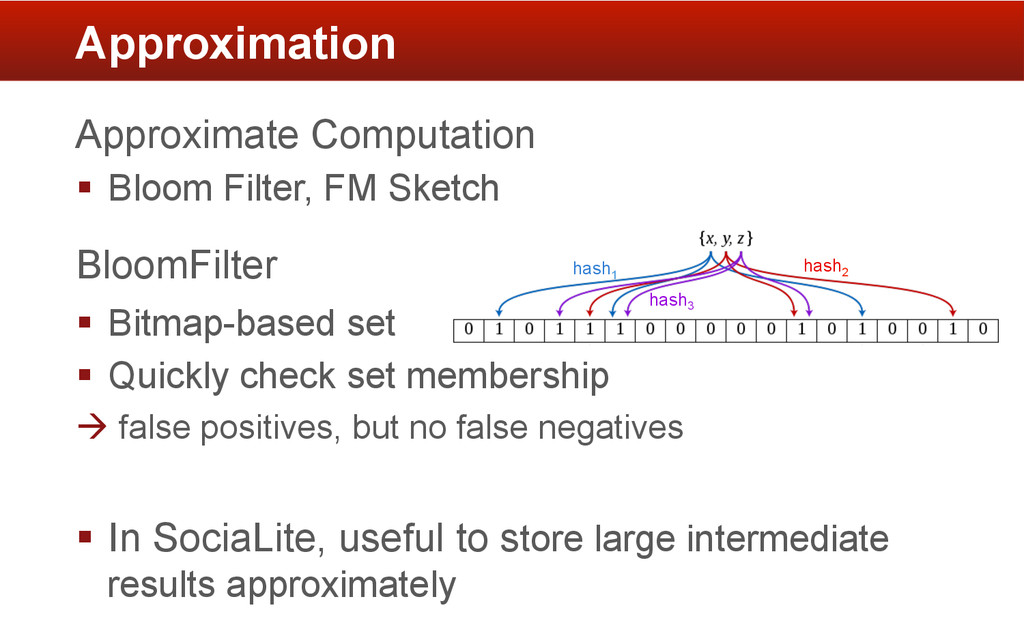
set § Quickly check set membership à false positives, but no false negatives § In SociaLite, useful to store large intermediate results approximately Approximation hash1 hash3 hash2
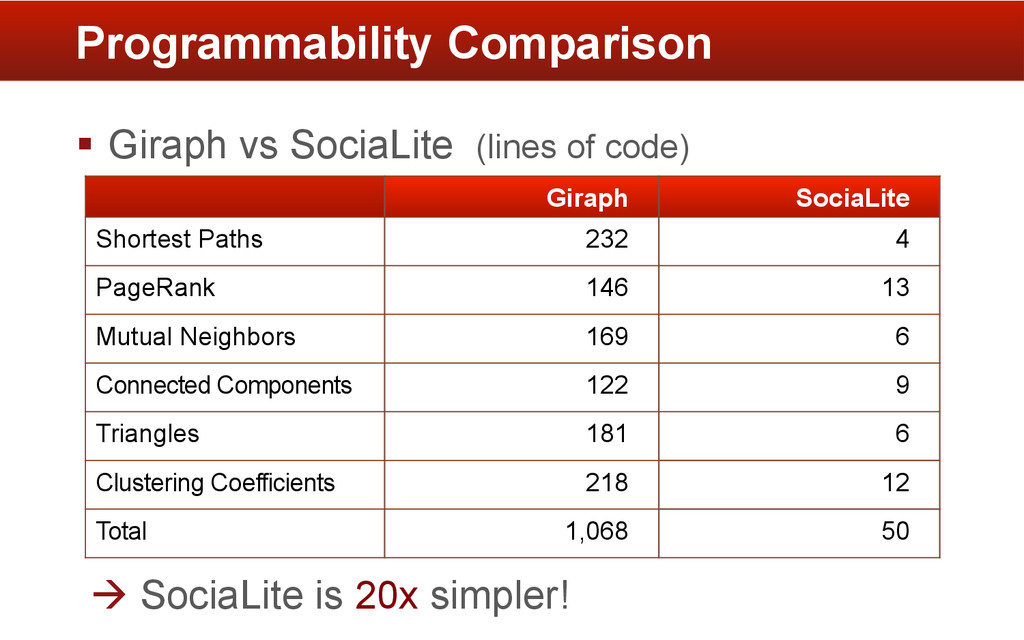
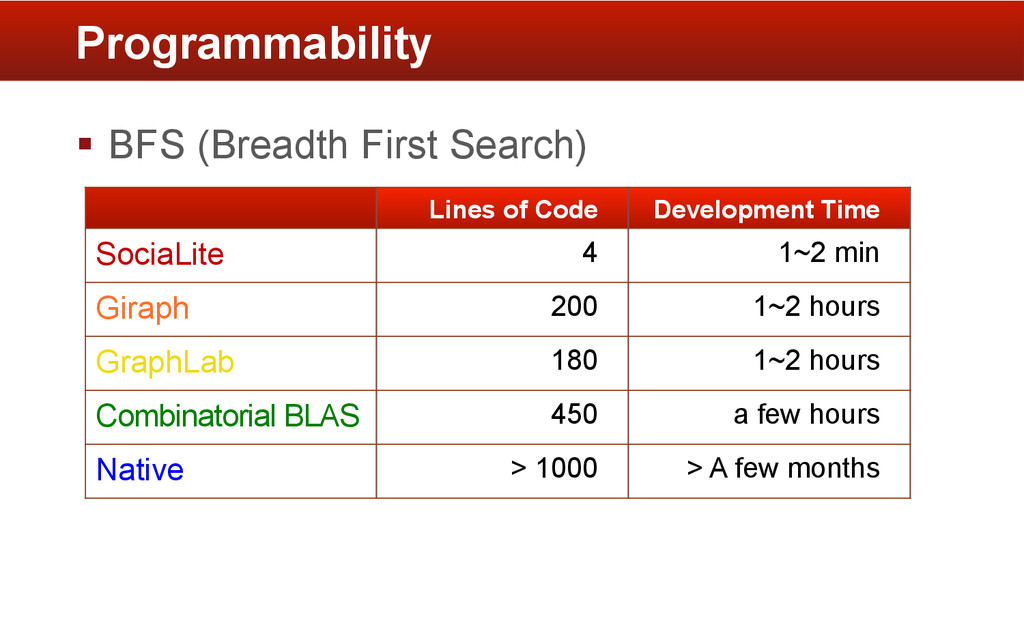
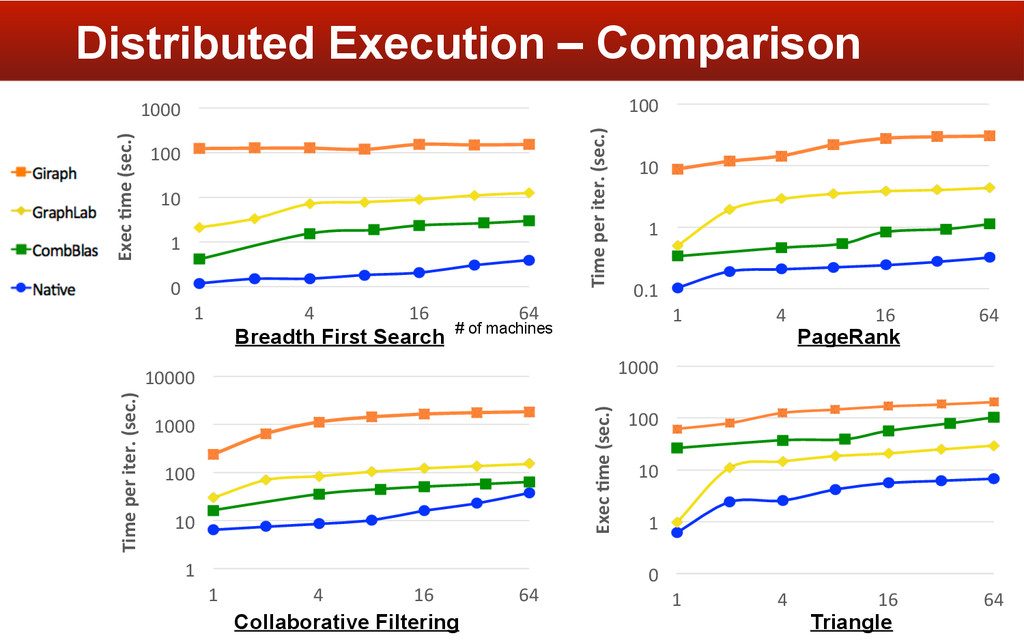
§ As fast as, or faster than - GraphLab, CombBlas § How? - High-level query interface - Compiler optimizations - Python integration Summary Big Data Analysis
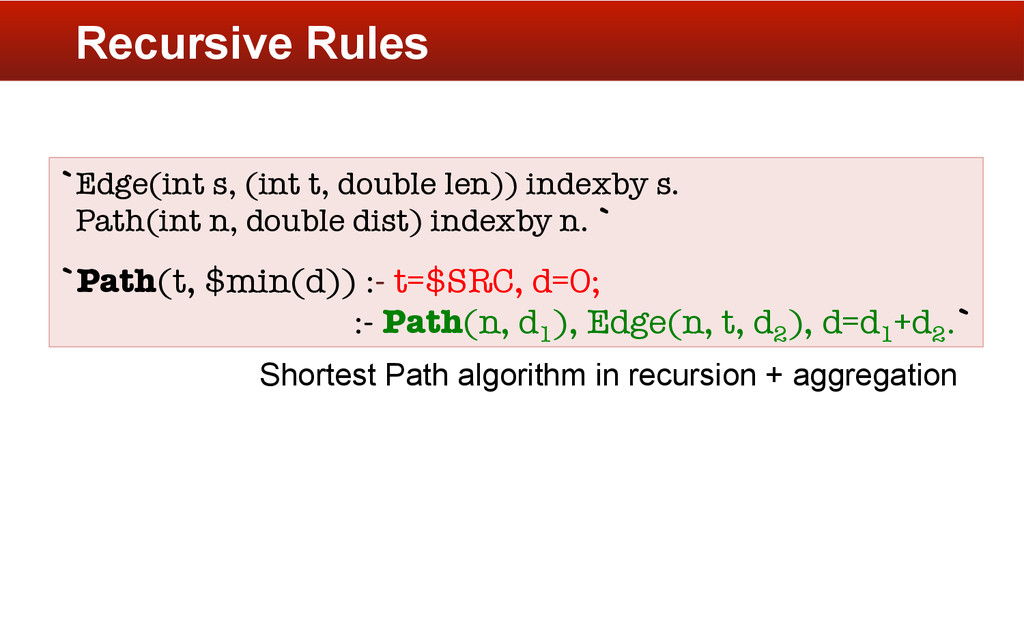
co-authorship (10 million) § Guido van Rossum’s academic network § How Guido is connected to Armin Rigo (PyPy) Jim Hugunin (Jython, IronPython) § Run shortest-paths from Guido & visualize Demo
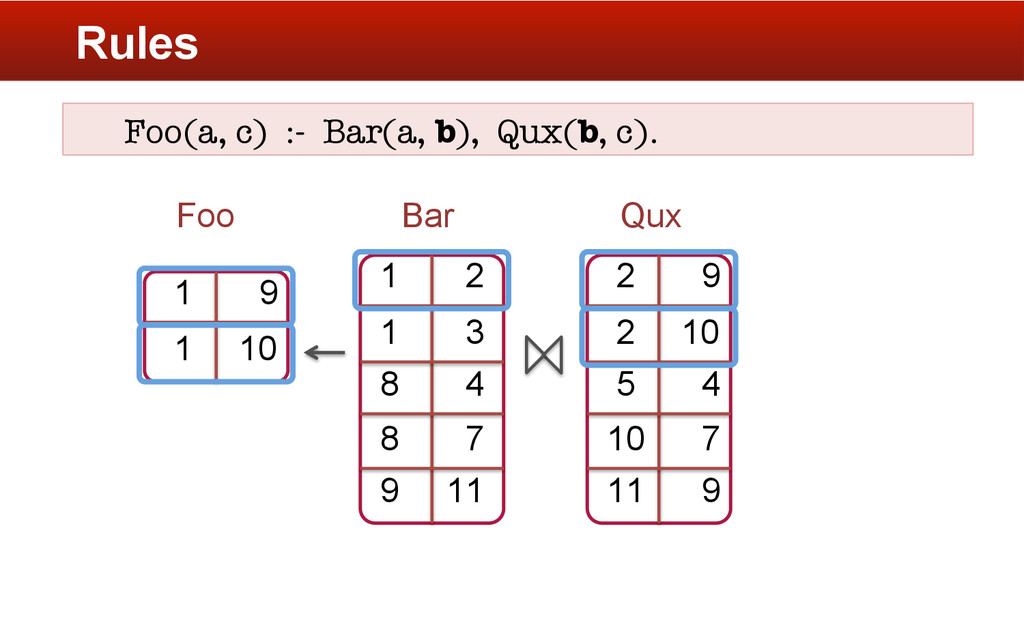
. Bar[int a](int b). Qux[int a](int](https://files.speakerdeck.com/presentations/f36ab8502092013220f94ab84795598e/slide_11.jpg)
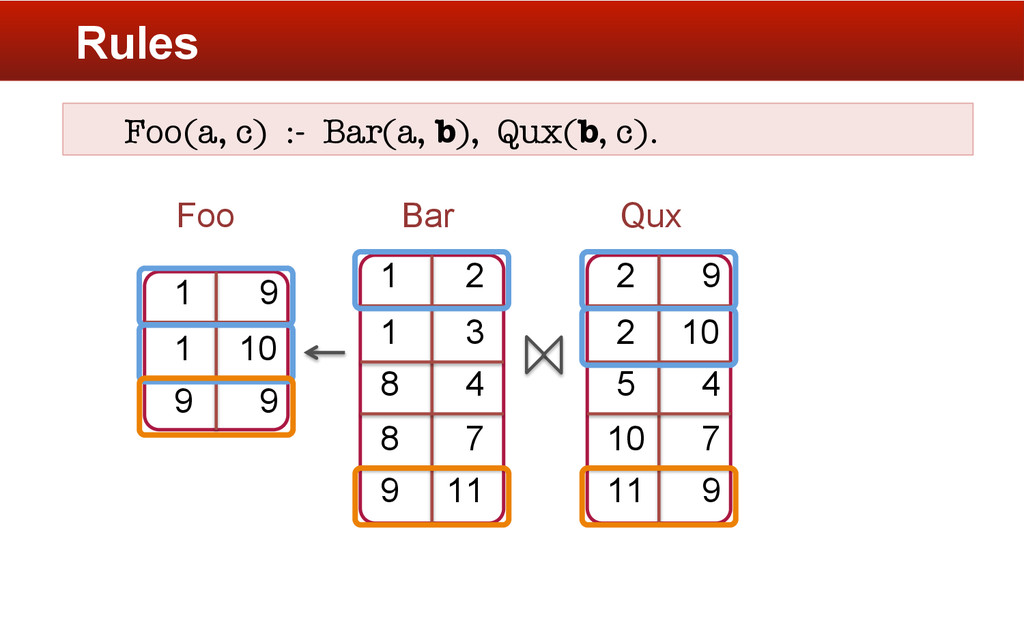
. Bar[int a](int b). Qux[int a](int](https://files.speakerdeck.com/presentations/f36ab8502092013220f94ab84795598e/slide_12.jpg)