$30 off During Our Annual Pro Sale. View Details »

RNAseq: A five course meal

RNAseq: A five course meal

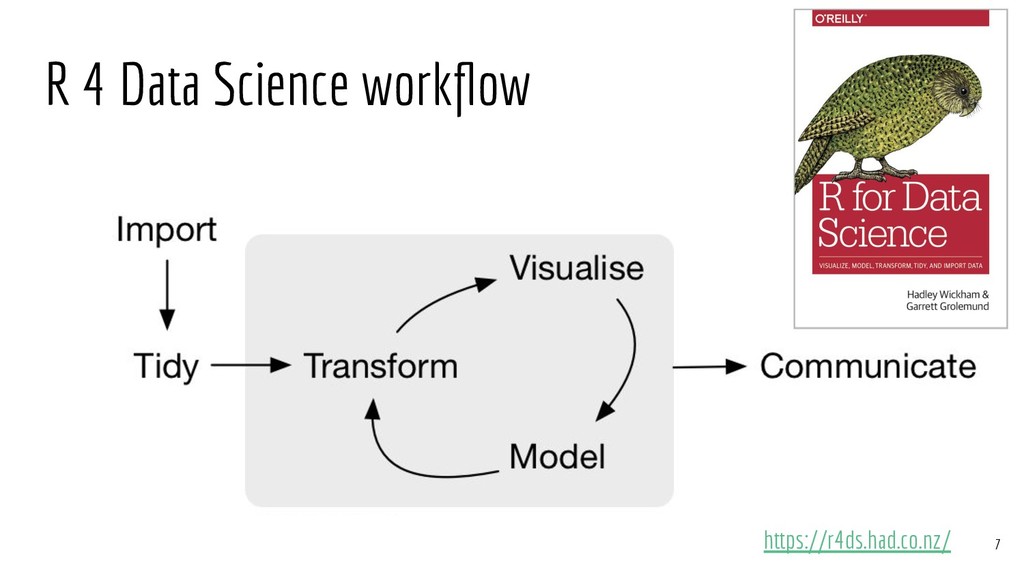
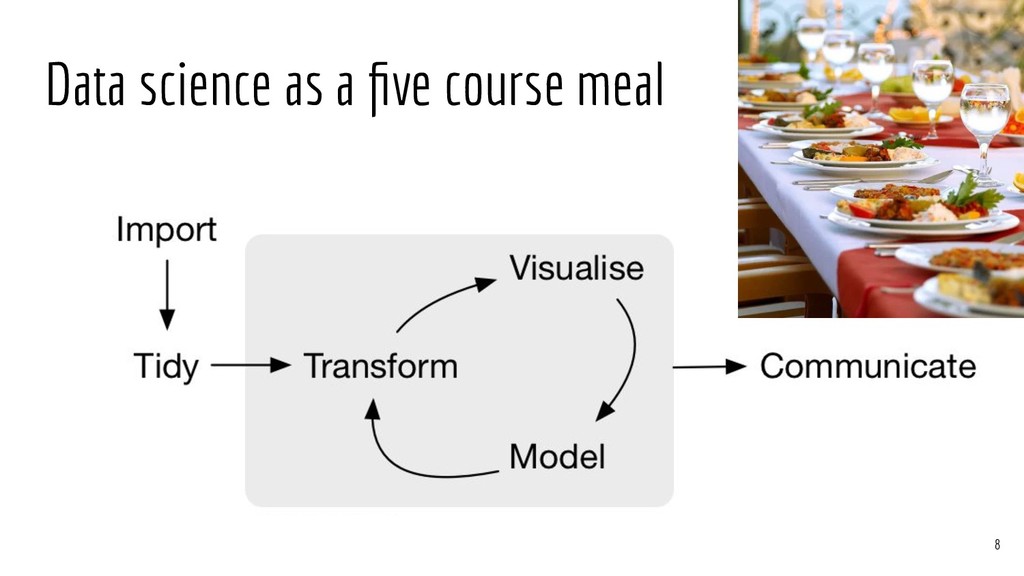
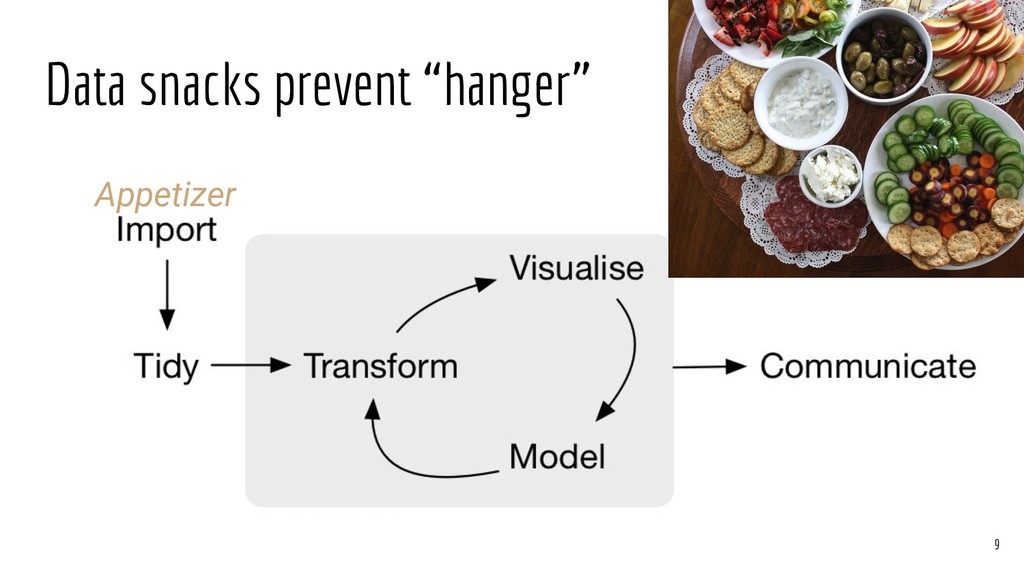
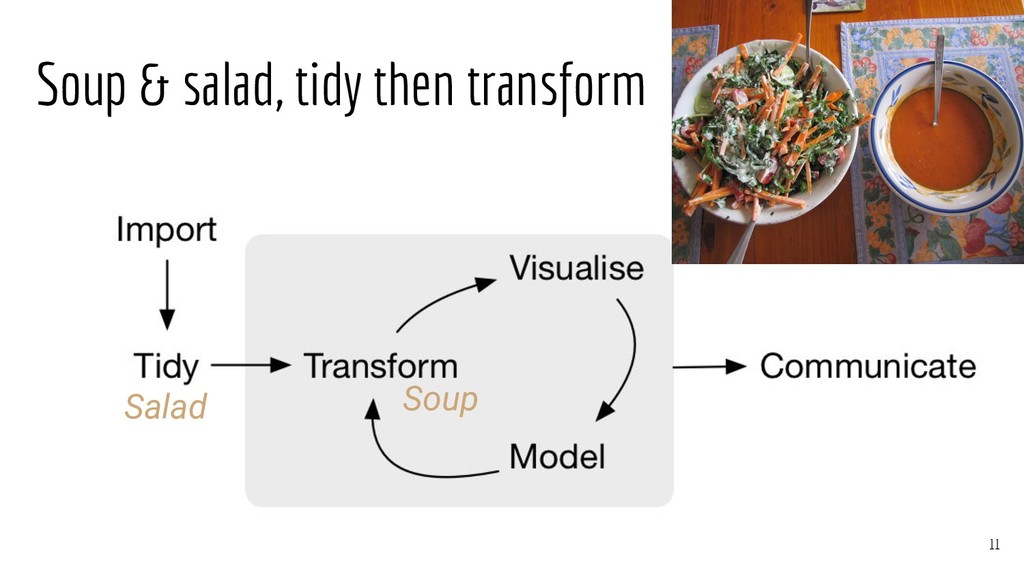
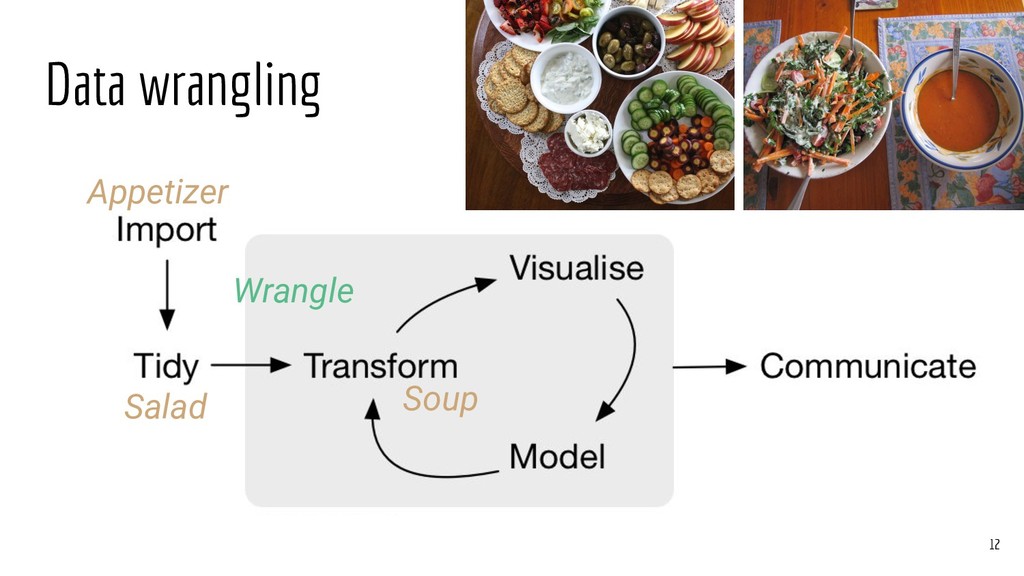
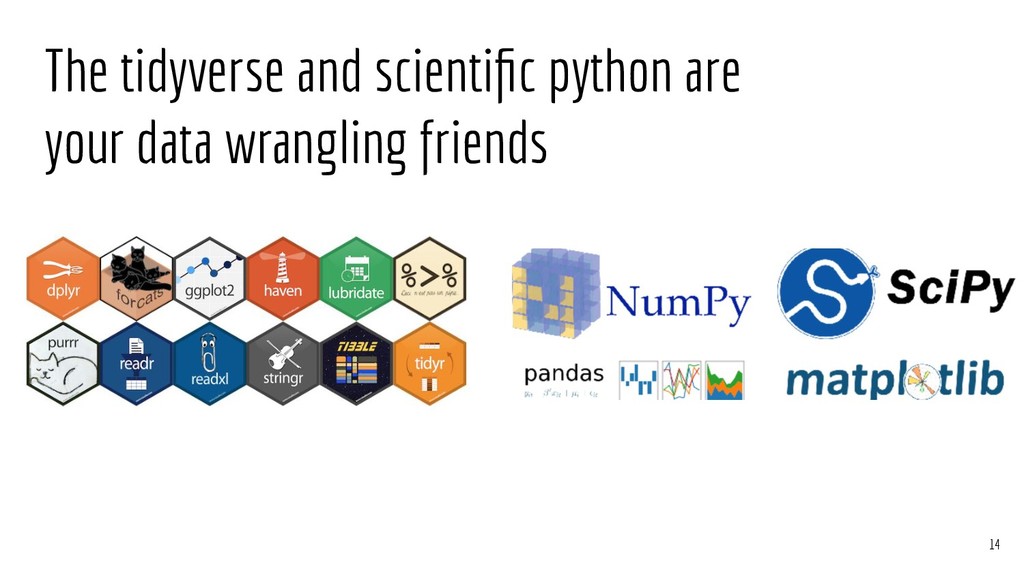
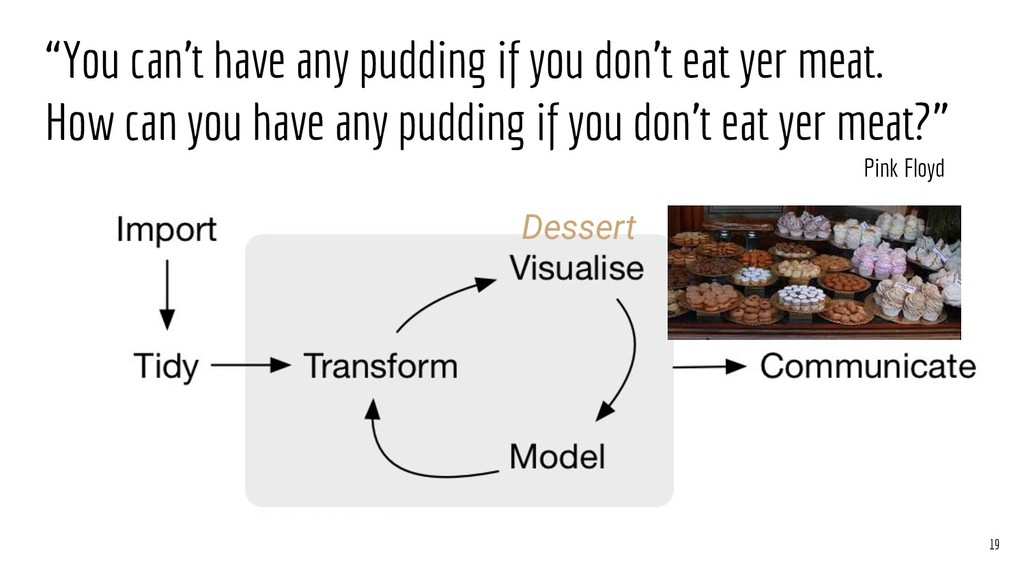
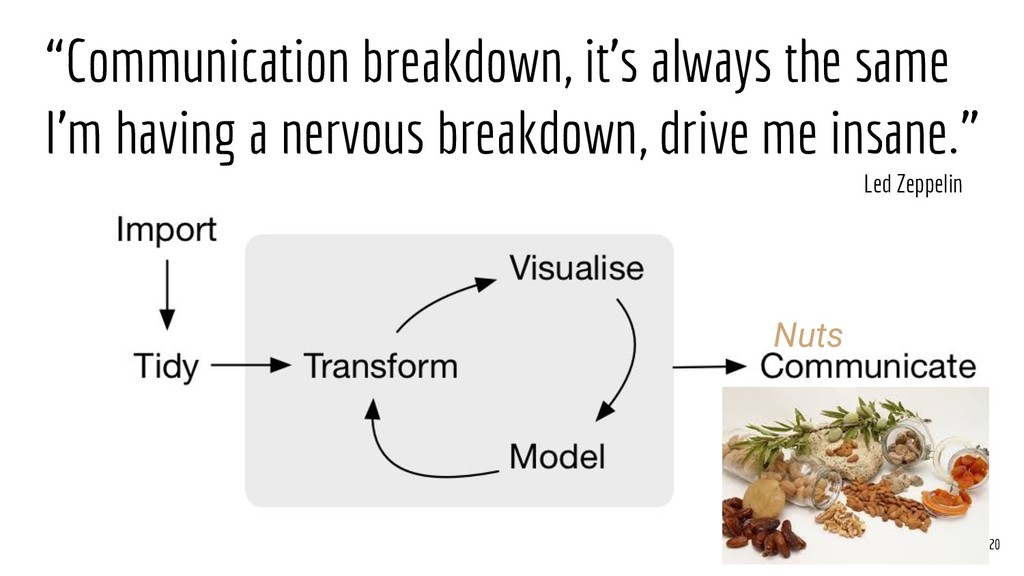
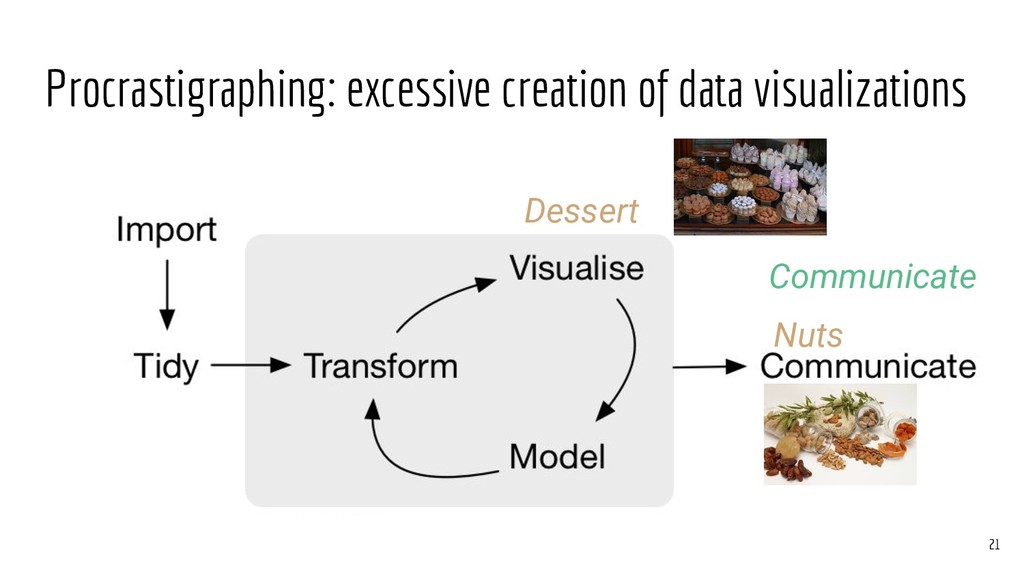
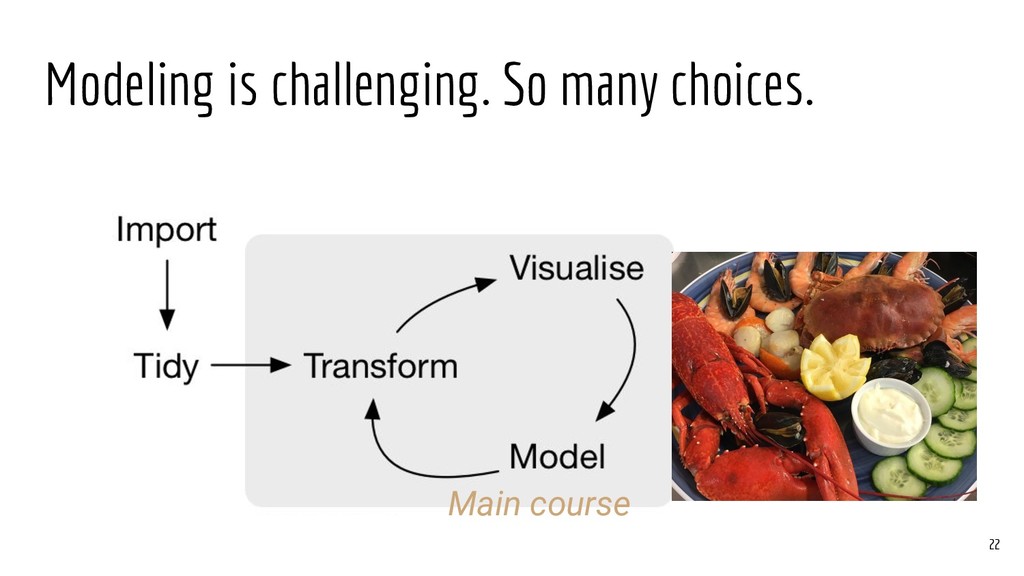
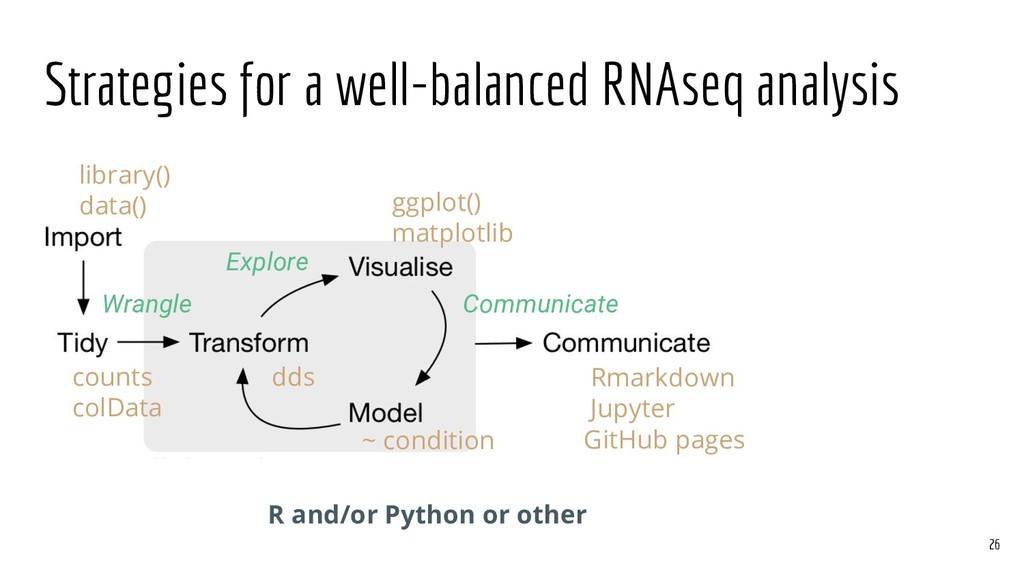
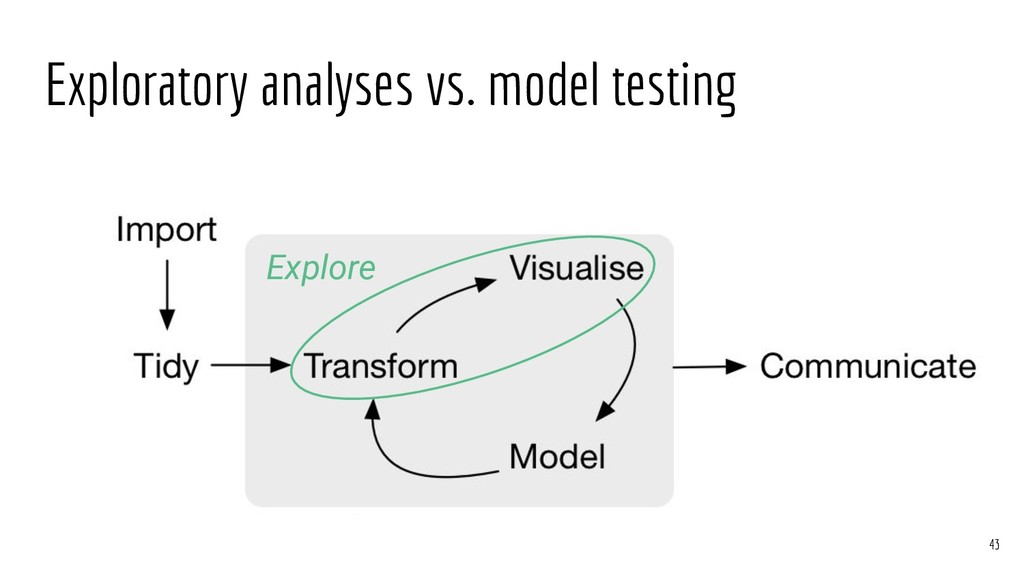
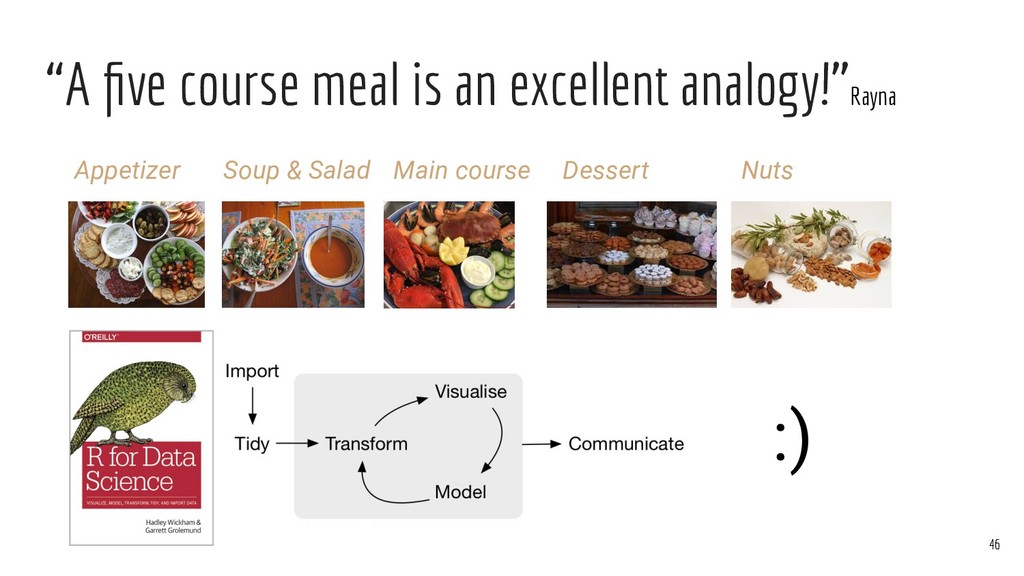
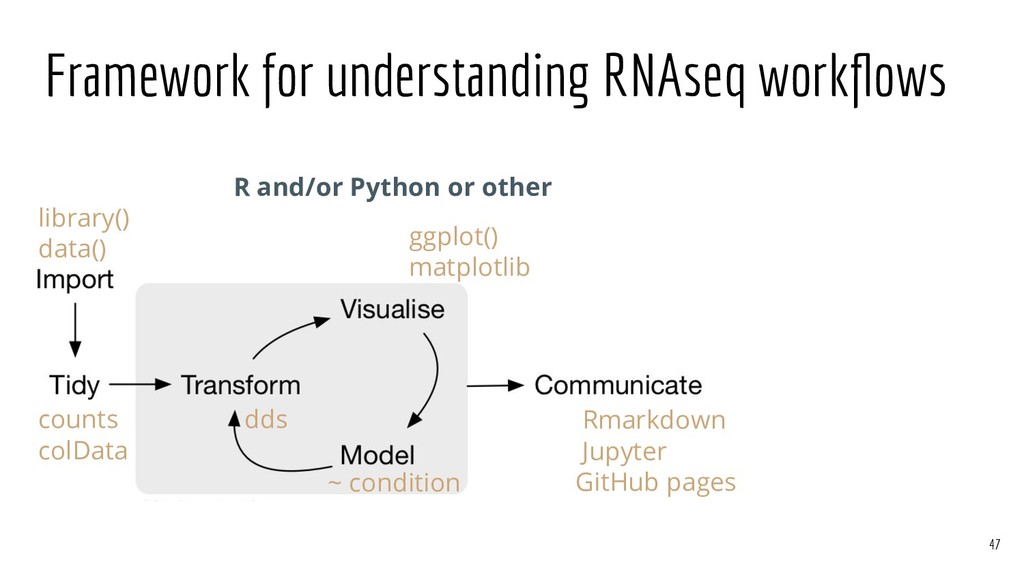
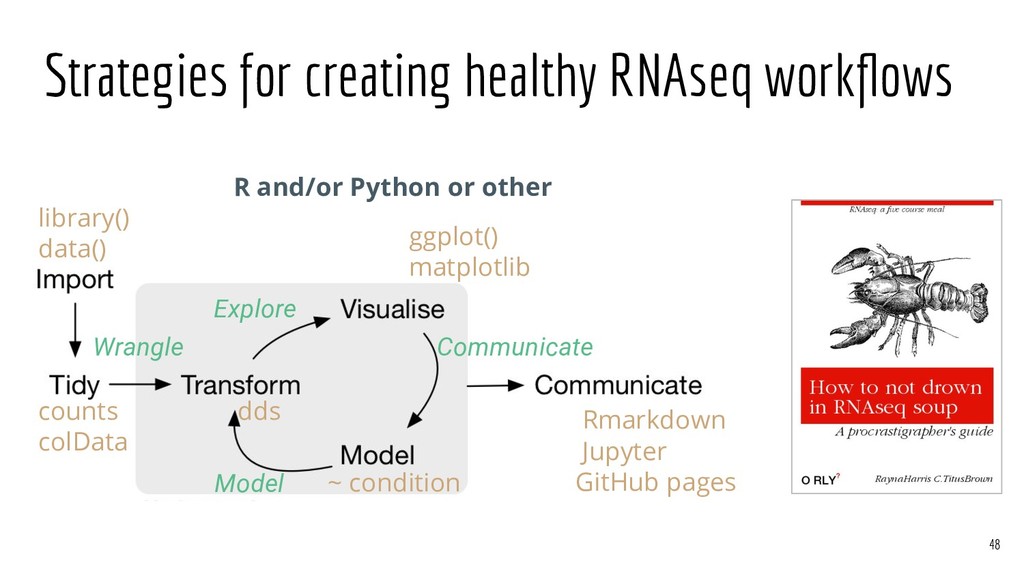
These slides are from a talk I gave as part of a two-week next-generation sequencing analysis workshop (https://angus.readthedocs.io/en/2019/). In this talk, I provide a framework for understanding RNA-seq workflows that is based on the R for Data Science workflow of "import, tidy, transform, visualize, model, and communicate" mantra (https://r4ds.had.co.nz/). I also provide strategies for "healthy" workflows by making analogies to a five-course meal.

Rayna M Harris

July 05, 2019
Tweet

More Decks by Rayna M Harris

Other Decks in Science

Transcript

  1. RNAseq:
    A five course meal
    #DIBSI2019
    Rayna M. Harris
    @raynamharris
    1

    View Slide

  2. Rayna M. Harris
    Postdoctoral scholar at UC Davis
    Scientist, Educator, Community Builder, Translator
    2

    View Slide

  3. Special thanks
    to the
    Data Intensive Biology Lab
    and the
    Birds, Brain, & Banter Lab
    http://calisilab.ucdavis.edu/
    http://ivory.idyll.org/lab/
    3

    View Slide

  4. I learned R and RNAseq in communities of practice
    The University of Texas at Austin, University California, Davis, Data Carpentry, Software Carpentry,
    The Carpentries-es, @cienciaPR @RLadiesGlobal @RLadiesBA @r4ds_es
    #DISBI2018
    4

    View Slide

  5. Who reads books?
    5

    View Slide

  6. Read R for Data Science
    6

    View Slide

  7. R 4 Data Science workflow
    https://r4ds.had.co.nz/ 7

    View Slide

  8. Data science as a five course meal
    8

    View Slide

  9. Data snacks prevent “hanger”
    Appetizer
    9

    View Slide

  10. Data snacks and source code
    `library()`
    `source()`
    `data()`
    Substantial, complex, noteworthy, valuable
    Provides insights into what follows
    10

    View Slide

  11. Soup & salad, tidy then transform
    Salad Soup
    11

    View Slide

  12. Data wrangling
    Appetizer
    Salad Soup
    Wrangle
    12

    View Slide

  13. Data wrangling
    Simultaneously fun and painful
    Learn from your mistakes
    Write good documentation
    Write tests
    13

    View Slide

  14. The tidyverse and scientific python are
    your data wrangling friends
    14

    View Slide

  15. The DESeq2 salad
    http://bioconductor.org/packages/devel/bioc/vignettes/DESeq2/inst/doc/DESeq2.html 15

    View Slide

  16. DESeq2 colData and counts
    https://biojupies.cloud/notebook/AHnOIzJEq 16

    View Slide

  17. ncol(counts) == nrow(colData)
    https://biojupies.cloud/notebook/AHnOIzJEq 17

    View Slide

  18. Summarized experiment soup
    http://bioconductor.org/packages/devel/bioc/vignettes/DESeq2/inst/doc/DESeq2.html#differential-expression-analysis 18

    View Slide

  19. “You can’t have any pudding if you don’t eat yer meat.
    How can you have any pudding if you don’t eat yer meat?”
    Pink Floyd
    Dessert
    19

    View Slide

  20. “Communication breakdown, it’s always the same
    I’m having a nervous breakdown, drive me insane.”
    Led Zeppelin
    Nuts
    20

    View Slide

  21. Procrastigraphing: excessive creation of data visualizations
    Communicate
    Nuts
    Dessert
    21

    View Slide

  22. Modeling is challenging. So many choices.
    Main course
    22

    View Slide

  23. If you were at a banquet, would you order?
    A. Lobster
    B. Steak
    C. Lobster and steak
    D. Other
    E. Lobster, steak, and other
    23

    View Slide

  24. If you were an RNAseq workflow, would you use:
    A. R
    B. Python
    C. R and Python
    D. Other
    E. An R/Python/other mix
    24

    View Slide

  25. FlavoRs of differential gene expression models
    library("DESeq2")
    dds <- DESeqDataSetFromMatrix(countData = cts,
    colData = coldata,
    design = ~ condition)
    results(dds, contrast=c("condition","B","A"))
    http://bioconductor.org/packages/devel/bioc/vignettes/DESeq2/inst/doc/DESeq2.html#differential-expression-analysis
    25

    View Slide

  26. Strategies for a well-balanced RNAseq analysis
    R and/or Python or other
    library()
    data()
    counts dds
    colData
    Rmarkdown
    Jupyter
    GitHub pages
    ~ condition
    Wrangle
    Explore
    ggplot()
    matplotlib
    Communicate
    26

    View Slide

  27. BioJupies for instant
    RNA-seq visualizations
    in the cloud
    https://biojupies.cloud/notebook/AHnOIzJEq
    https://twitter.com/i/status/1062745599538282498
    27

    View Slide

  28. https://biojupies.cloud/notebook/AHnOIzJEq
    Quickly assess sample quality and variation
    28

    View Slide

  29. https://biojupies.cloud/notebook/AHnOIzJEq
    Quickly view results of gene ontology enrichment analyses
    29

    View Slide

  30. https://biojupies.cloud/notebook/AHnOIzJEq
    Quickly explore patterns of differential gene expression
    30

    View Slide

  31. https://biojupies.cloud/notebook/AHnOIzJEq
    But how many dots are red and blue?
    ?
    ?
    31

    View Slide

  32. https://biojupies.cloud/notebook/AHnOIzJEq
    But, what if I want to view many volcano plots?
    32

    View Slide

  33. Convert .Rmd files
    to GitHub pages to
    communicate results
    https://macmanes-lab.github.io/austinCORT/
    33

    View Slide

  34. Open source options for programming
    34

    View Slide

  35. My progress: from a novice with data and tools
    https://github.com/raynamharris/DissociationTest
    Harris, Kao, Alarcón, Hofmann, Fenton 2017
    https://www.biorxiv.org/content/10.1101/153585v1
    35

    View Slide

  36. To a practitioner with reproducible workflows
    https://github.com/raynamharris/DissociationTest
    Harris, Kao, Alarcón, Hofmann, Fenton 2019
    https://onlinelibrary.wiley.com/doi/10.1002/hipo.23095
    36

    View Slide

  37. Onward to experiments with many factors
    https://github.com/macmanes-lab/DoveParentsRNAseq/
    Made for a poster at the Society for Behavioral Neuroendocrinology
    37

    View Slide

  38. Identify time-like changes in specific genes
    https://github.com/macmanes-lab/DoveParentsRNAseq/
    38

    View Slide

  39. Find meaningful principle components of variation
    https://github.com/macmanes-lab/DoveParentsRNAseq/
    39

    View Slide

  40. Create functions to run all pairwise comparisons
    `contrast = c(“treatment”, “varB”, “varA”)`
    https://github.com/macmanes-lab/DoveParentsRNAseq/
    40

    View Slide

  41. The risk of unintentional p-hacking
    http://www.stat.columbia.edu/~gelman/research/unpublished/p_hacking.pdf
    41

    View Slide

  42. The risk of unintentional p-hacking
    http://www.stat.columbia.edu/~gelman/research/unpublished/p_hacking.pdf
    42

    View Slide

  43. Exploratory analyses vs. model testing
    Explore
    43

    View Slide

  44. 60% 20% 20%
    training set query set testing set
    Should we be analyzing all the data all the time?
    44

    View Slide

  45. “Soup to nuts: setting up a new RNAseq analysis”Titus
    45

    View Slide

  46. “A five course meal is an excellent analogy!”Rayna
    Appetizer Soup & Salad Dessert Nuts
    Main course
    :)
    46

    View Slide

  47. Framework for understanding RNAseq workflows
    R and/or Python or other
    library()
    data()
    counts dds
    colData
    ggplot()
    matplotlib
    Rmarkdown
    Jupyter
    GitHub pages
    ~ condition
    47

    View Slide

  48. Strategies for creating healthy RNAseq workflows
    R and/or Python or other
    library()
    data()
    counts dds
    colData
    ggplot()
    matplotlib
    Rmarkdown
    Jupyter
    GitHub pages
    ~ condition
    Communicate
    Wrangle
    Explore
    Model
    48

    View Slide

  49. What questions
    do you have?
    @raynamharris
    49

    View Slide