Book—Energy Markets in Flux: What Does It Mean for Ethanol?
Presenter: Kevin Book, Managing Director, ClearView Energy Partners
Timing: Thursday, Feb. 26, 2026 (10:15 am - 10:45 am)
Session: Energy Markets in Flux: What Does It Mean for Ethanol Producers?
change. Analyst Certifications I hereby certify that the views expressed in this presentation accurately reflect my personal views as of the date of this presentation. I further certify that no part of my compensation was, is or will be directly or indirectly related to the specific recommendations or views contained in this presentation. By: Kevin Book Disclosures The opinions, forecasts, recommendations, projections and interpretations of macro events contained in this report are those of the analysts preparing this report and are based upon information available to them as of the publication date of this report. The analysts preparing this report based the opinions, forecasts, recommendations, projections and interpretations of macro events contained herein on sources they believe to be accurate and reliable, but completeness and/or accuracy is neither implied nor guaranteed. The opinions, forecasts, recommendations projections and interpretations of macro events contained herein are subject to change without notice. The analysts preparing this report are not registered lobbyists and do not advocate or lobby for any particular policy action on behalf of clients. Although this report may mention specific companies by name and/or specific industries and industry sectors, this report was not prepared, is not intended and should not be interpreted as a research report regarding the equity securities of any company. (c) 2009-2026 ClearView Energy Partners, LLC. 2 FEBRUARY 26, 2026
inFOMO • Politics and economics of drillers vs. drivers • Shale patch and the campaign pitch • Upside surprises and downside risks • Vehicle transition after OBBBA and climate rollbacks 3 FEBRUARY 26, 2026
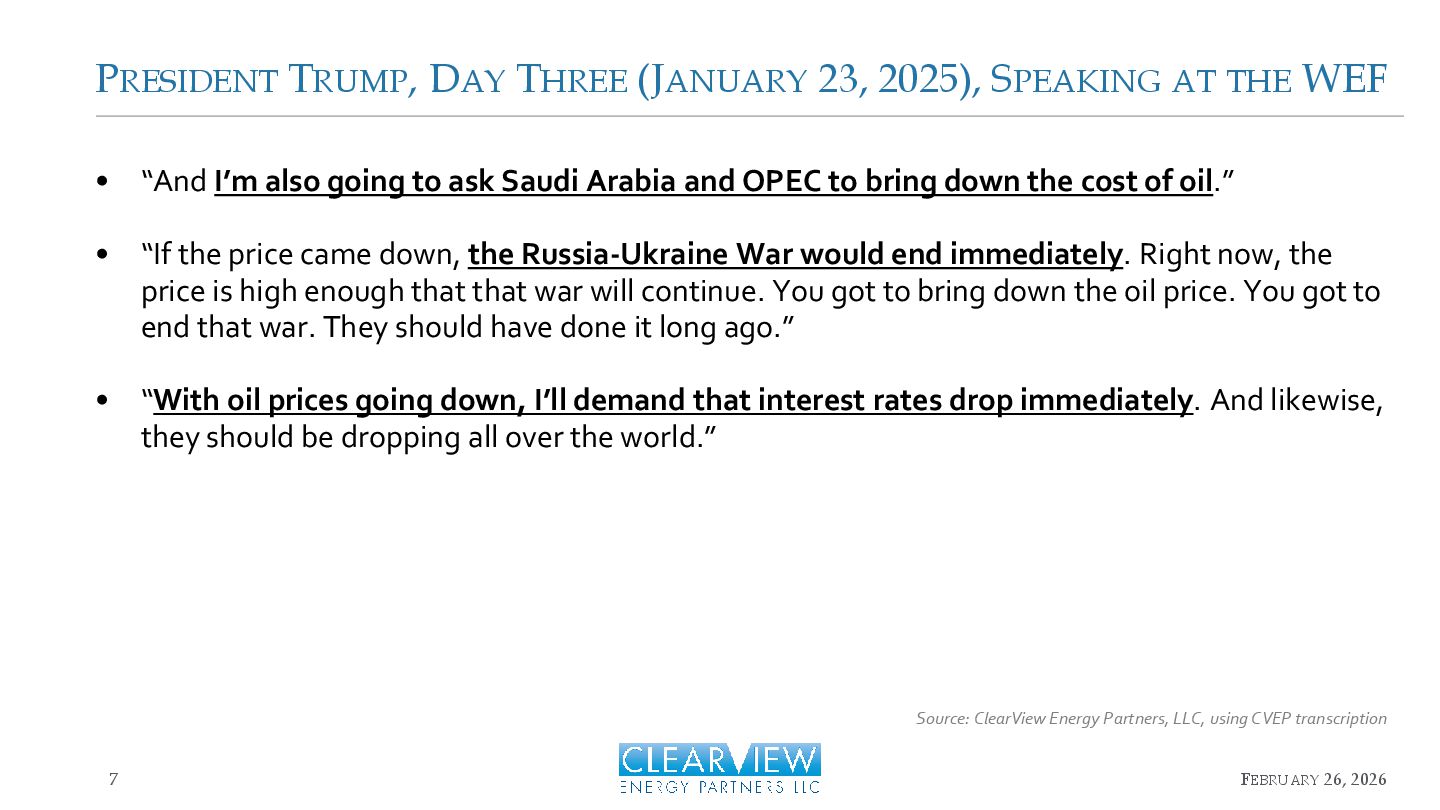
WEF 7 FEBRUARY 26, 2026 Source: ClearView Energy Partners, LLC, using CVEP transcription • “And I’m also going to ask Saudi Arabia and OPEC to bring down the cost of oil.” • “If the price came down, the Russia-Ukraine War would end immediately. Right now, the price is high enough that that war will continue. You got to bring down the oil price. You got to end that war. They should have done it long ago.” • “With oil prices going down, I’ll demand that interest rates drop immediately. And likewise, they should be dropping all over the world.”
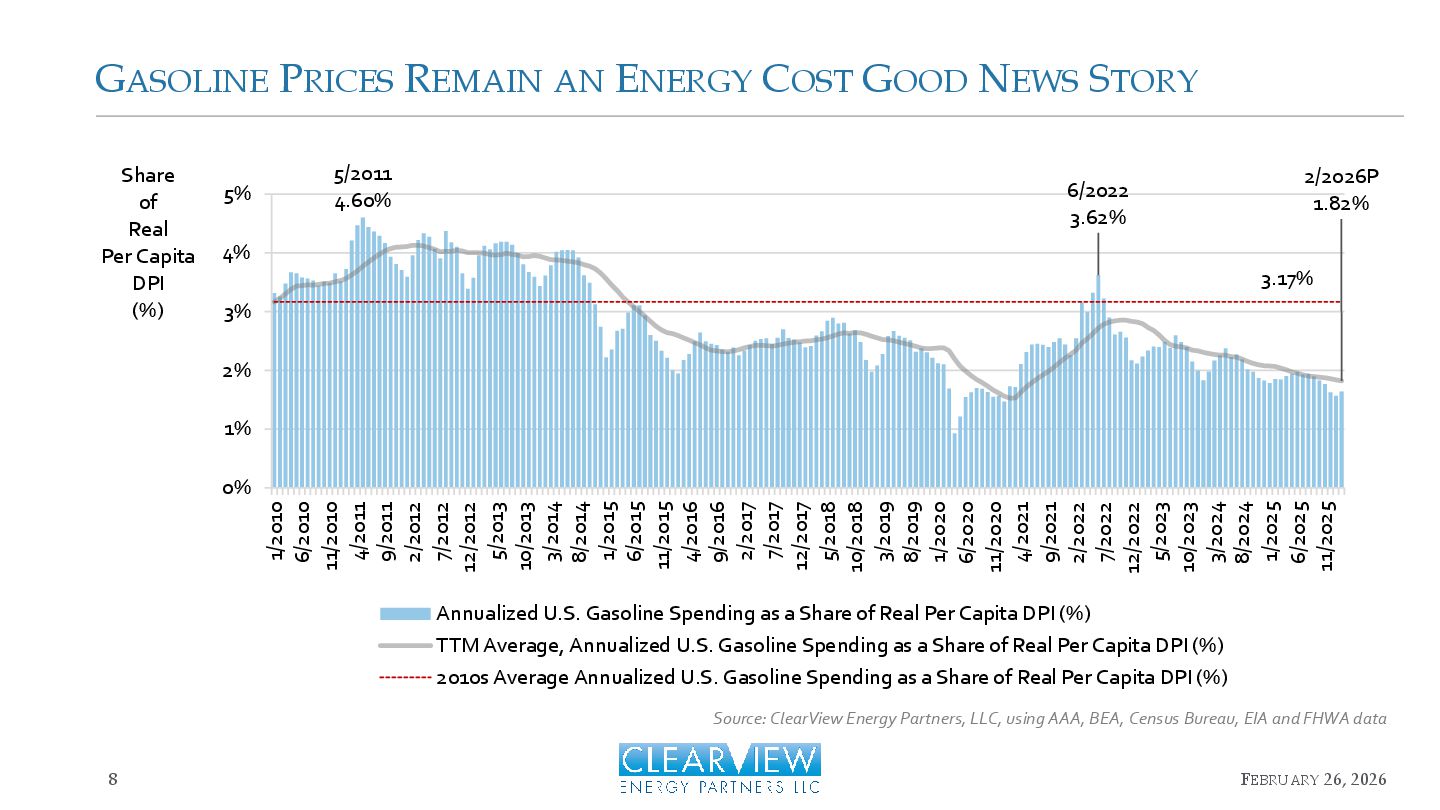
FEBRUARY 26, 2026 5/2011 4.60% 6/2022 3.62% 2/2026P 1.82% 3.17% 0% 1% 2% 3% 4% 5% 1/2010 6/2010 11/2010 4/2011 9/2011 2/2012 7/2012 12/2012 5/2013 10/2013 3/2014 8/2014 1/2015 6/2015 11/2015 4/2016 9/2016 2/2017 7/2017 12/2017 5/2018 10/2018 3/2019 8/2019 1/2020 6/2020 11/2020 4/2021 9/2021 2/2022 7/2022 12/2022 5/2023 10/2023 3/2024 8/2024 1/2025 6/2025 11/2025 Share of Real Per Capita DPI (%) Annualized U.S. Gasoline Spending as a Share of Real Per Capita DPI (%) TTM Average, Annualized U.S. Gasoline Spending as a Share of Real Per Capita DPI (%) 2010s Average Annualized U.S. Gasoline Spending as a Share of Real Per Capita DPI (%) Source: ClearView Energy Partners, LLC, using AAA, BEA, Census Bureau, EIA and FHWA data
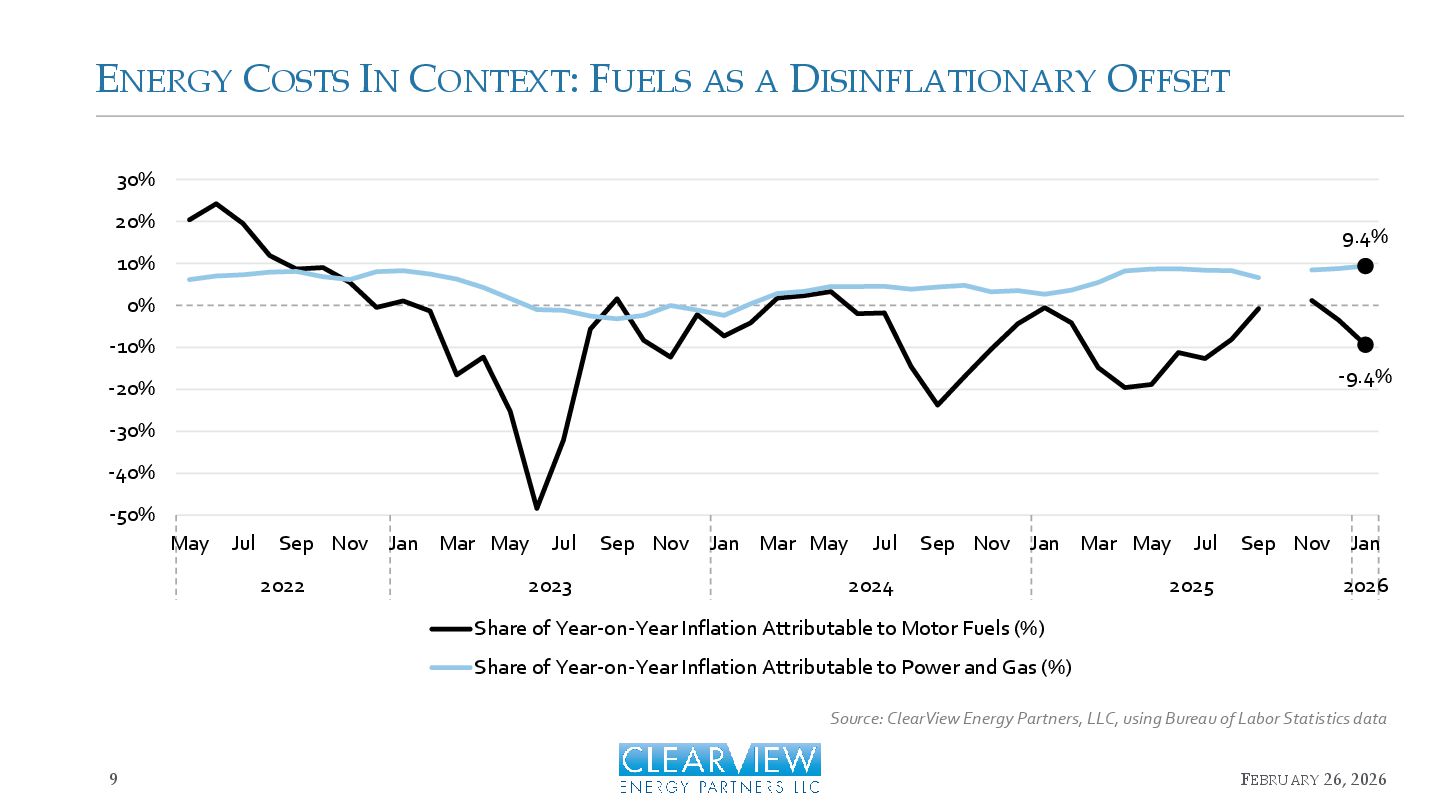
FEBRUARY 26, 2026 Source: ClearView Energy Partners, LLC, using Bureau of Labor Statistics data -9.4% 9.4% -50% -40% -30% -20% -10% 0% 10% 20% 30% May Jul Sep Nov Jan Mar May Jul Sep Nov Jan Mar May Jul Sep Nov Jan Mar May Jul Sep Nov Jan 2022 2023 2024 2025 2026 Share of Year-on-Year Inflation Attributable to Motor Fuels (%) Share of Year-on-Year Inflation Attributable to Power and Gas (%)
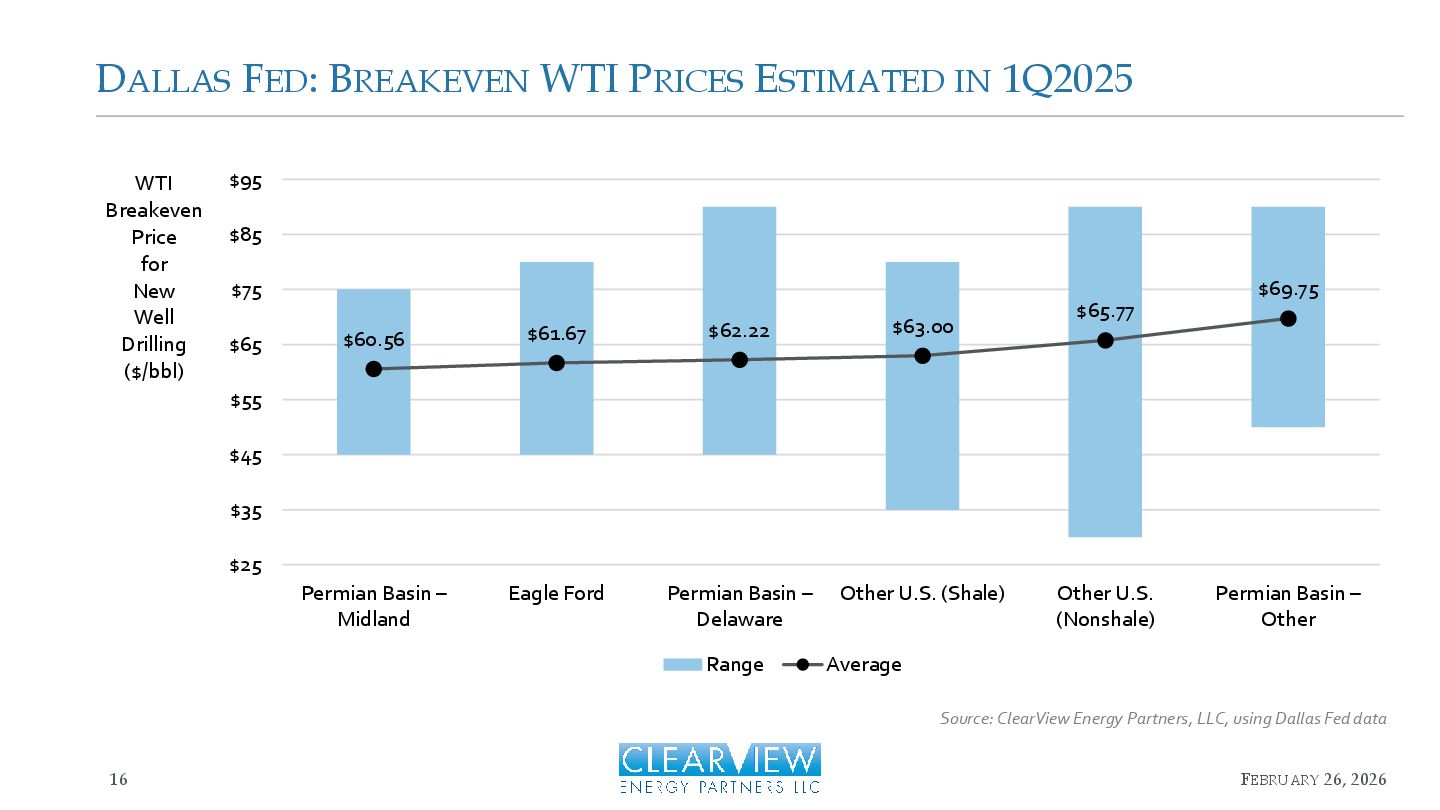
26, 2026 Source: ClearView Energy Partners, LLC, using Dallas Fed data $60.56 $61.67 $62.22 $63.00 $65.77 $69.75 $25 $35 $45 $55 $65 $75 $85 $95 Permian Basin – Midland Eagle Ford Permian Basin – Delaware Other U.S. (Shale) Other U.S. (Nonshale) Permian Basin – Other WTI Breakeven Price for New Well Drilling ($/bbl) Range Average
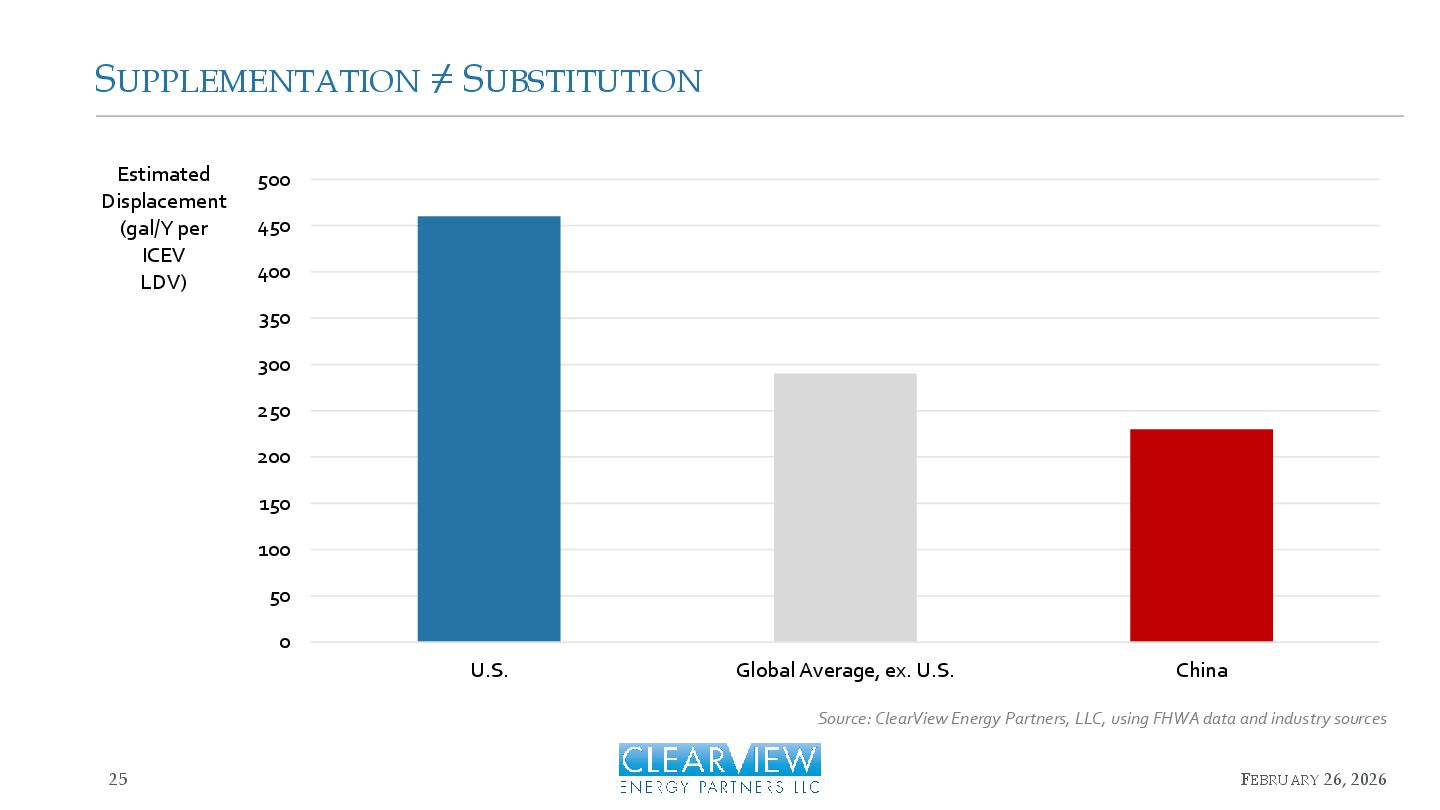
Partners, LLC, using FHWA data and industry sources 0 50 100 150 200 250 300 350 400 450 500 U.S. Global Average, ex. U.S. China Estimated Displacement (gal/Y per ICEV LDV)
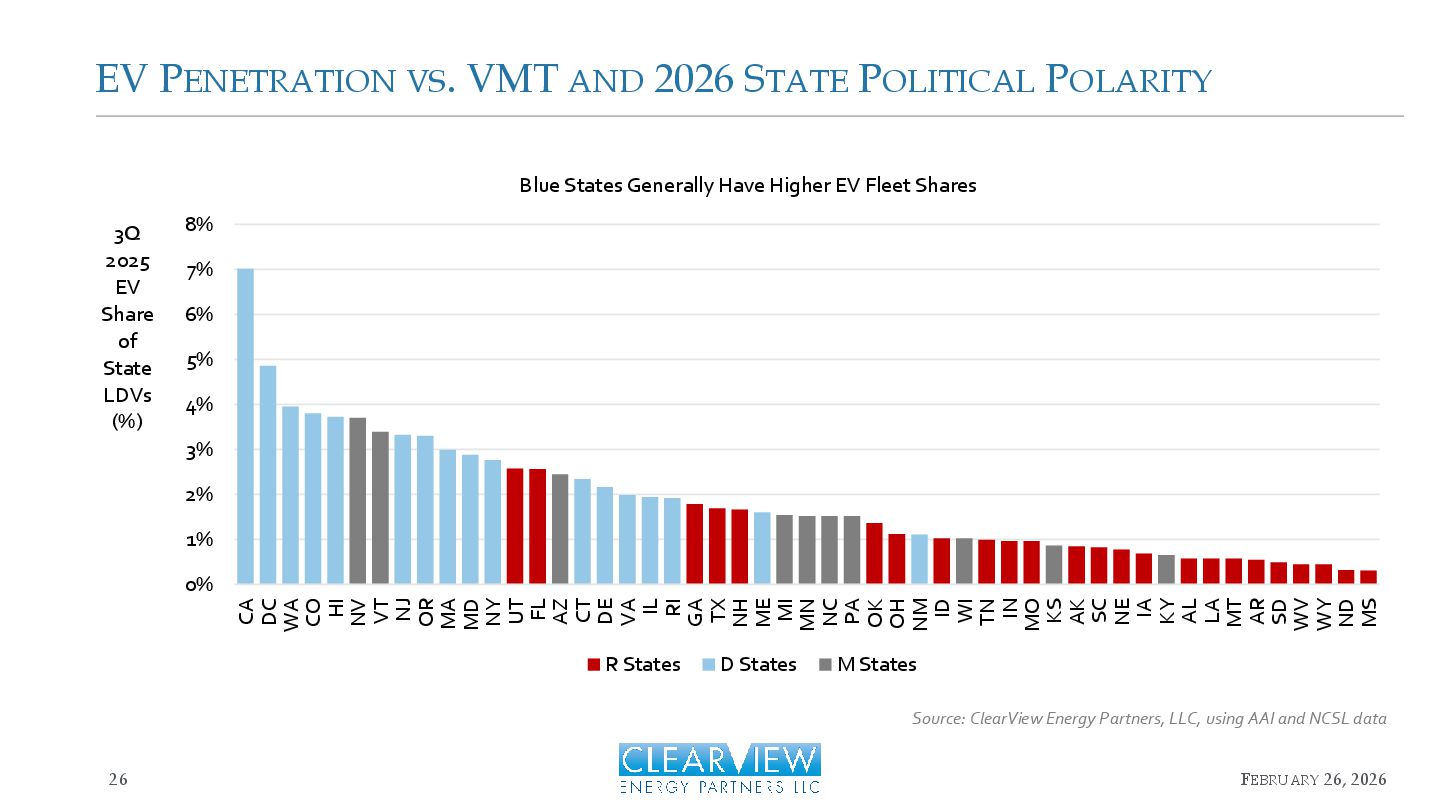
FEBRUARY 26, 2026 Source: ClearView Energy Partners, LLC, using AAI and NCSL data 0% 1% 2% 3% 4% 5% 6% 7% 8% CA DC WA CO HI NV VT NJ OR MA MD NY UT FL AZ CT DE VA IL RI GA TX NH ME MI MN NC PA OK OH NM ID WI TN IN MO KS AK SC NE IA KY AL LA MT AR SD WV WY ND MS 3Q 2025 EV Share of State LDVs (%) Blue States Generally Have Higher EV Fleet Shares R States D States M States
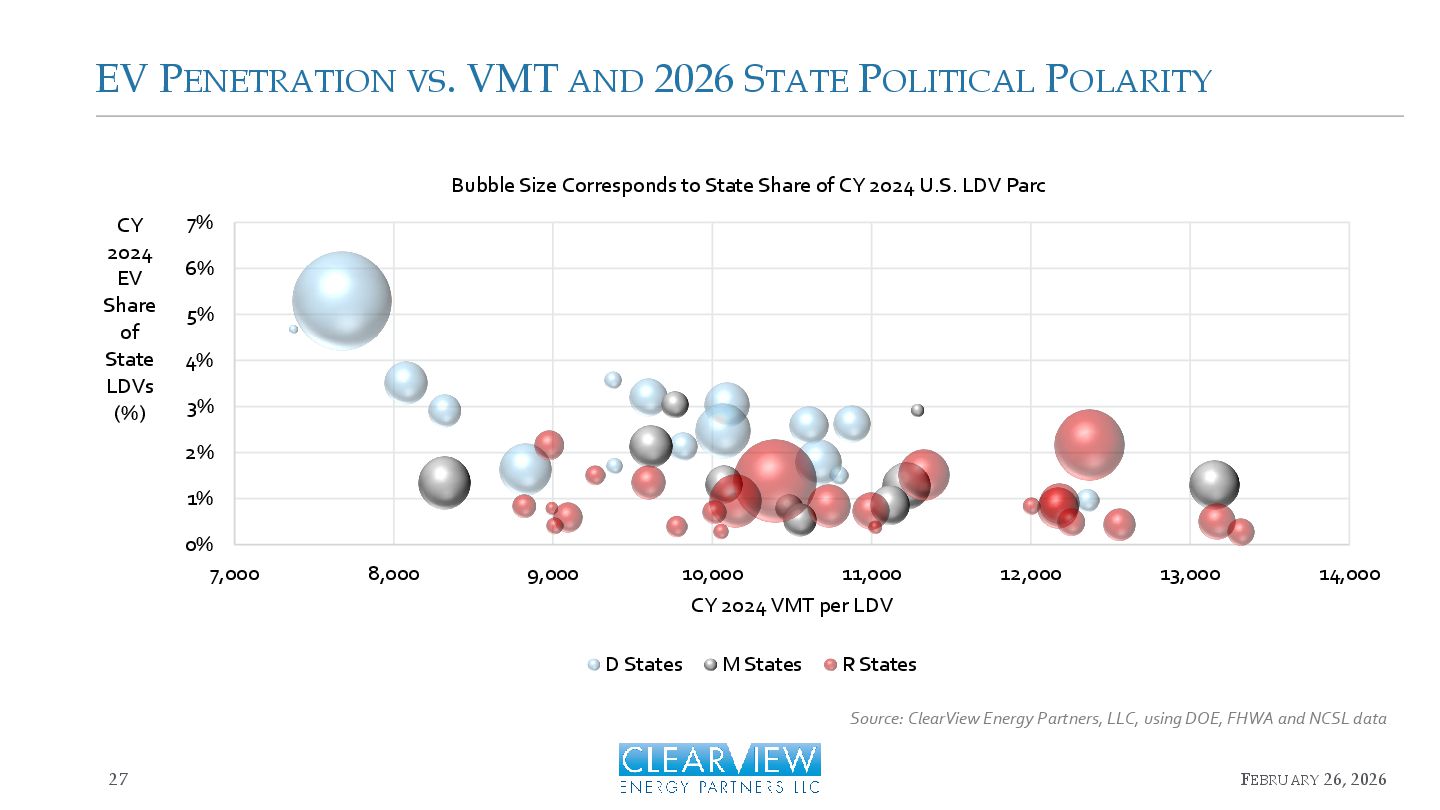
FEBRUARY 26, 2026 Source: ClearView Energy Partners, LLC, using DOE, FHWA and NCSL data 0% 1% 2% 3% 4% 5% 6% 7% 7,000 8,000 9,000 10,000 11,000 12,000 13,000 14,000 CY 2024 EV Share of State LDVs (%) CY 2024 VMT per LDV Bubble Size Corresponds to State Share of CY 2024 U.S. LDV Parc D States M States R States