Upgrade to Pro — share decks privately, control downloads, hide ads and more …

Machine Learning Anomaly Detection for the Elastic Stack

Machine Learning Anomaly Detection for the Elastic Stack

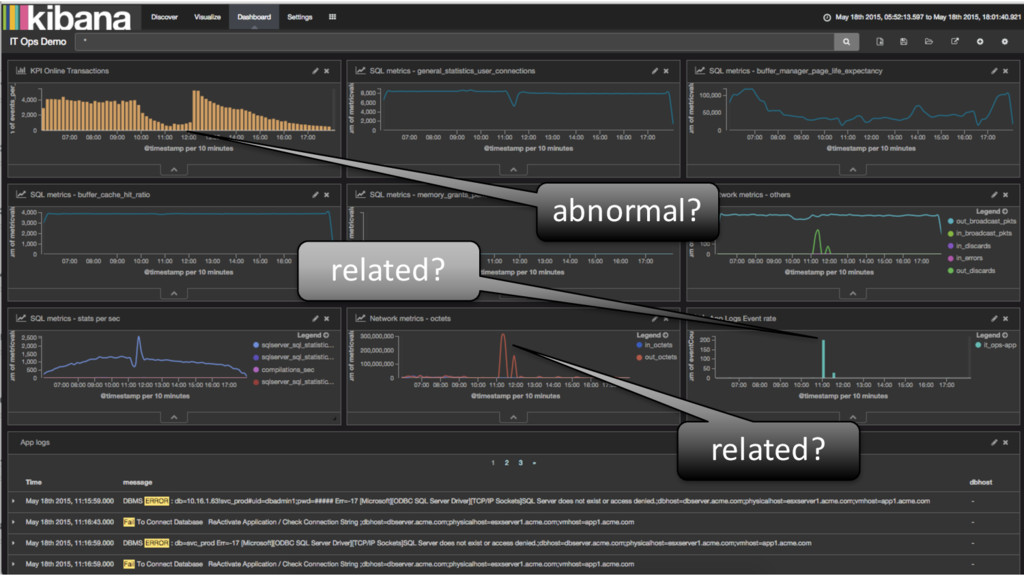
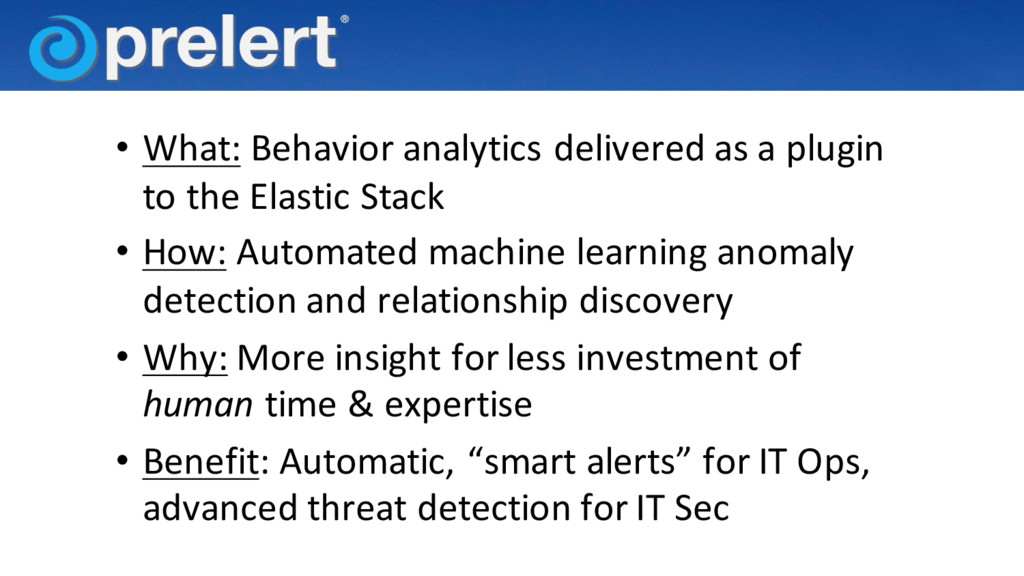
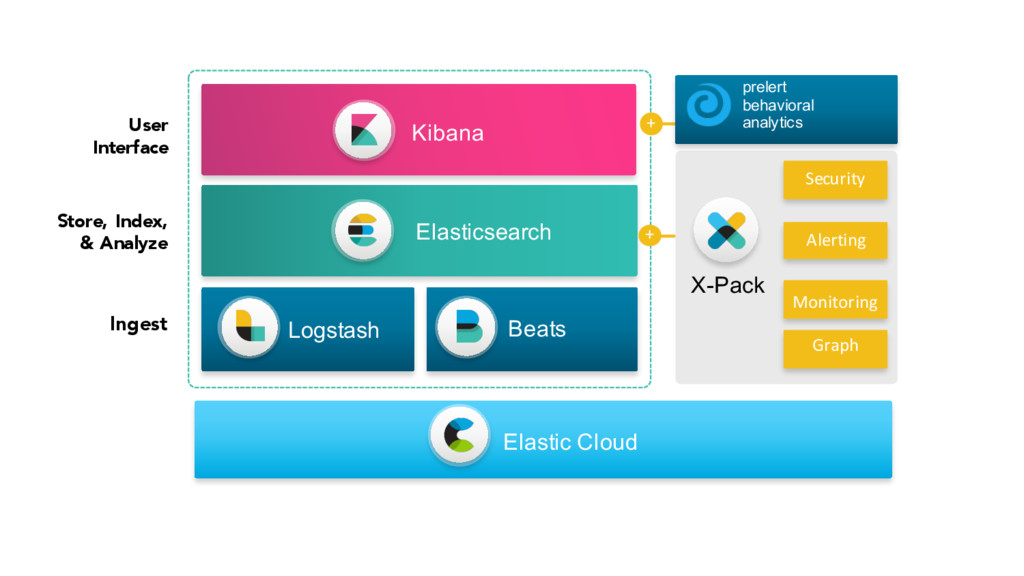
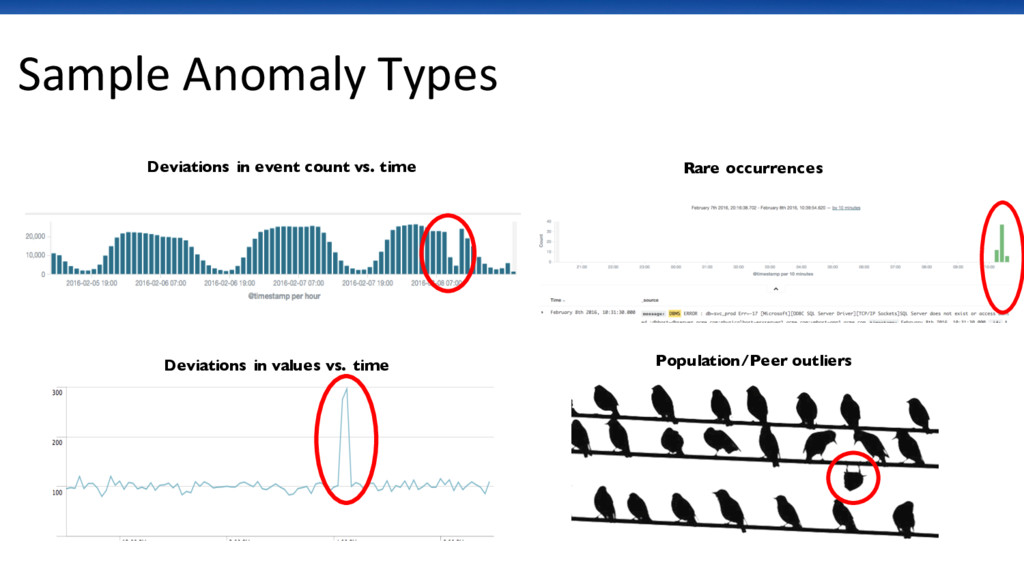
Presented at some MeetUps, this presentation describes the basics around how Prelert's Machine Learning Anomaly Detection adds value to data within the Elastic Stack. This behavior analytics solution allows for easier "automatic" alerts for IT Operations/APM/Log Management as well as advanced threat detection for Security Operations teams.

richcollier

March 25, 2016
Tweet

Other Decks in Technology

Transcript

  1. • What: Behavior analytics delivered as a plugin to the

    Elastic Stack • How: Automated machine learning anomaly detection and relationship discovery • Why: More insight for less investment of human time & expertise • Benefit: Automatic, “smart alerts” for IT Ops, advanced threat detection for IT Sec
  2. 5 Elastic Cloud Security Monitoring Alerting Graph X-Pack Kibana User

    Interface Elasticsearch Store, Index, & Analyze Ingest Logstash Beats + prelert behavioral analytics +
  3. Sample Anomaly Types Deviations in event count vs. time Deviations

    in values vs. time Rare occurrences Population/Peer outliers
  4. Sample Anomaly Types Deviations in event count vs. time Deviations

    in values vs. time Rare occurrences of things Population/Peer outliers Q: What’s the Approach? A: Predictions via Probability Models
  5. • How could I accurately predict how much Postal-mail you

    are likely to get delivered to your home tomorrow? • And, how would I know if the amount you actually received was “abnormal”? Probability Models- an Analogy
  6. • A method to determine what’s normal before one can

    assess what is abnormal. • A method that allows prediction based on likelihood A practical methodology would involve…
  7. • Sit on the front porch • Record the number

    of items each day, for: • 1 day? • 1 week? • 1 month? • 1 year? Constructing the Model
  8. • Every model needs to be unique per “household” •

    Models have different “shapes” (not always a bell curve) • The model doesn’t rely on continued access to past raw data • Can use the model to determine what’s unexpected Notice: zero pieces of mail? fifteen pieces of mail?
  9. • # Pieces of mail = # events of a

    certain type • number of failed logins • number of errors of different types • number of events with certain status codes • Or, performance metrics • response time • utilization % Relate back to IT and Security data
  10. How does one pick a model? Which one best fits

    your data? source: “Doing Data Science” O’Neil & Schutt
  11. Machine learning picks it for you • Prelert uses sophisticated

    machine- learning techniques to best-fit the right statistical model for your data. • Better models = better outlier detection = less false alarms
  12. Unusual vs. Population Deviations in Counts or Values Rare Events

    = = = “min(purchase_amt)” “count by error_type” “max(responsetime) by host” “rare by EventID” “rare by process” “count by status over user” “sum(bytes) over client_ip” Examples function, field, clause Detector Detector Detector Parameterized Configuration