Upgrade to Pro — share decks privately, control downloads, hide ads and more …

Pushing PostgreSQL to the Limit: How to Benchma...

Pushing PostgreSQL to the Limit: How to Benchmark Hardware with Postgres

Hardware vendors and cloud providers often tout massive IOPS and throughput capabilities, leaving DBAs wondering if the CPU, the storage, or PostgreSQL itself is the actual bottleneck during intense workloads. Whether you are validating new NVMe arrays, comparing cloud block storage options, or sizing instances for an upcoming migration, guessing is a dangerous game.

Attendees will learn how to build an impartial benchmarking harness tailored for Postgres. We will cover crucial, often-missed PostgreSQL gotchas—from navigating archive_mode overhead and autovacuum interference, to taming checkpoint storms that skew synthetic tests. You'll leave knowing how to correctly instrument system and database metrics to definitively prove whether a performance plateau is caused by storage limits, CPU bandwidth, or internal PostgreSQL lock contention.

Presented at PG Summit US in NYC on 2026-10-01

Avatar for Richard Yen

Richard Yen

October 01, 2026

More Decks by Richard Yen

Other Decks in Technology

Transcript

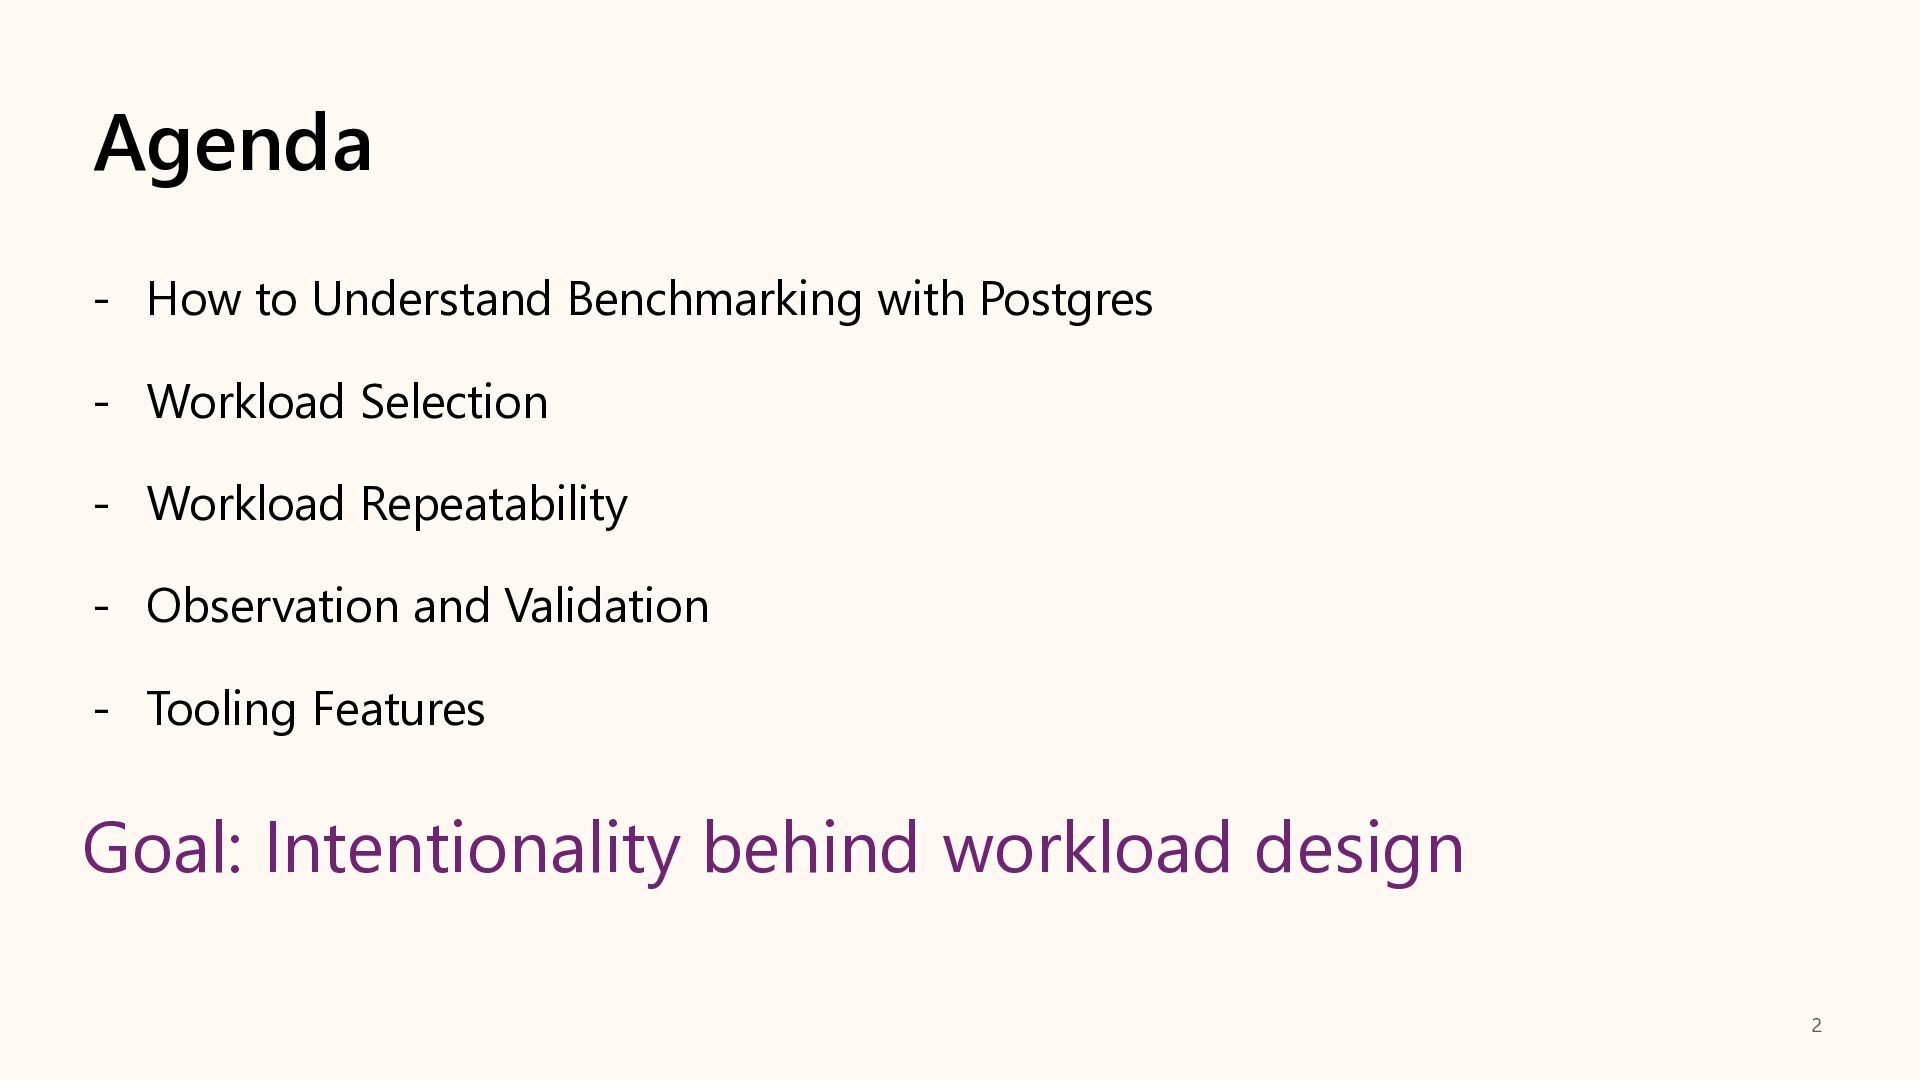
  1. Agenda - How to Understand Benchmarking with Postgres - Workload

    Selection - Workload Repeatability - Observation and Validation - Tooling Features Goal: Intentionality behind workload design 2
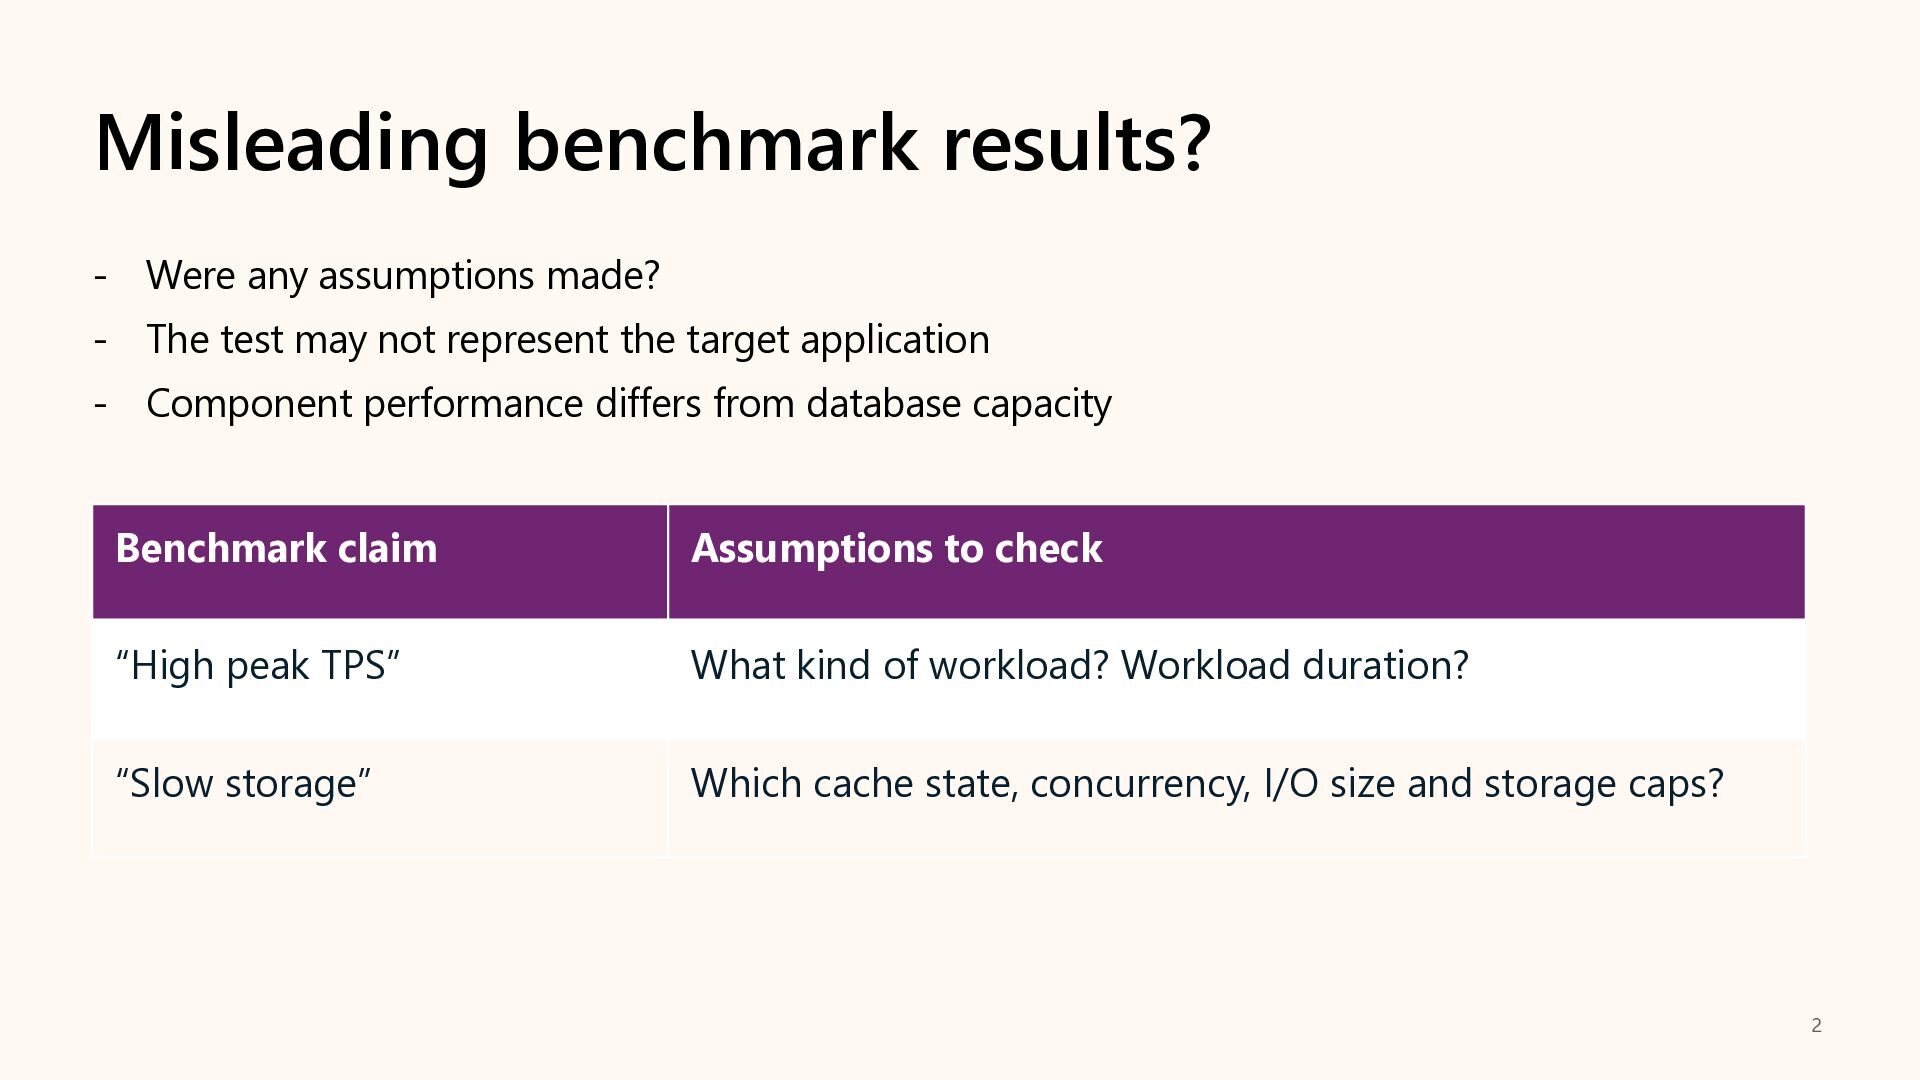
  2. Misleading benchmark results? - Were any assumptions made? - The

    test may not represent the target application - Component performance differs from database capacity Benchmark claim Assumptions to check “High peak TPS” What kind of workload? Workload duration? “Slow storage” Which cache state, concurrency, I/O size and storage caps? 2
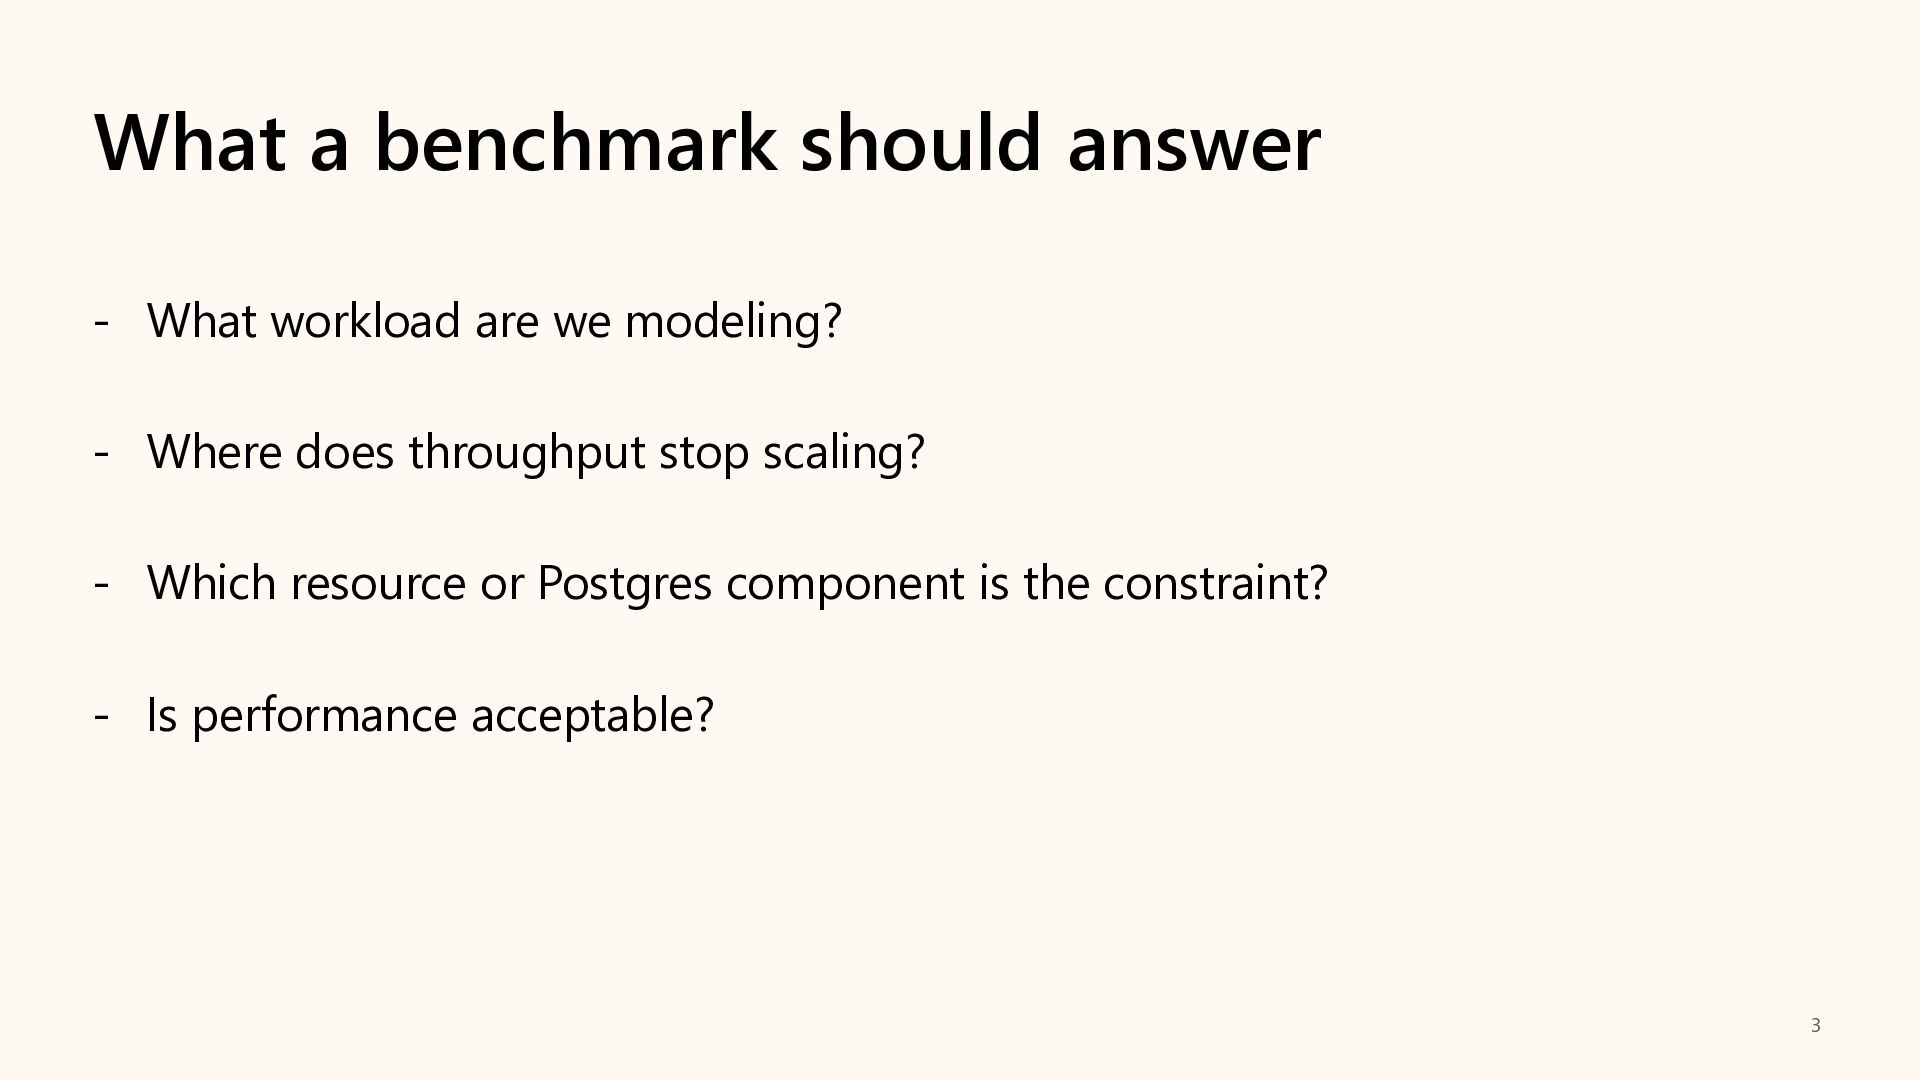
  3. What a benchmark should answer - What workload are we

    modeling? - Where does throughput stop scaling? - Which resource or Postgres component is the constraint? - Is performance acceptable? 3
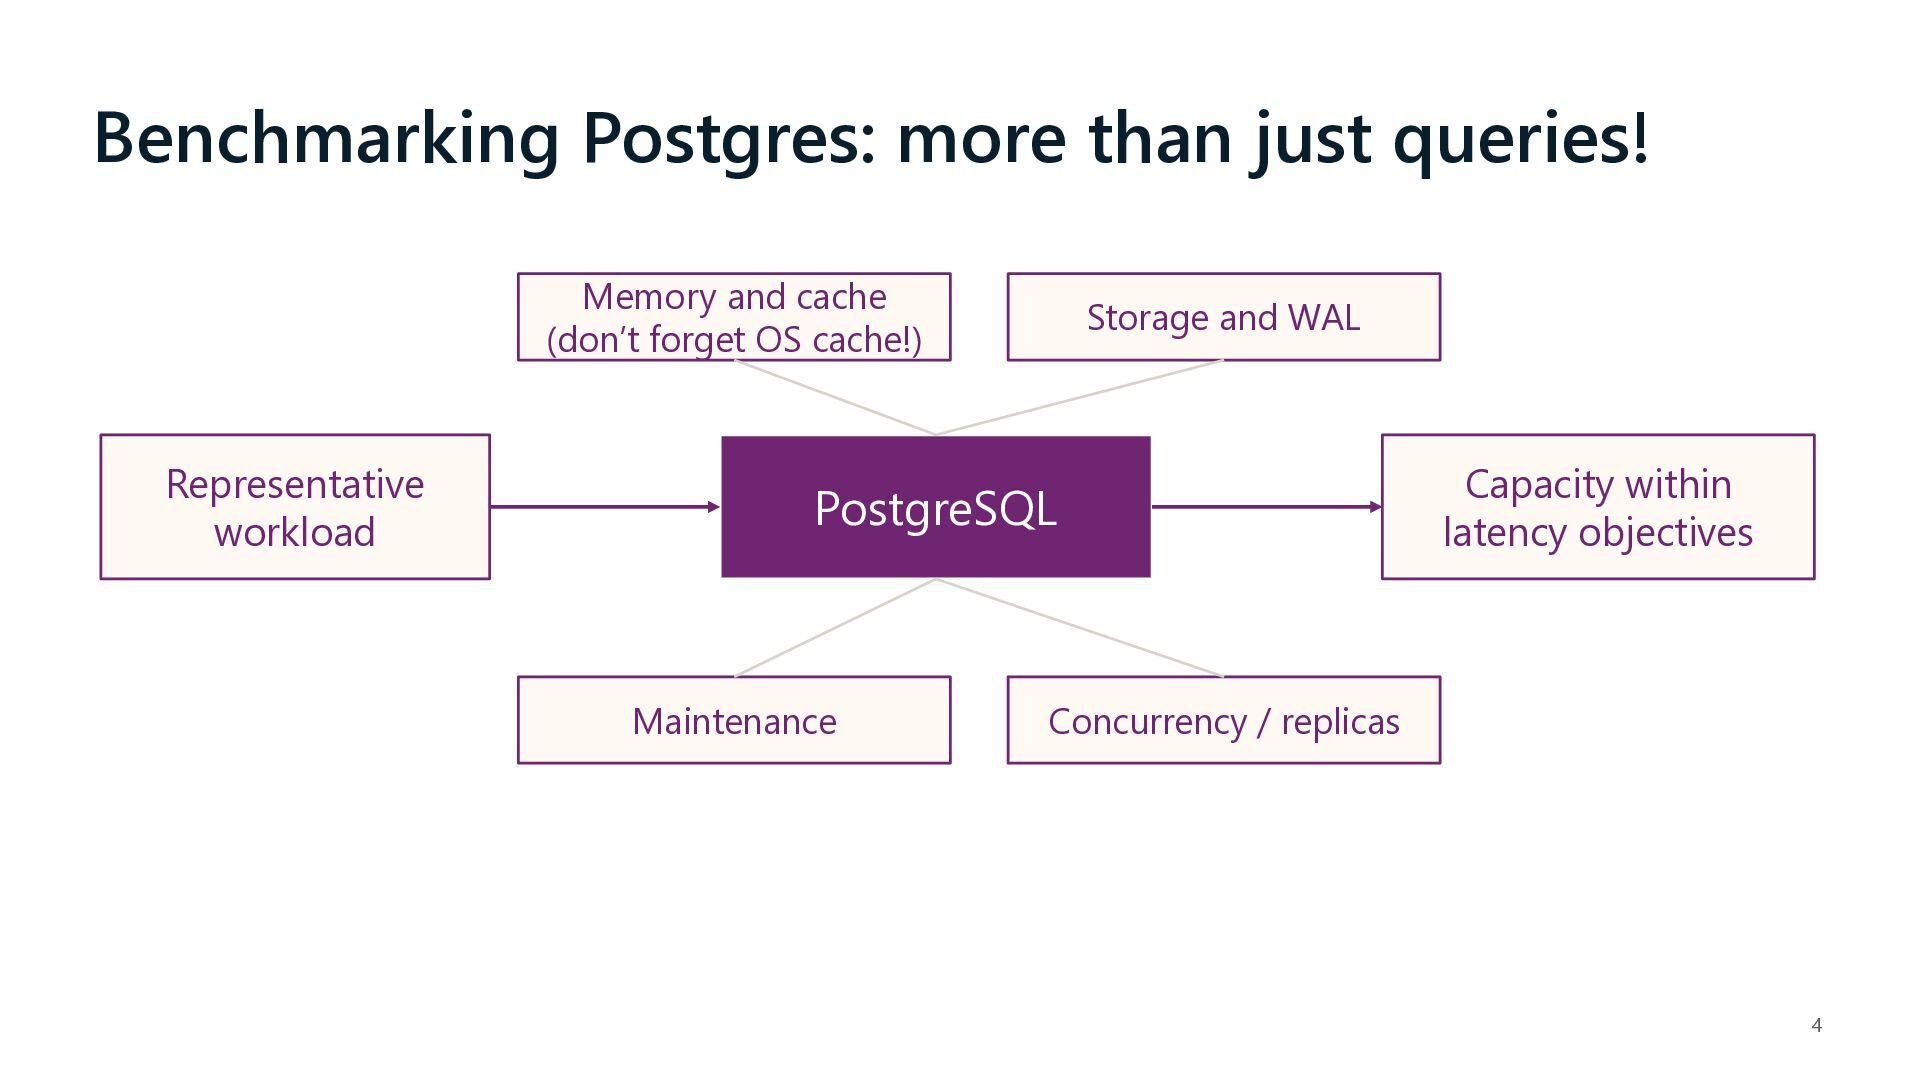
  4. Benchmarking Postgres: more than just queries! Memory and cache (don’t

    forget OS cache!) Representative workload Storage and WAL PostgreSQL Maintenance Capacity within latency objectives Concurrency / replicas 4
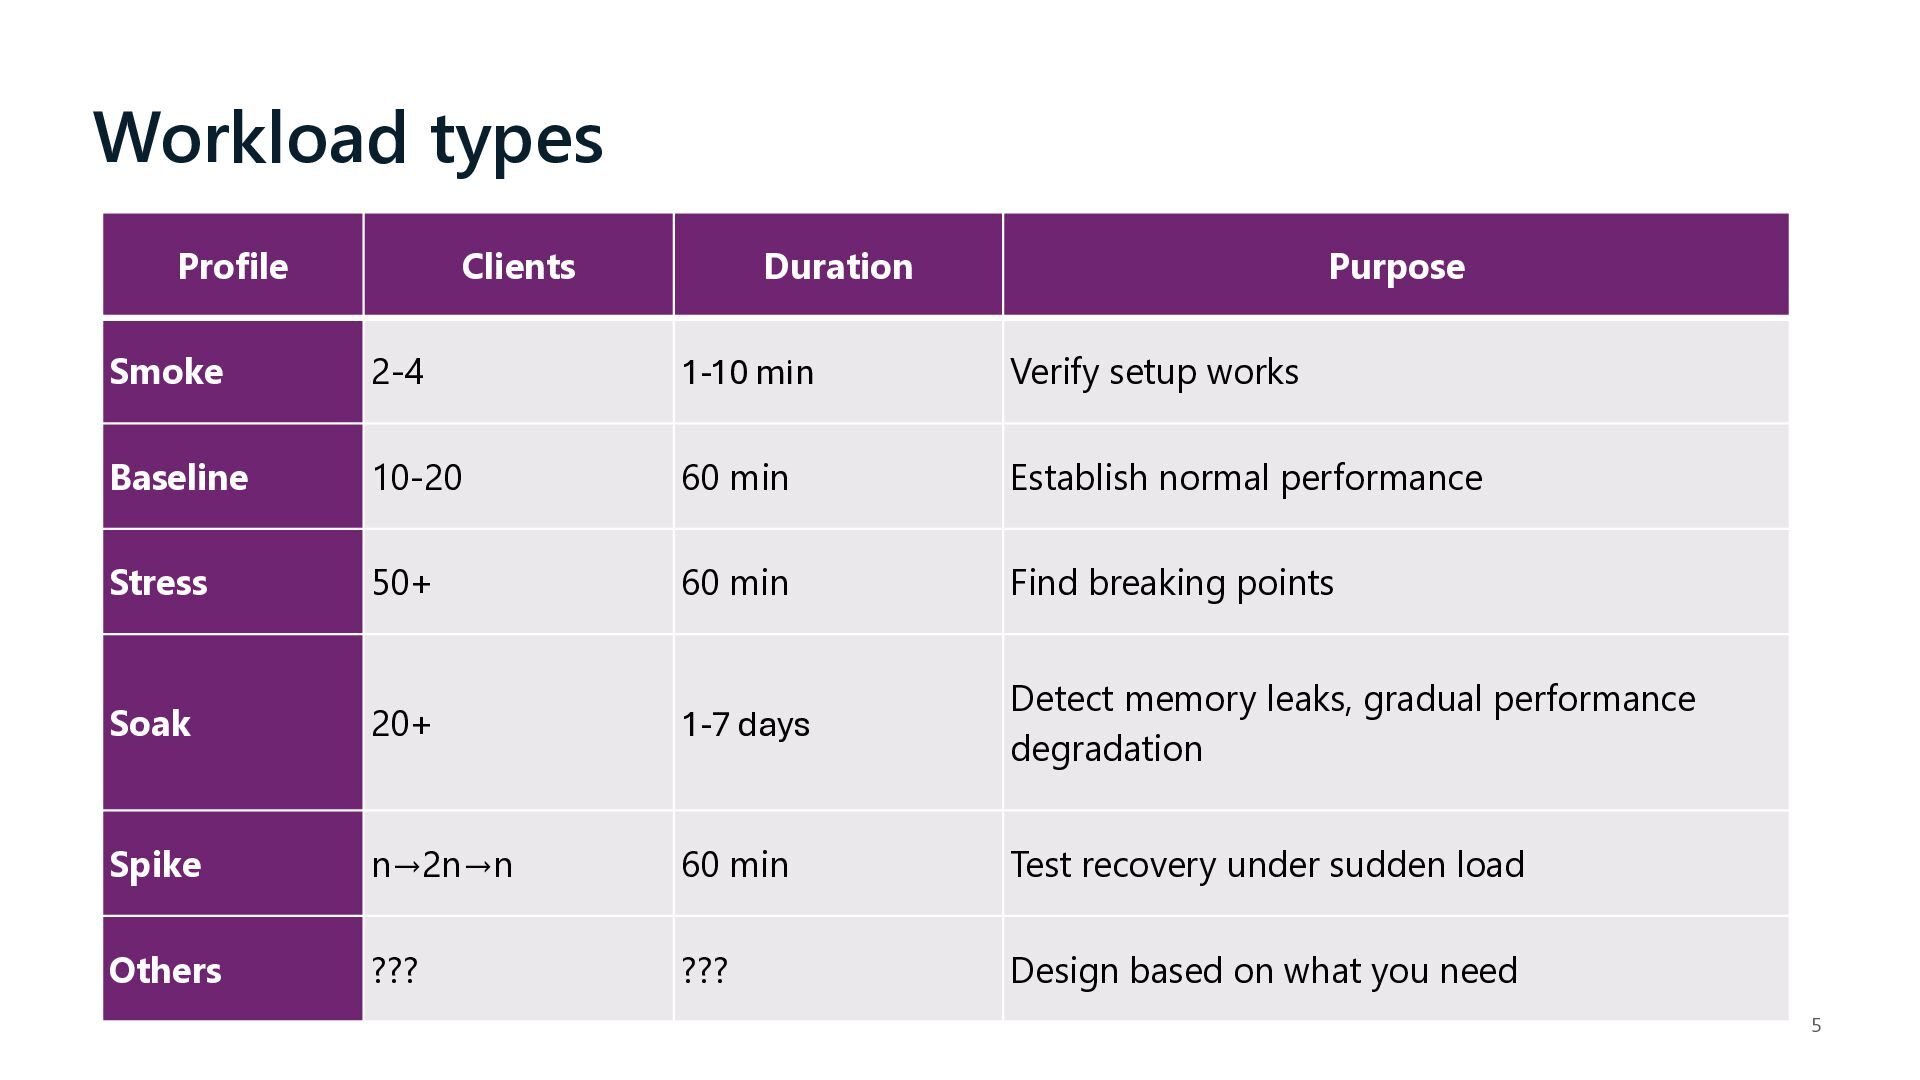
  5. Workload types Profile Clients Duration Purpose Smoke 2-4 1-10 min

    Verify setup works Baseline 10-20 60 min Establish normal performance Stress 50+ 60 min Find breaking points Soak 20+ 1-7 days Detect memory leaks, gradual performance degradation Spike n→2n→n 60 min Test recovery under sudden load Others ??? ??? Design based on what you need 5
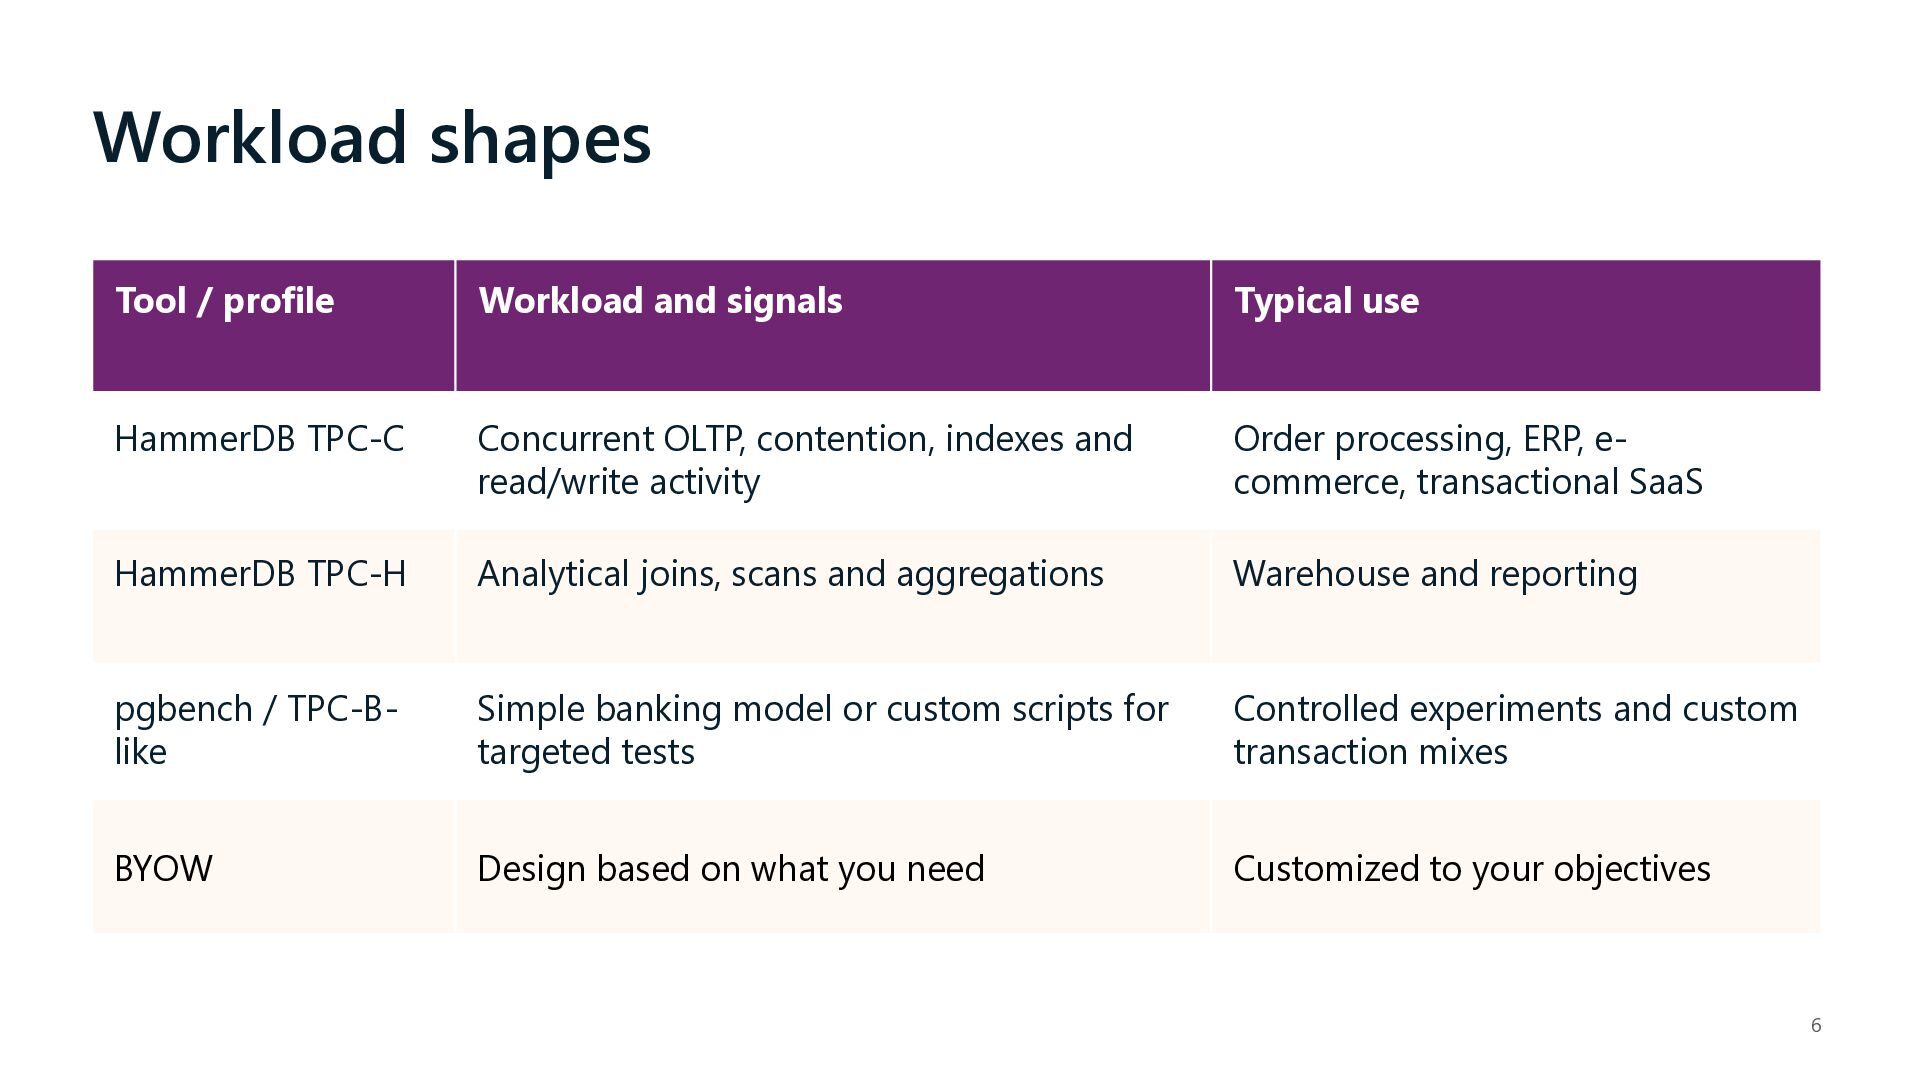
  6. Workload shapes Tool / profile Workload and signals Typical use

    HammerDB TPC-C Concurrent OLTP, contention, indexes and read/write activity Order processing, ERP, ecommerce, transactional SaaS HammerDB TPC-H Analytical joins, scans and aggregations Warehouse and reporting pgbench / TPC-Blike Simple banking model or custom scripts for targeted tests Controlled experiments and custom transaction mixes BYOW Design based on what you need Customized to your objectives 6
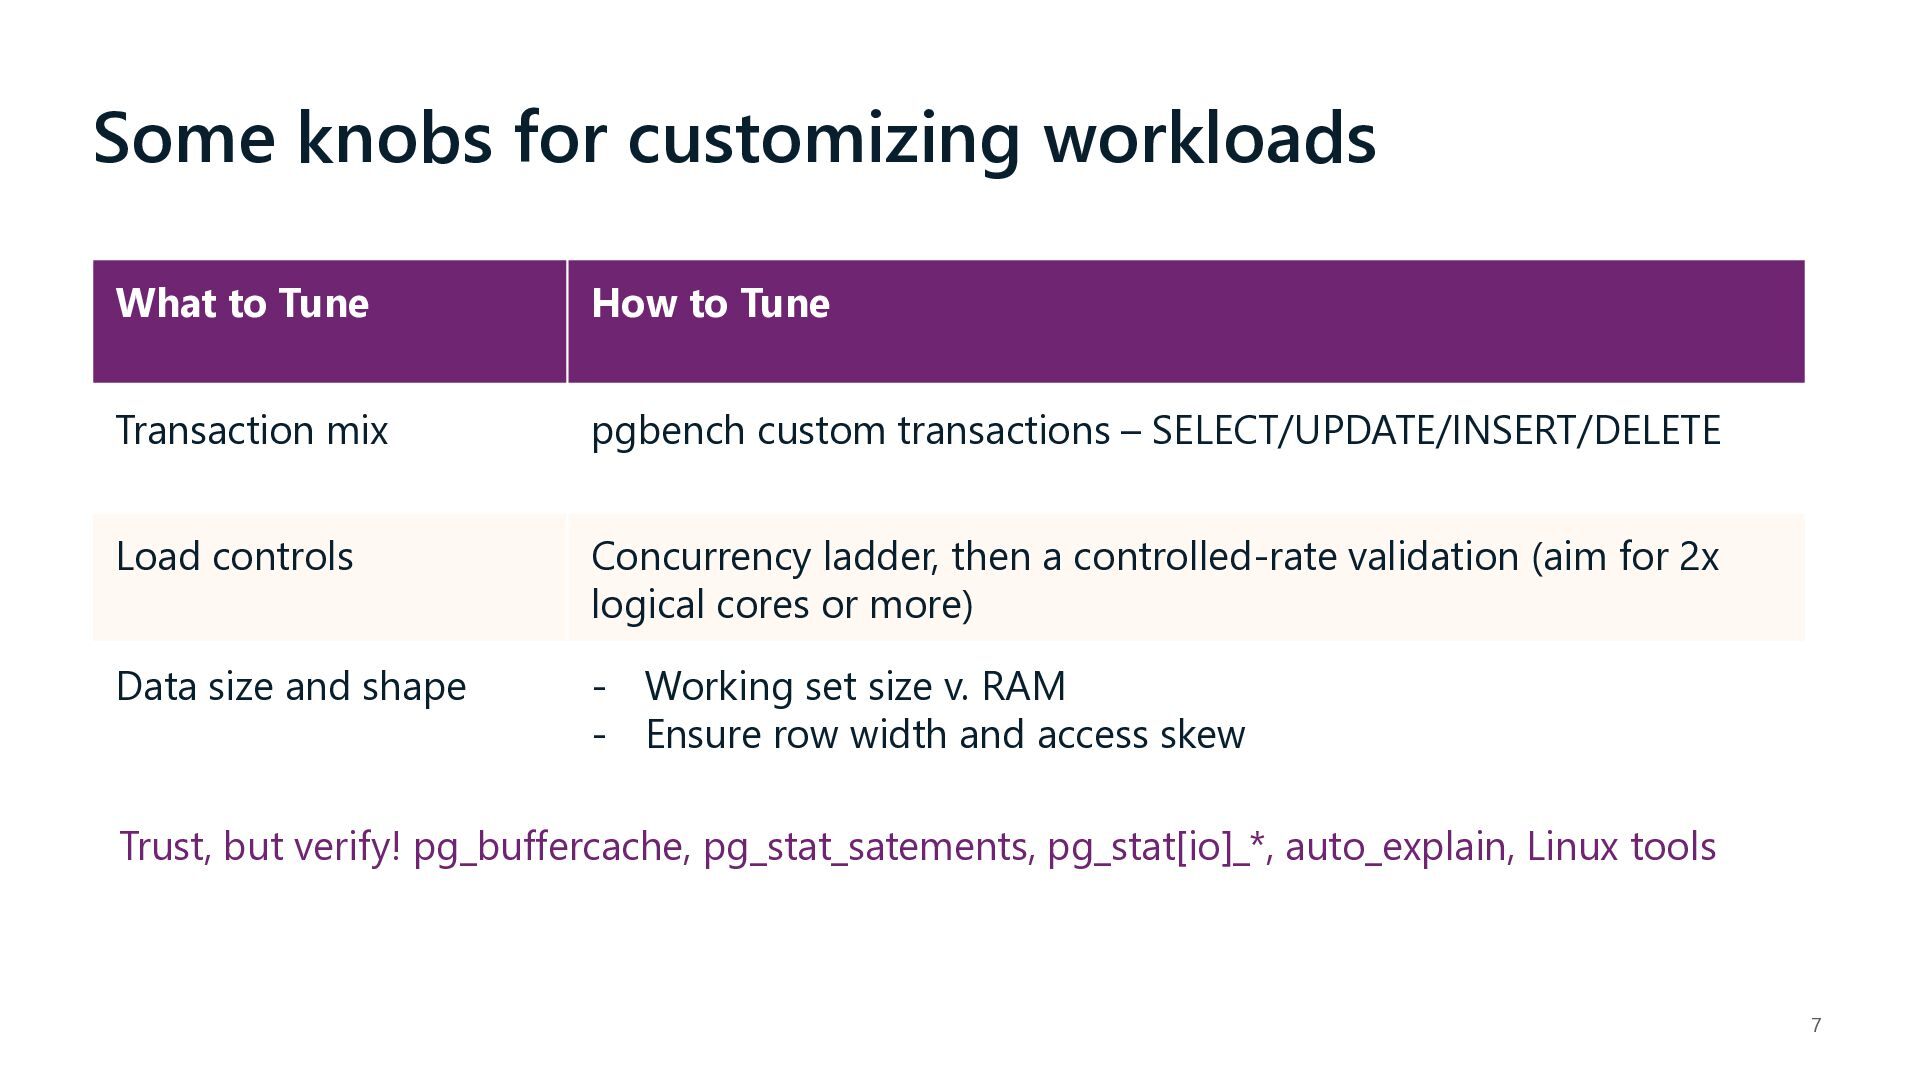
  7. Some knobs for customizing workloads What to Tune How to

    Tune Transaction mix pgbench custom transactions – SELECT/UPDATE/INSERT/DELETE Load controls Concurrency ladder, then a controlled-rate validation (aim for 2x logical cores or more) Data size and shape - Working set size v. RAM - Ensure row width and access skew Trust, but verify! pg_buffercache, pg_stat_satements, pg_stat[io]_*, auto_explain, Linux tools 7
  8. What to do with benchmark outcomes - Is the outcome

    acceptable? (latency, TPS, errors, etc.) - How do different configurations compare with each other? - Can we explain the difference in performance? - Did we identify the root cause? 3
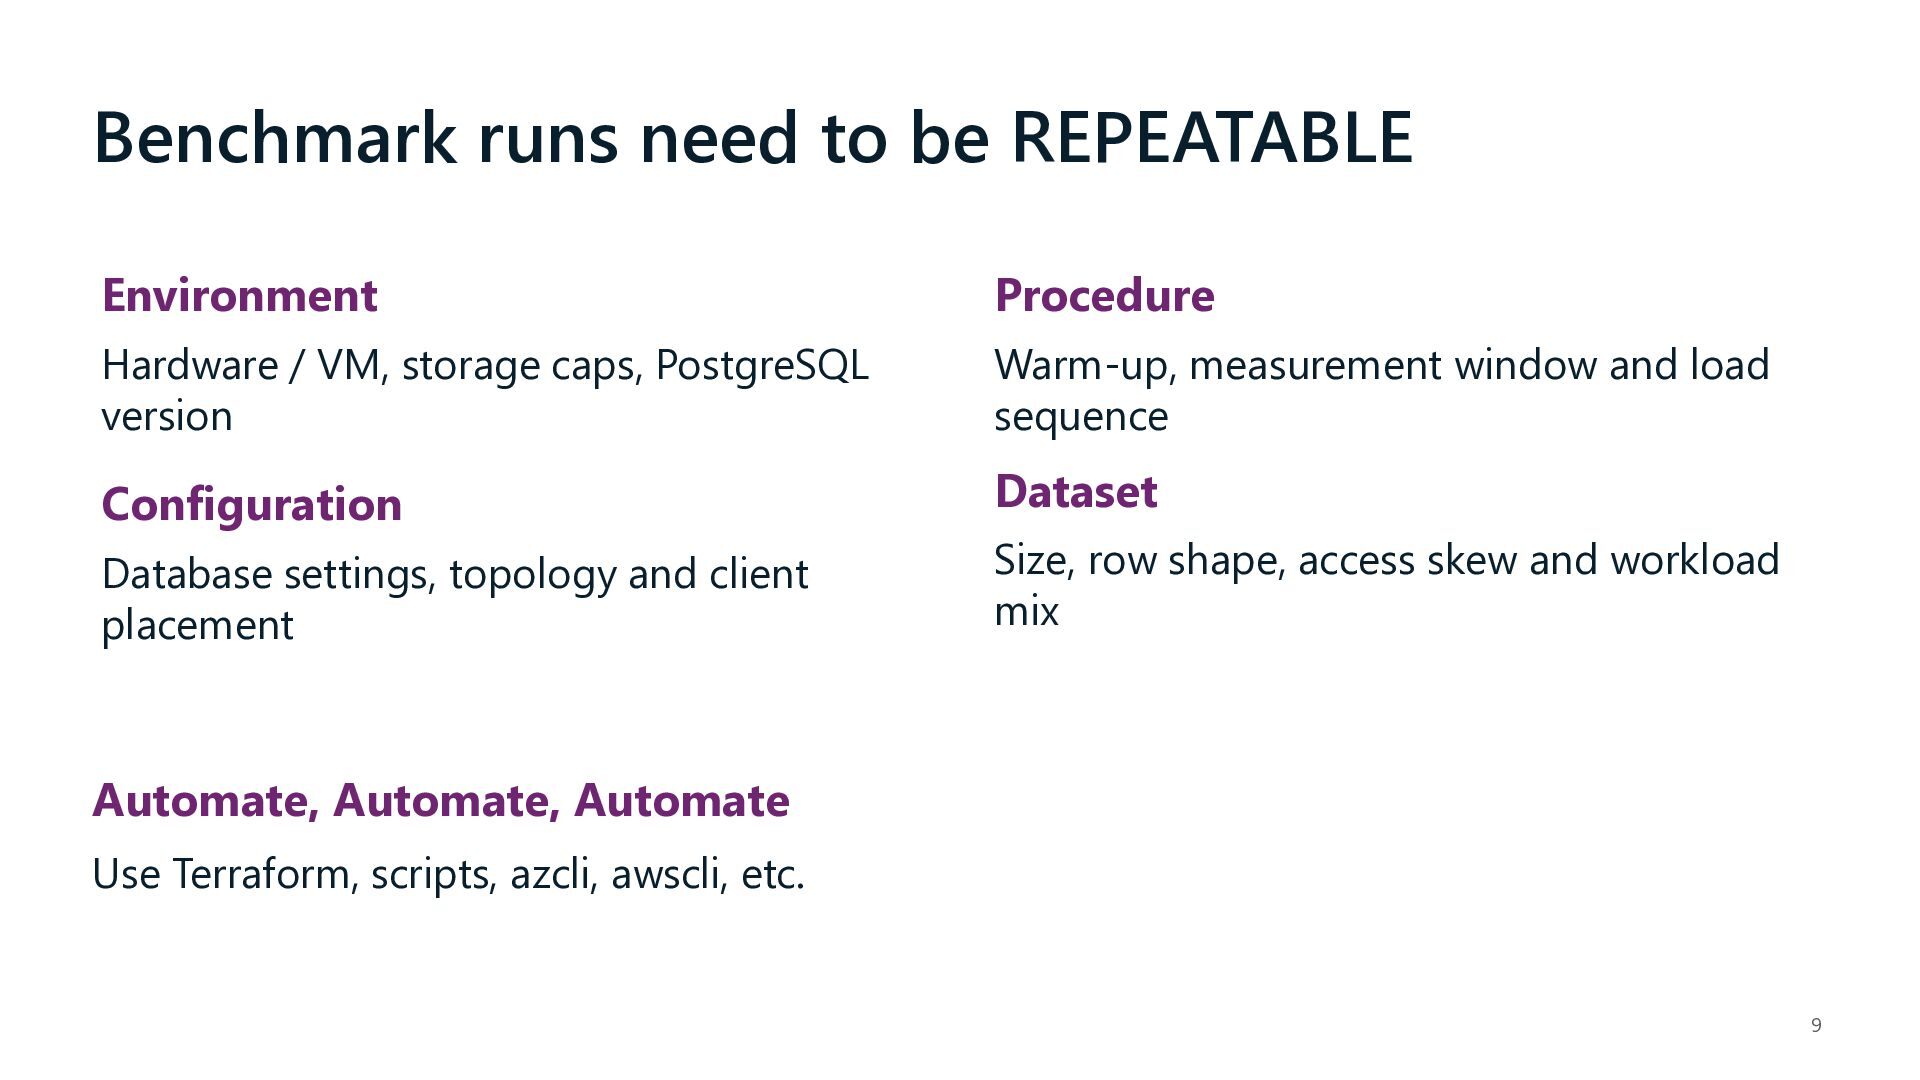
  9. Benchmark runs need to be REPEATABLE Environment Procedure Hardware /

    VM, storage caps, PostgreSQL version Warm-up, measurement window and load sequence Configuration Dataset Database settings, topology and client placement Size, row shape, access skew and workload mix Automate, Automate, Automate Use Terraform, scripts, azcli, awscli, etc. 9
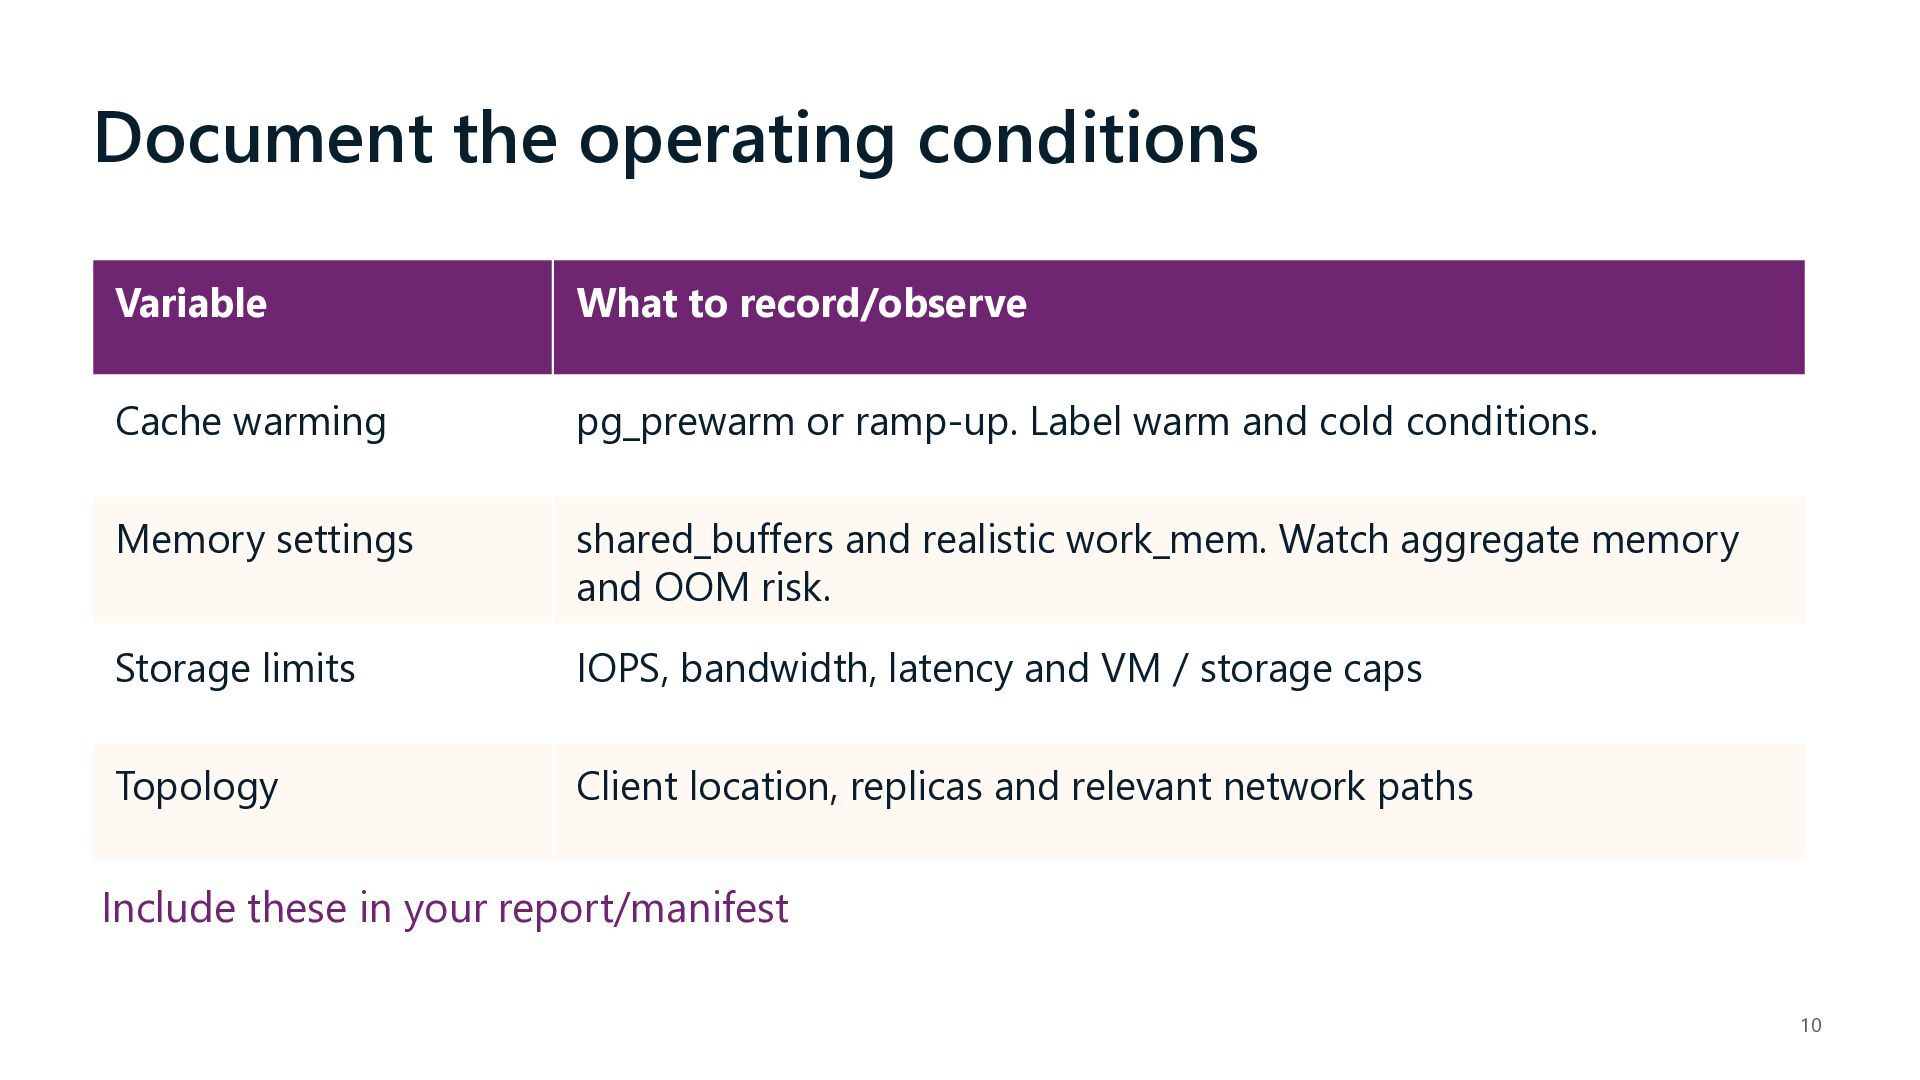
  10. Document the operating conditions Variable What to record/observe Cache warming

    pg_prewarm or ramp-up. Label warm and cold conditions. Memory settings shared_buffers and realistic work_mem. Watch aggregate memory and OOM risk. Storage limits IOPS, bandwidth, latency and VM / storage caps Topology Client location, replicas and relevant network paths Include these in your report/manifest 10
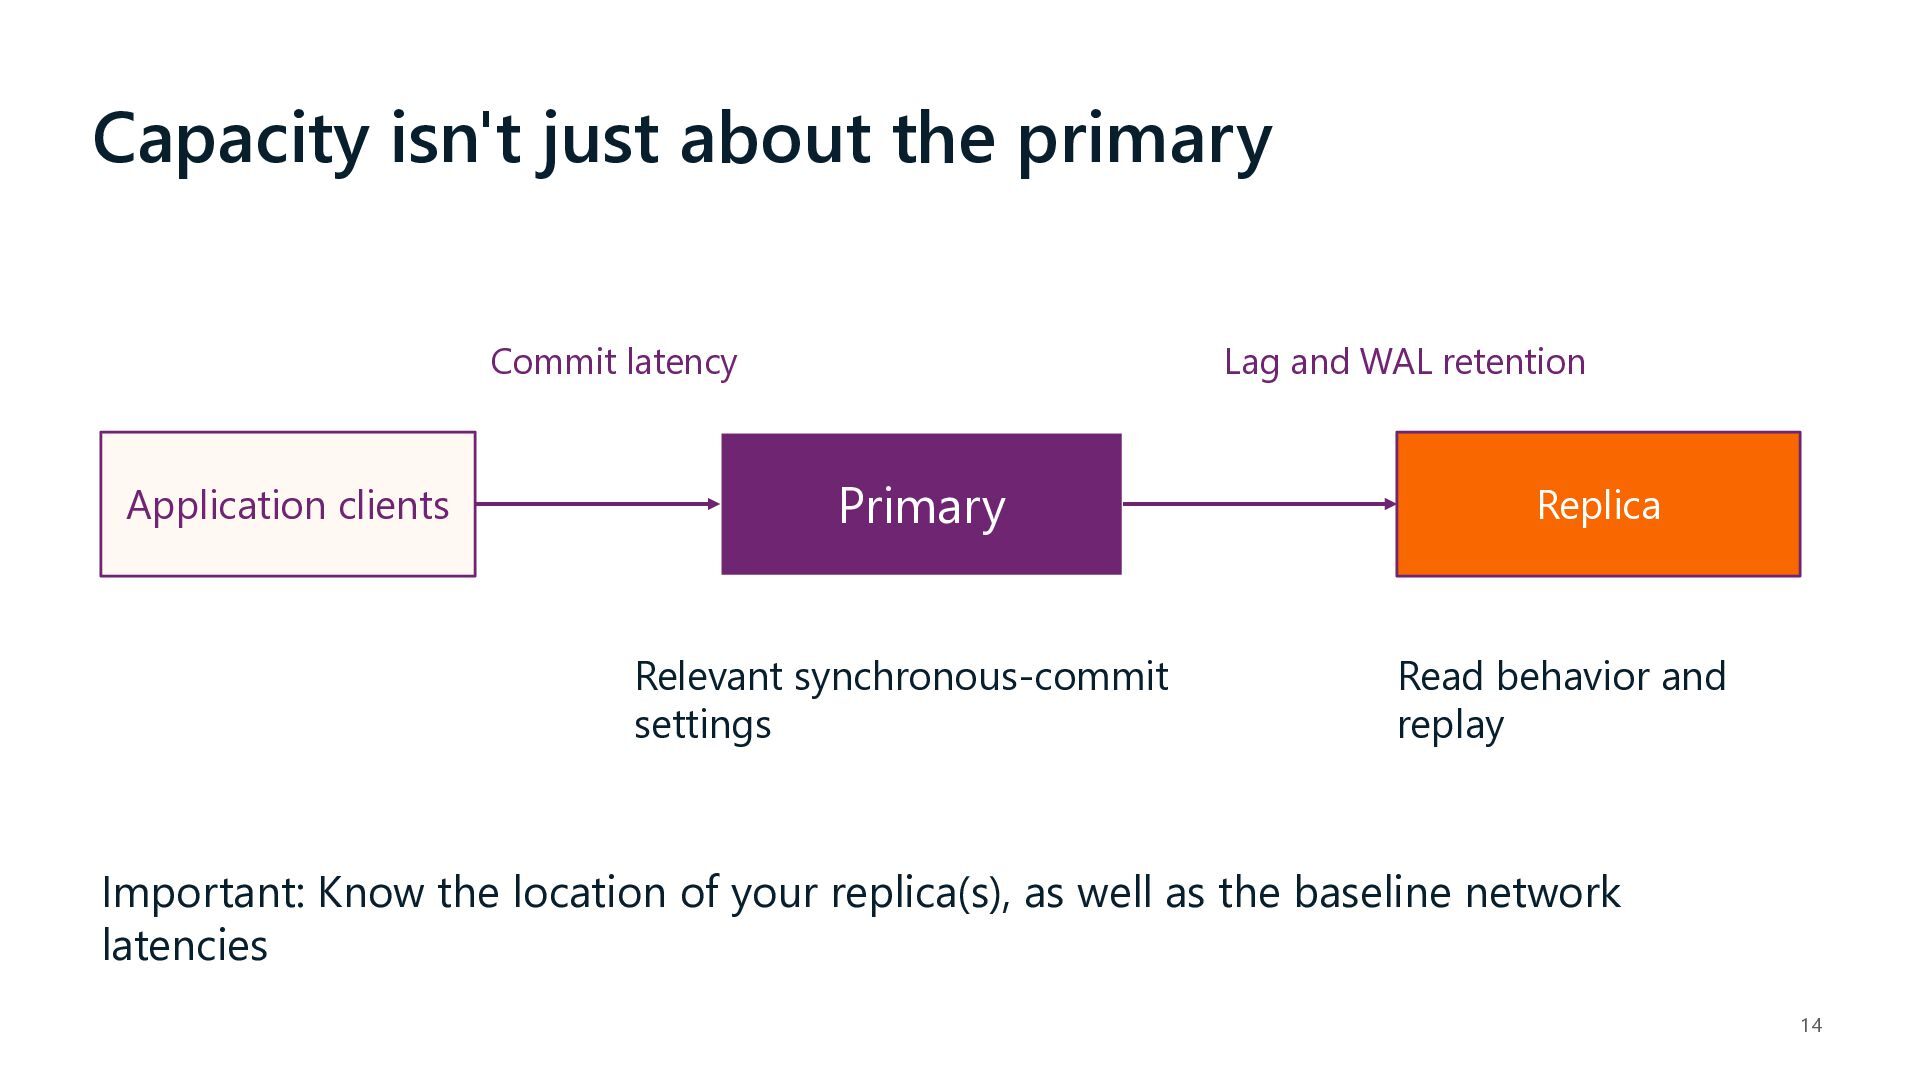
  11. Capacity isn't just about the primary Commit latency Application clients

    Lag and WAL retention Primary Relevant synchronous-commit settings Replica Read behavior and replay Important: Know the location of your replica(s), as well as the baseline network latencies 14
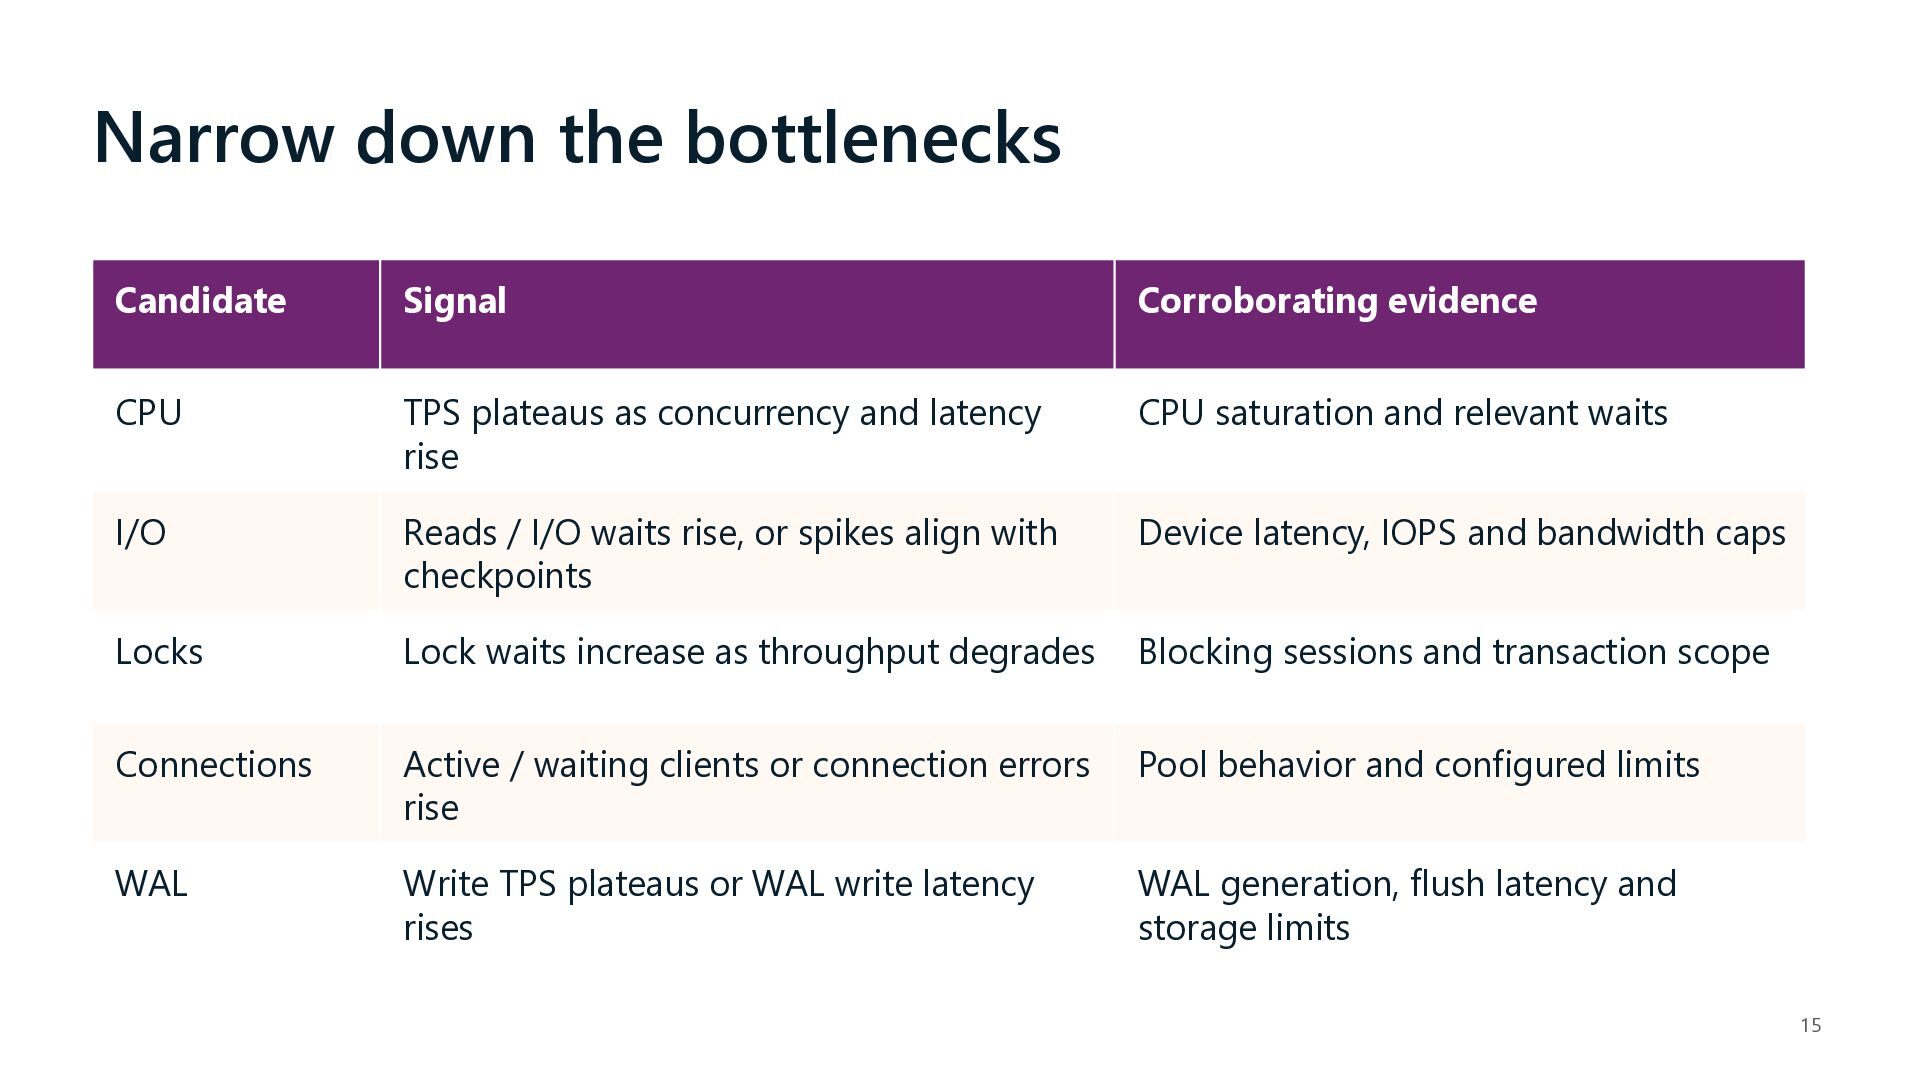
  12. Narrow down the bottlenecks Candidate Signal Corroborating evidence CPU TPS

    plateaus as concurrency and latency rise CPU saturation and relevant waits I/O Reads / I/O waits rise, or spikes align with checkpoints Device latency, IOPS and bandwidth caps Locks Lock waits increase as throughput degrades Blocking sessions and transaction scope Connections Active / waiting clients or connection errors rise Pool behavior and configured limits WAL Write TPS plateaus or WAL write latency rises WAL generation, flush latency and storage limits 15
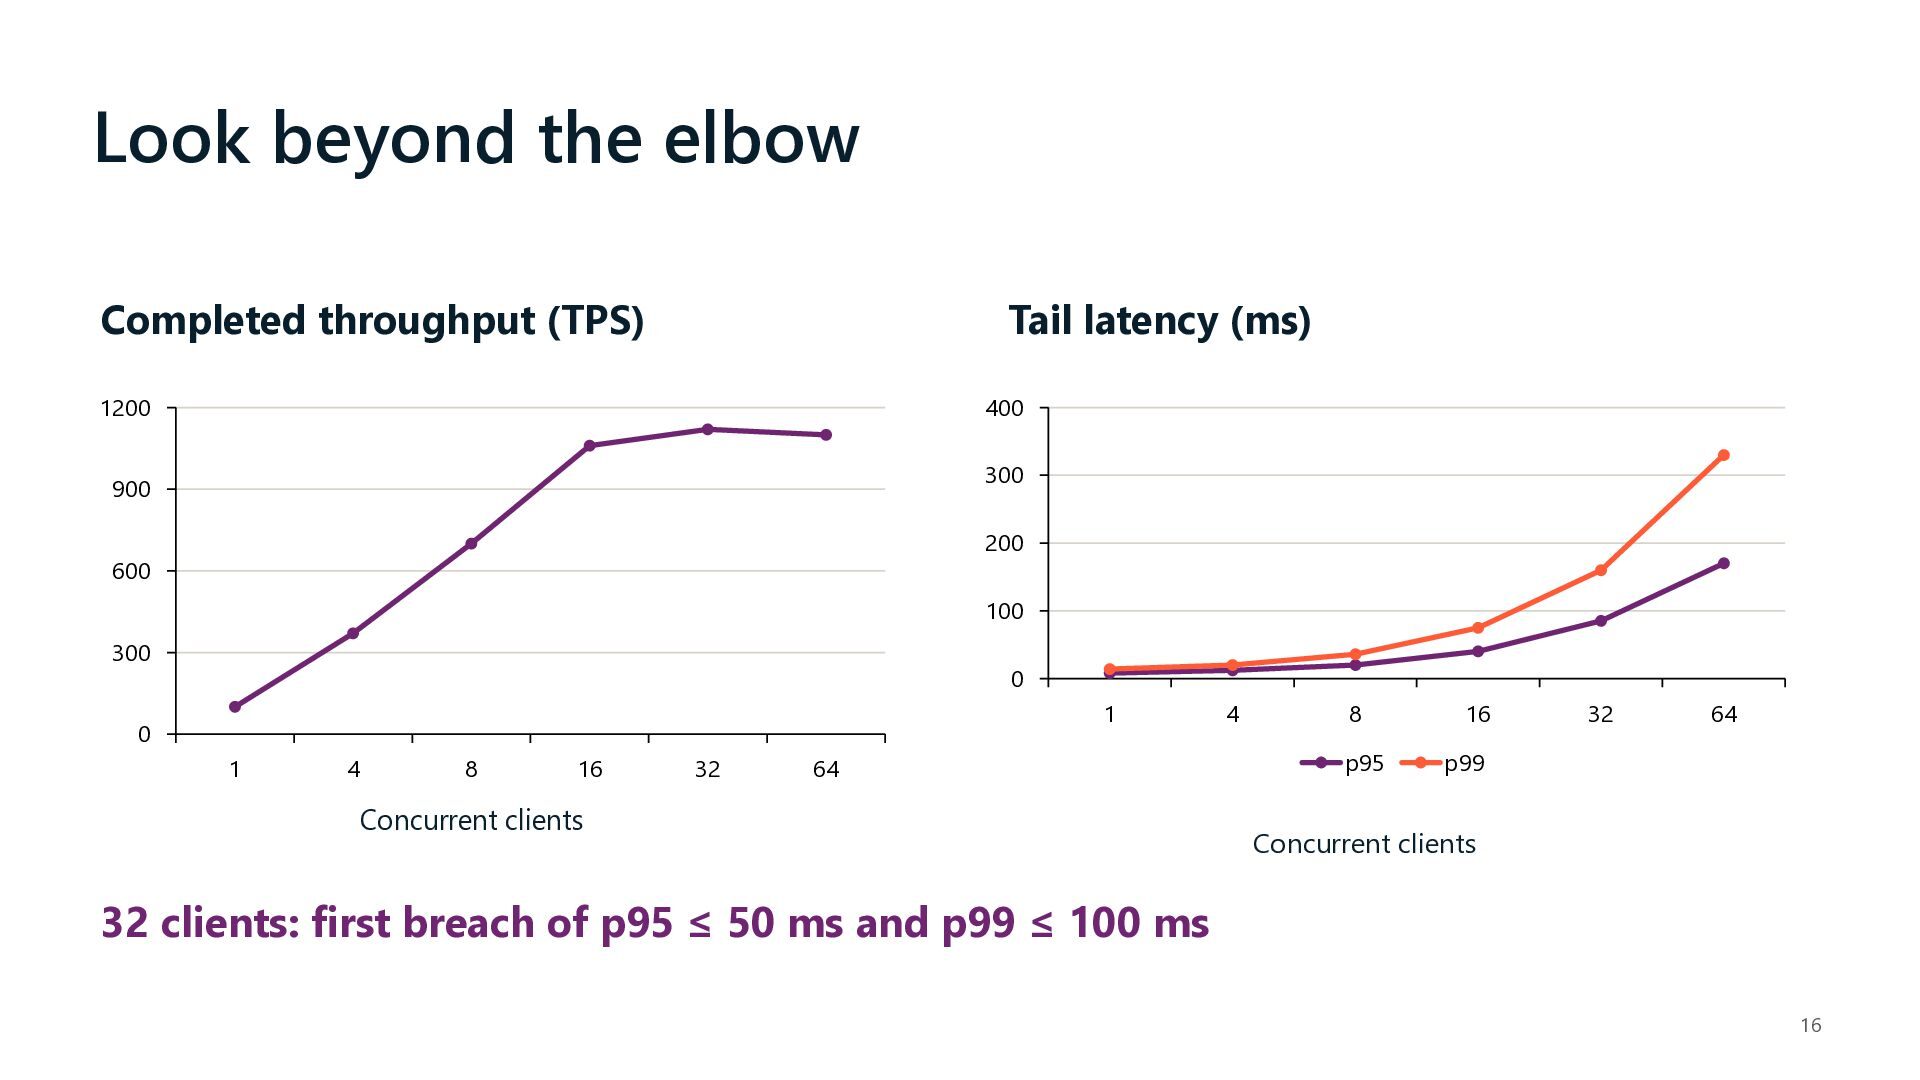
  13. Look beyond the elbow Completed throughput (TPS) Tail latency (ms)

    1200 400 300 900 200 600 100 300 0 1 0 1 4 8 16 32 64 Concurrent clients 4 8 16 p95 p99 32 64 Concurrent clients 32 clients: first breach of p95 ≤ 50 ms and p99 ≤ 100 ms 16
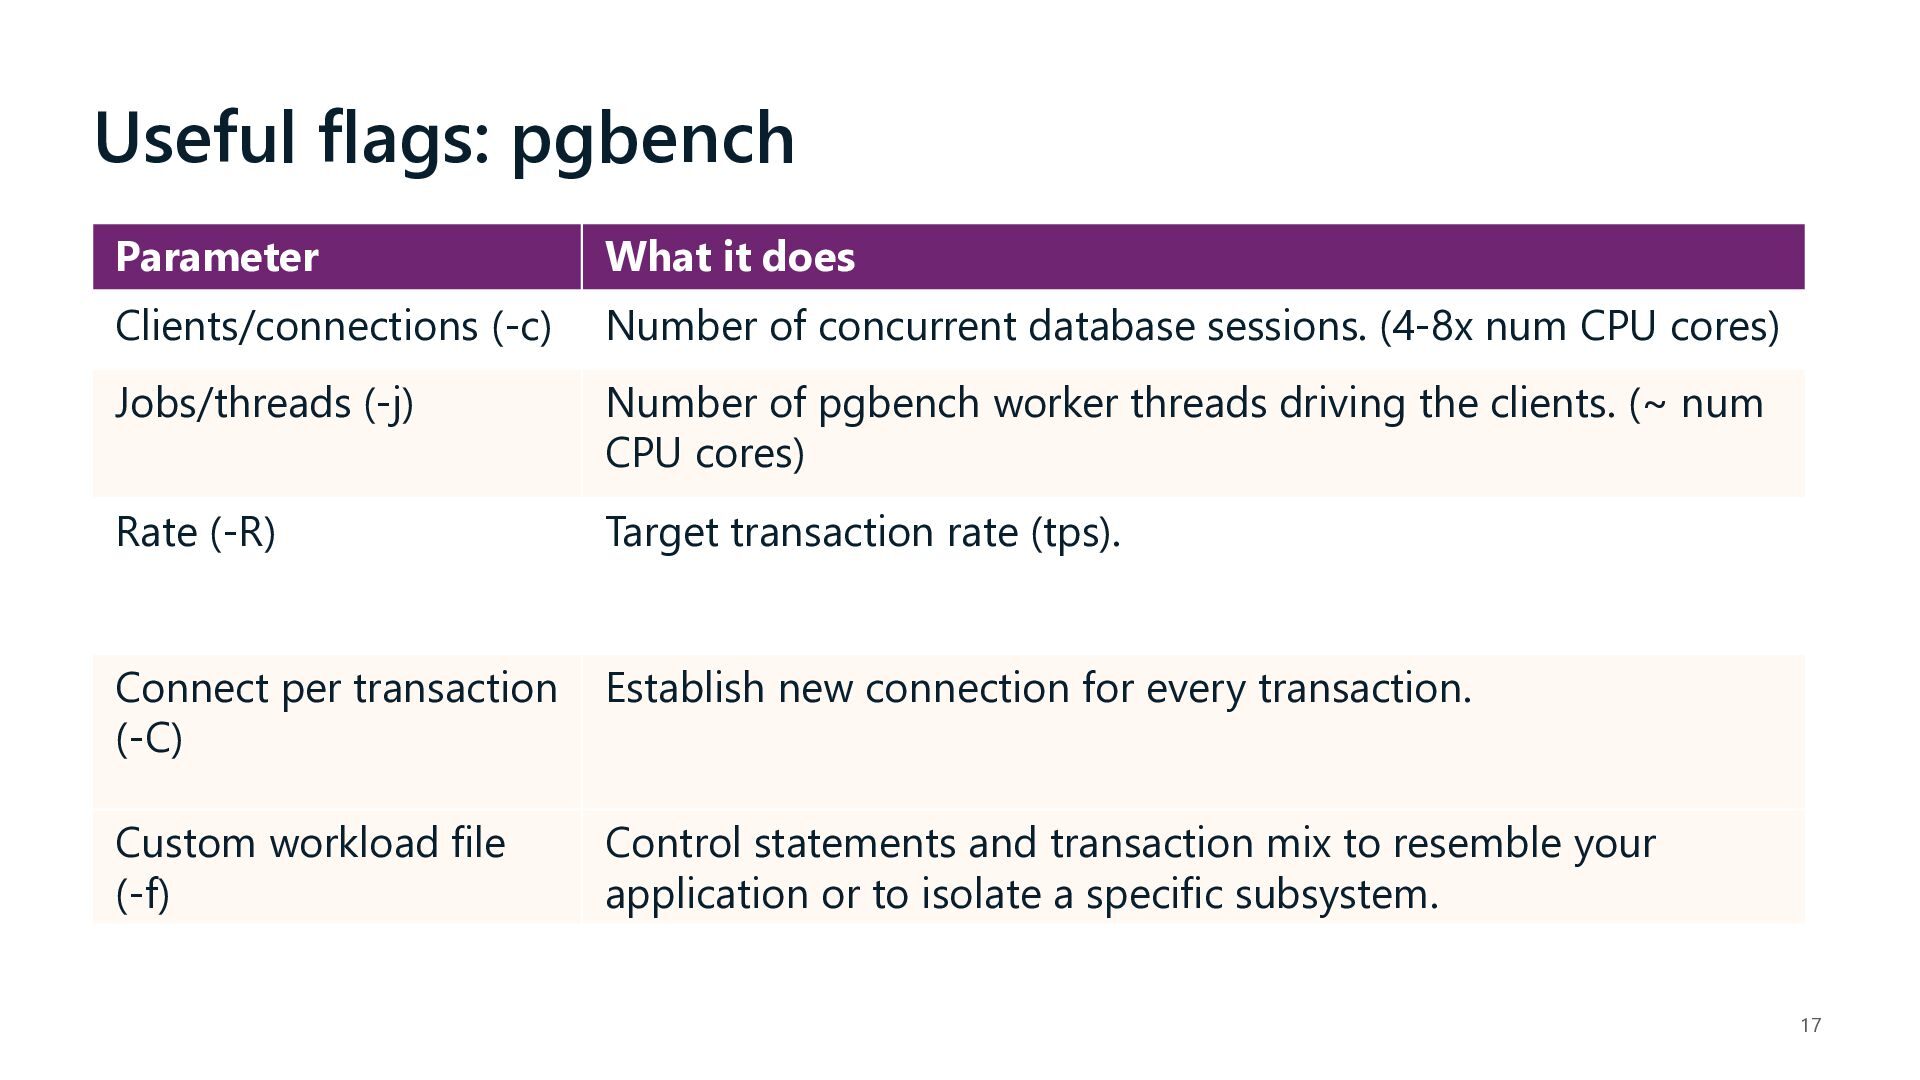
  14. Useful flags: pgbench Parameter What it does Clients/connections (-c) Number

    of concurrent database sessions. (4-8x num CPU cores) Jobs/threads (-j) Number of pgbench worker threads driving the clients. (~ num CPU cores) Rate (-R) Target transaction rate (tps). Connect per transaction (-C) Establish new connection for every transaction. Custom workload file (-f) Control statements and transaction mix to resemble your application or to isolate a specific subsystem. 17
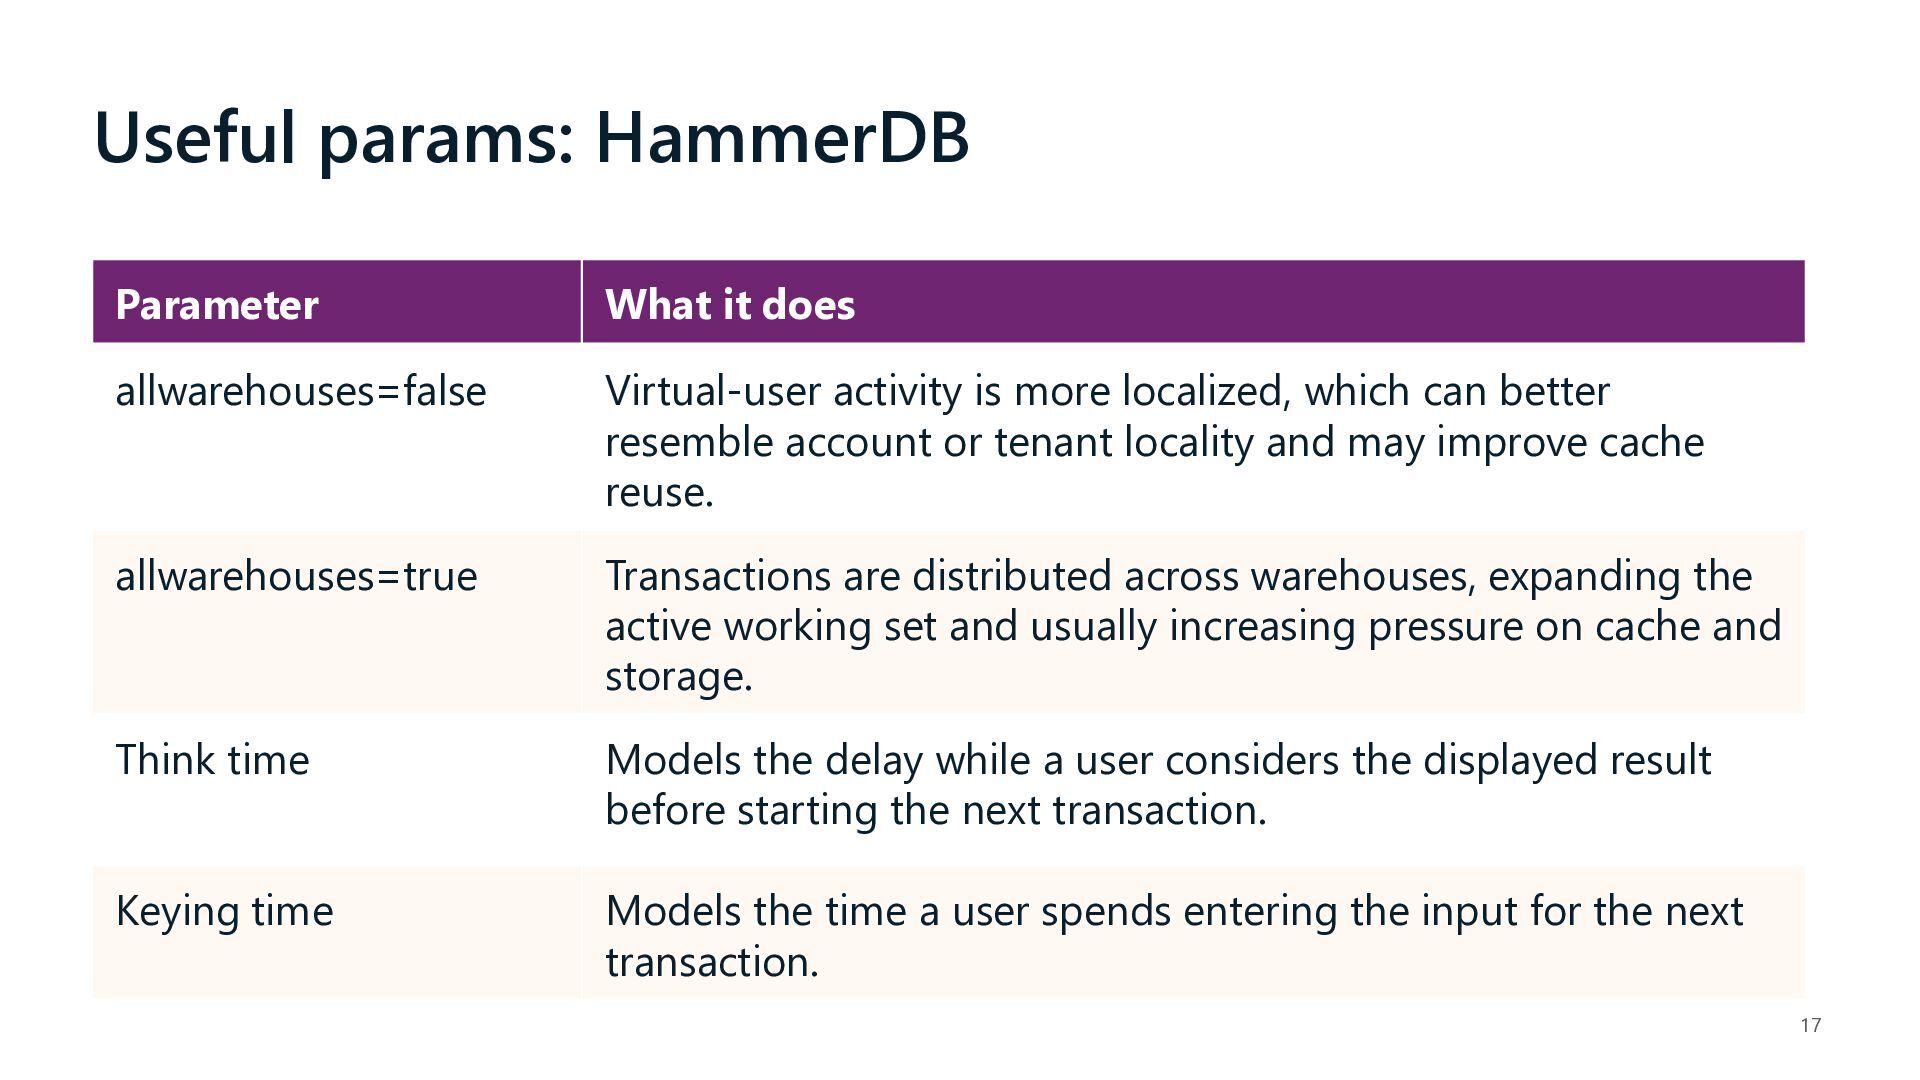
  15. Useful params: HammerDB Parameter What it does allwarehouses=false Virtual-user activity

    is more localized, which can better resemble account or tenant locality and may improve cache reuse. allwarehouses=true Transactions are distributed across warehouses, expanding the active working set and usually increasing pressure on cache and storage. Think time Models the delay while a user considers the displayed result before starting the next transaction. Keying time Models the time a user spends entering the input for the next transaction. 17
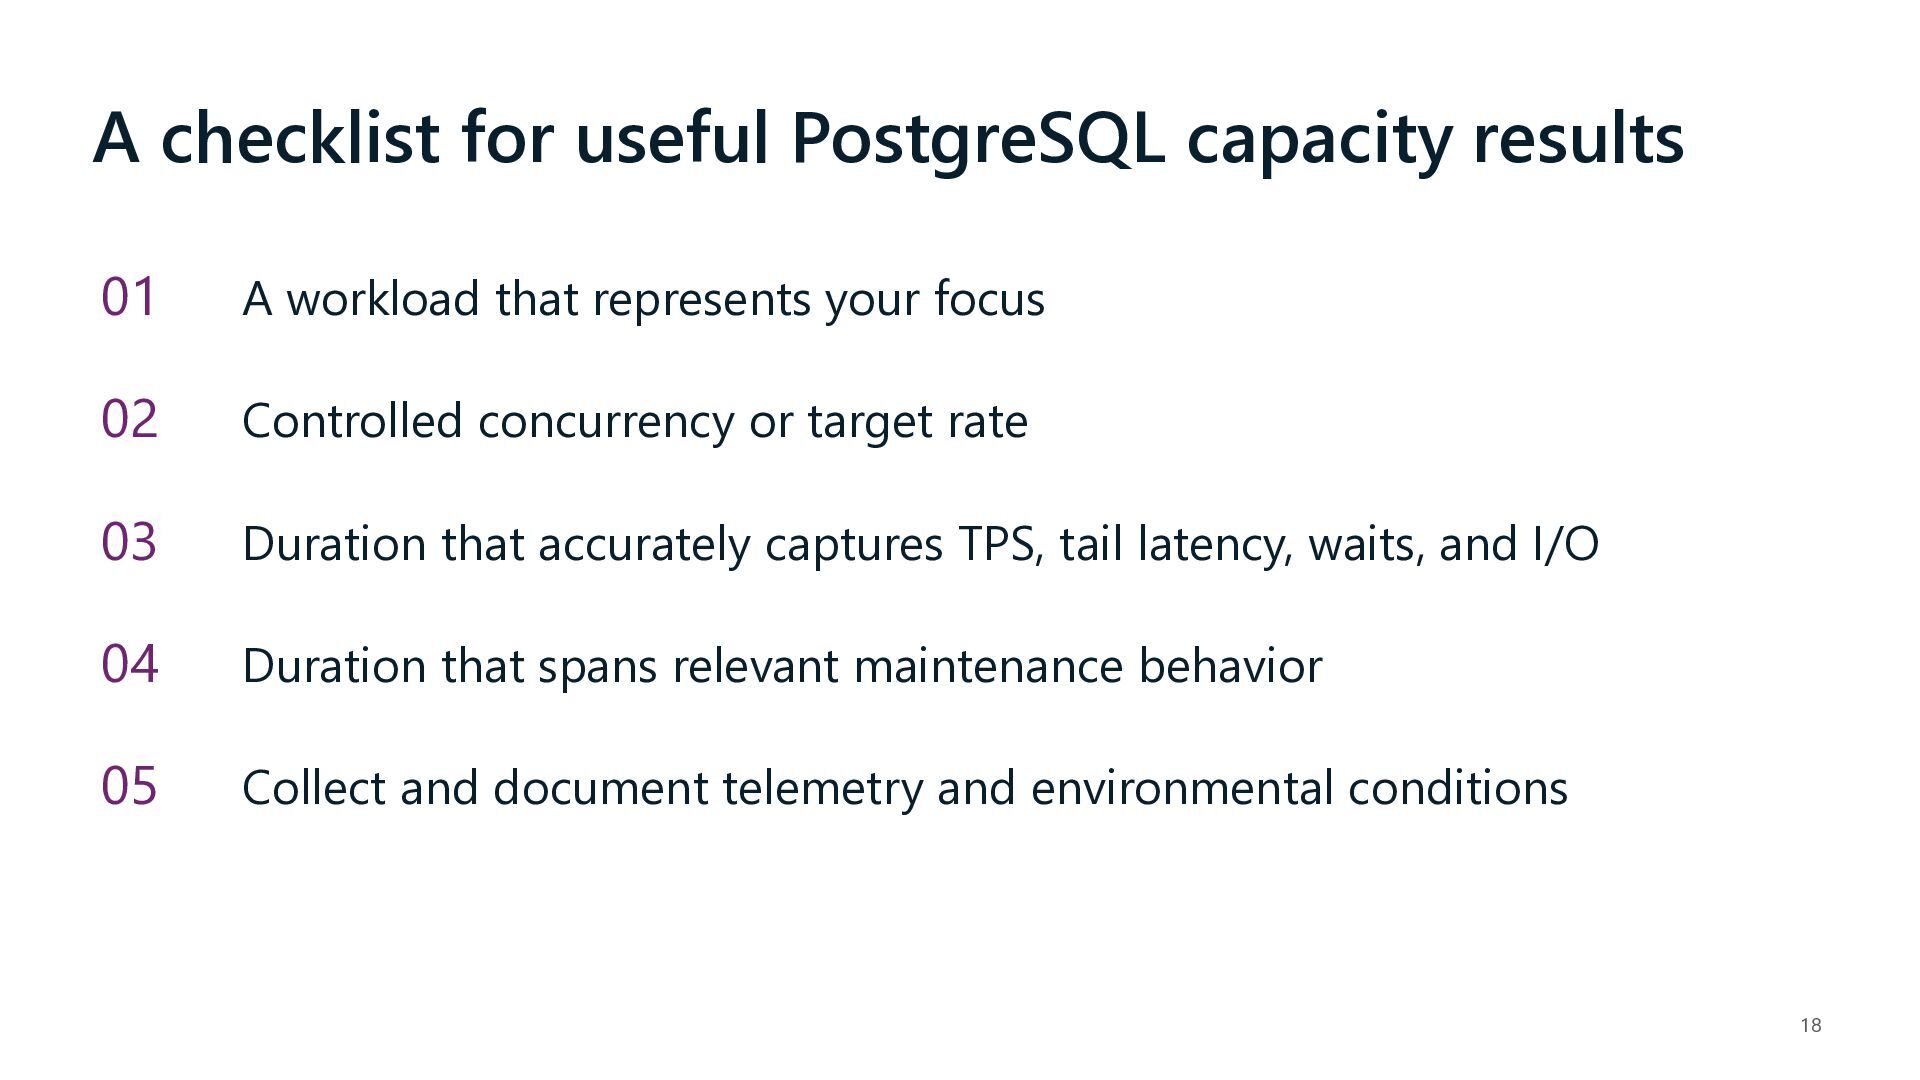
  16. A checklist for useful PostgreSQL capacity results 01 A workload

    that represents your focus 02 Controlled concurrency or target rate 03 Duration that accurately captures TPS, tail latency, waits, and I/O 04 Duration that spans relevant maintenance behavior 05 Collect and document telemetry and environmental conditions 18