Lock in $30 Savings on PRO—Offer Ends Soon! ⏳

M3 and Prometheus, Monitoring at Planet Scale f...

M3 and Prometheus, Monitoring at Planet Scale for Everyone

Video:
https://www.youtube.com/watch?v=EFutyuIpFXQ

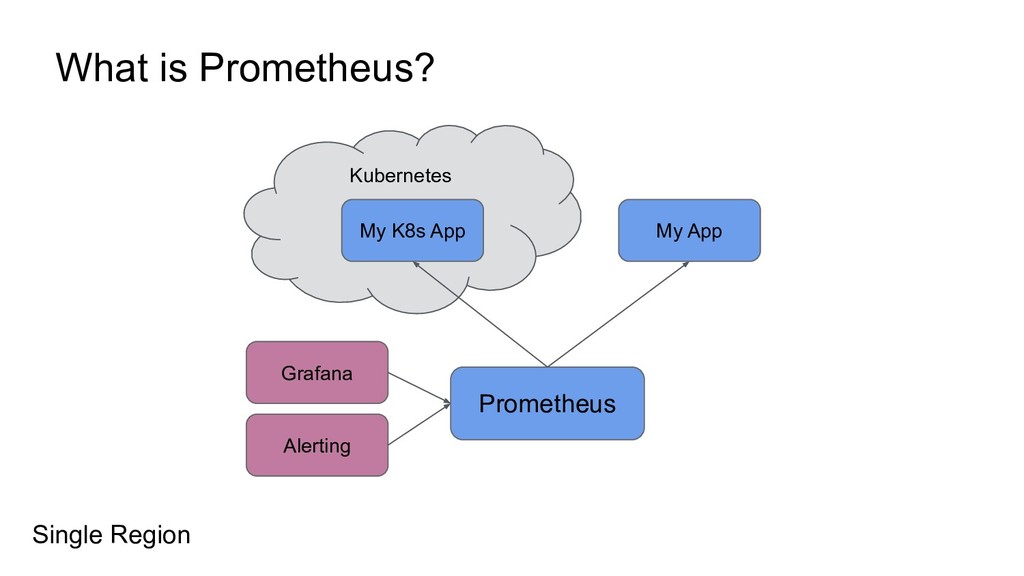
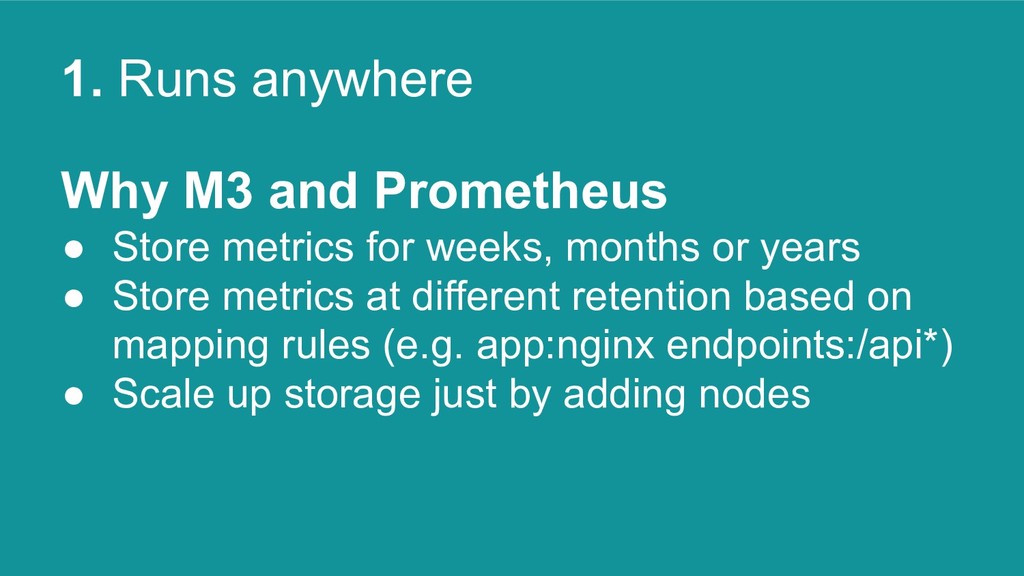
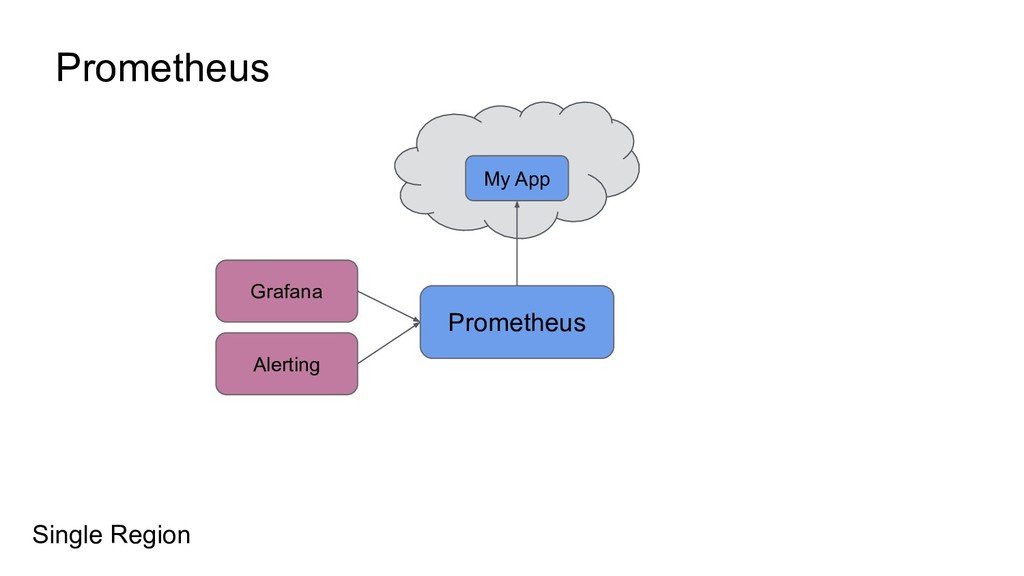
For the past few years Prometheus has solved the monitoring needs of many and it is exceptional at what it does. Prometheus has exploded in popularity and now many wish to store more metrics, at longer retention and establish a single pane of glass on top of Prometheus for their monitoring needs across regions.

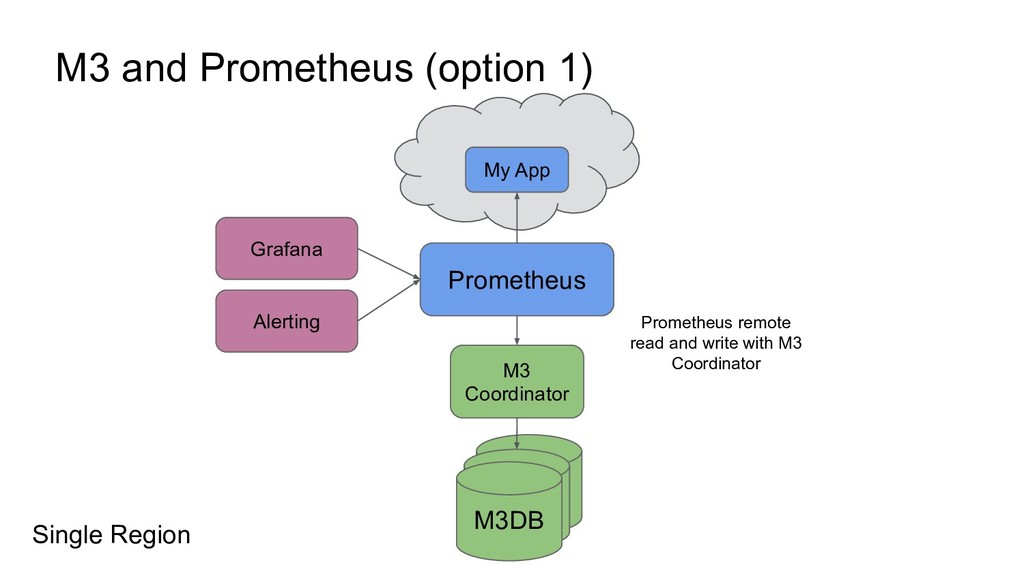
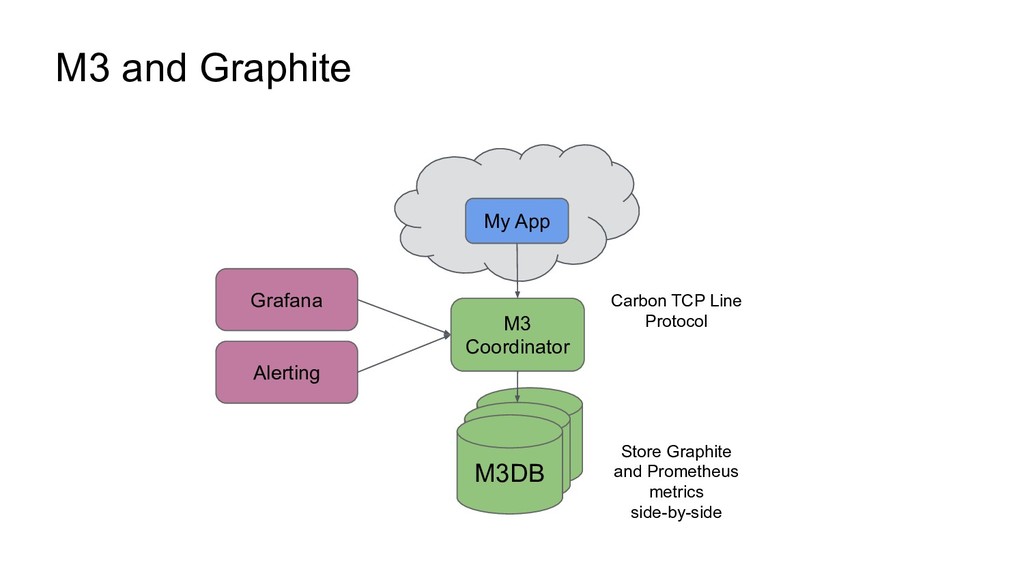
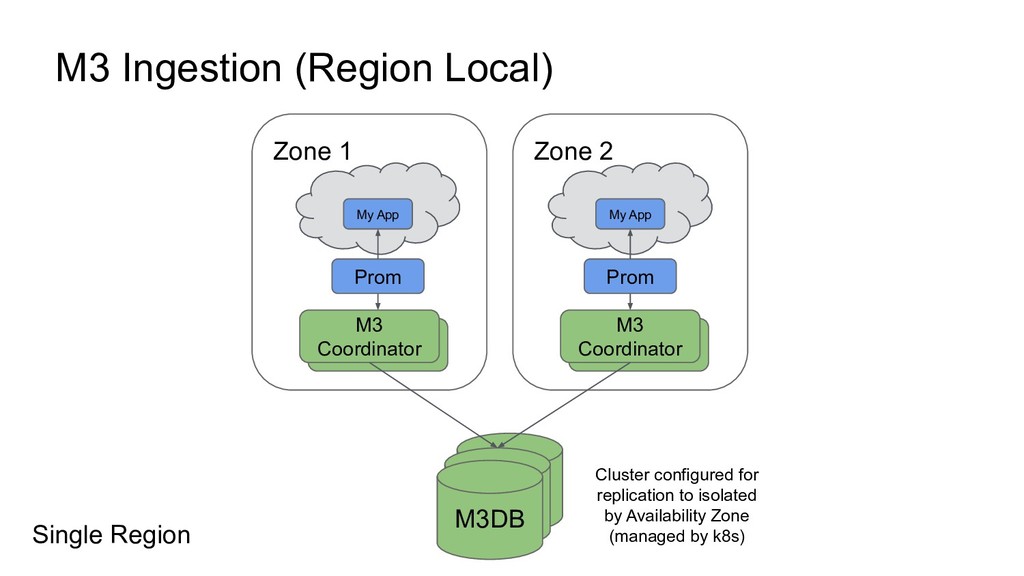
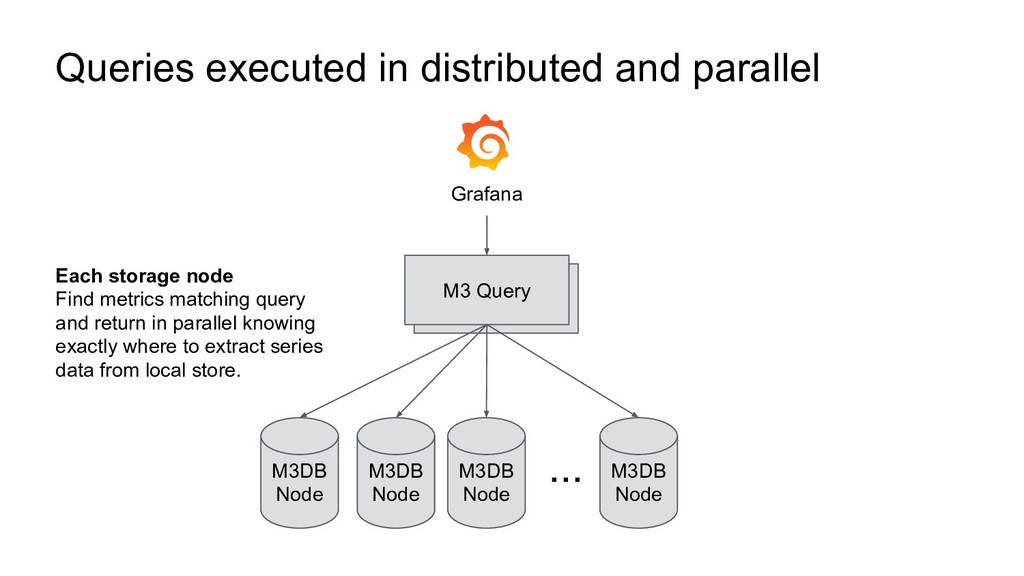
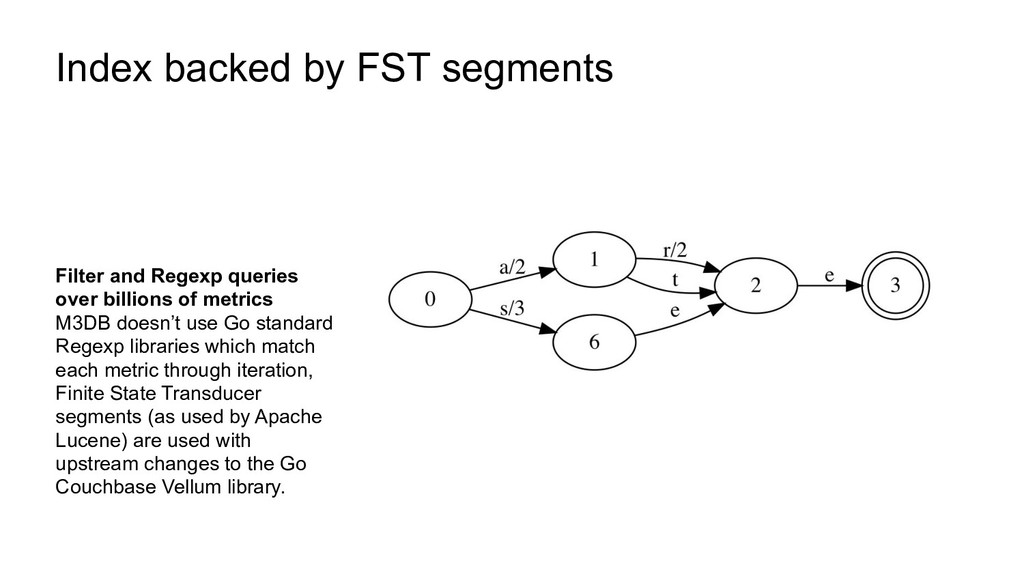
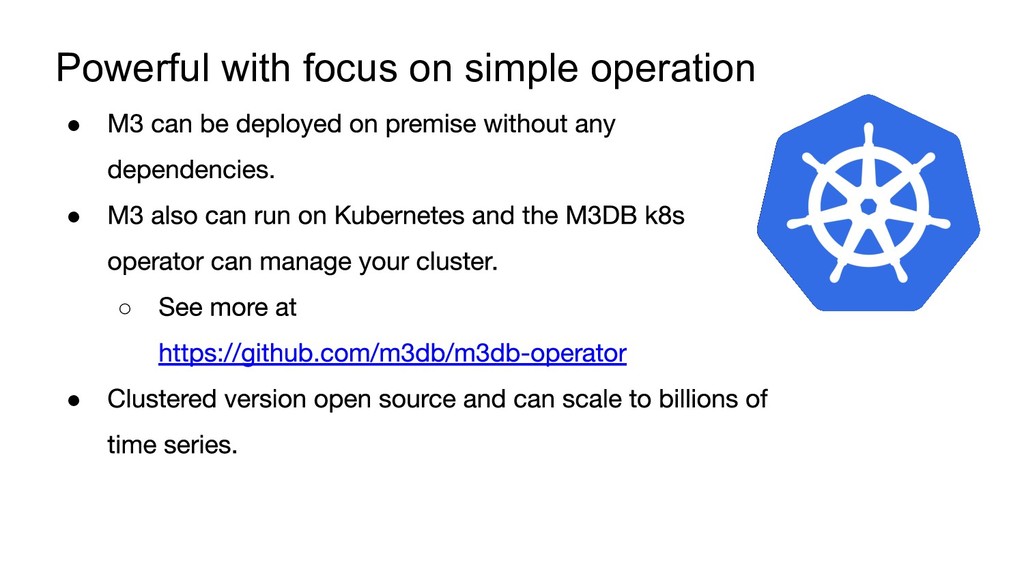
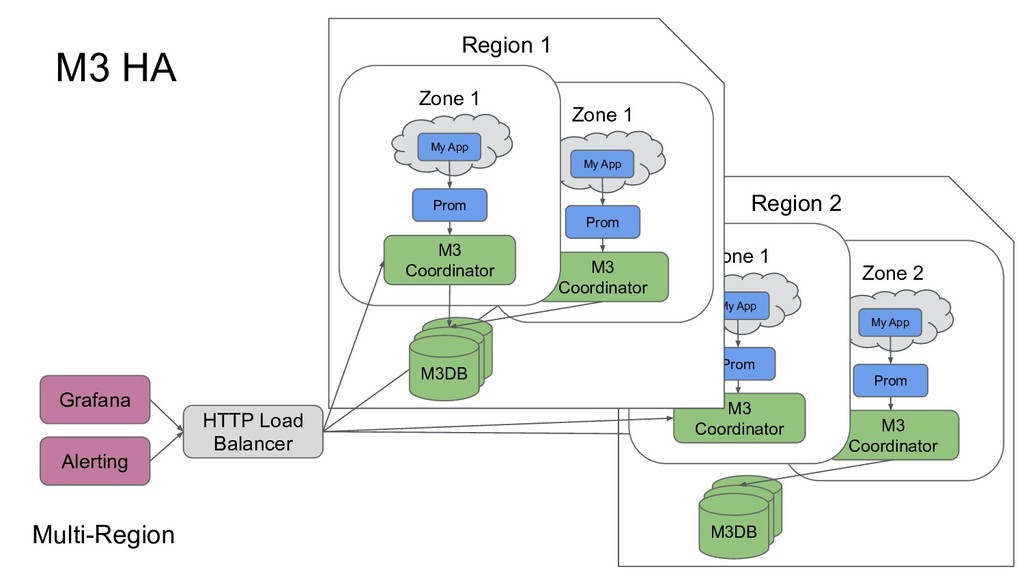
M3 is an open source metrics platform that you can deploy and run using Kubernetes and Helm that integrates with Prometheus. It can store petabytes of metrics data with replication for high availability in a cost efficient manner, with compaction averse time series storage and index that can efficiently index and run dimension based regexp queries on billions of metrics.

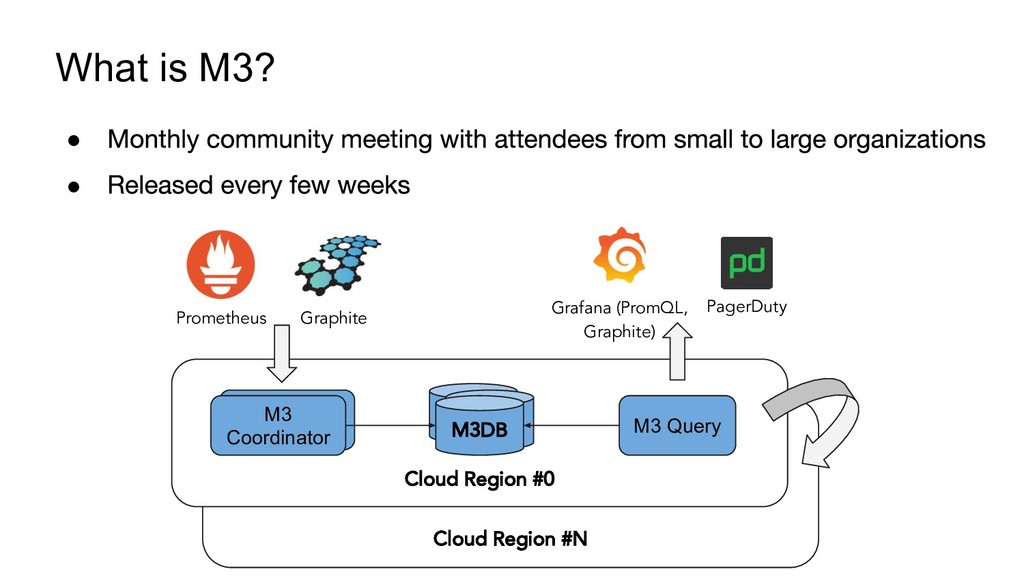
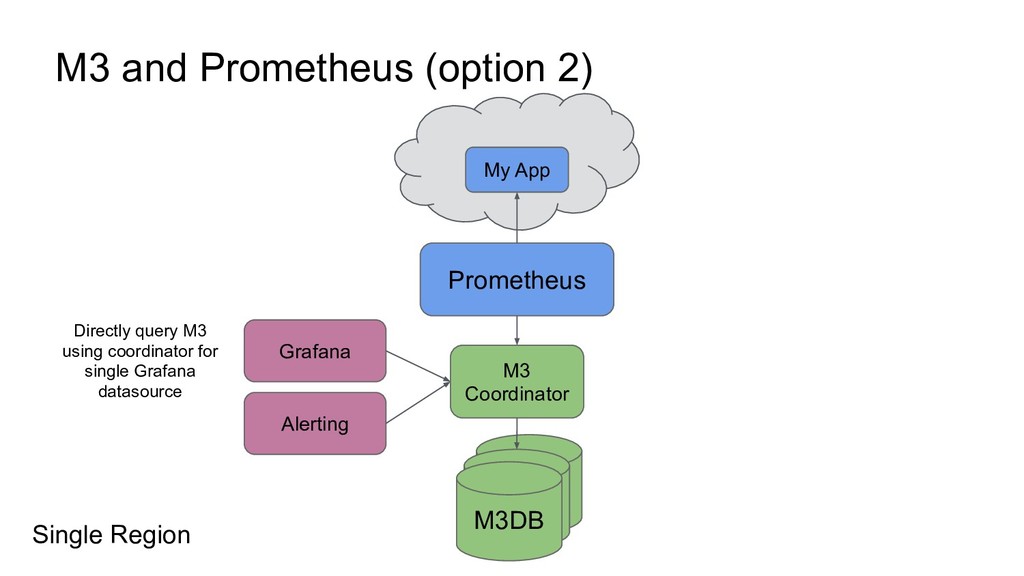
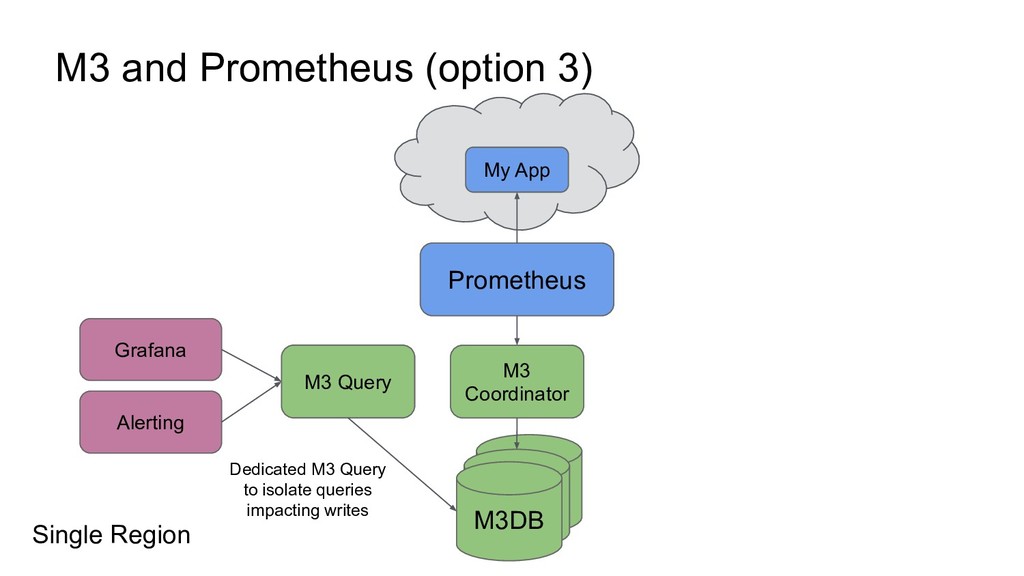
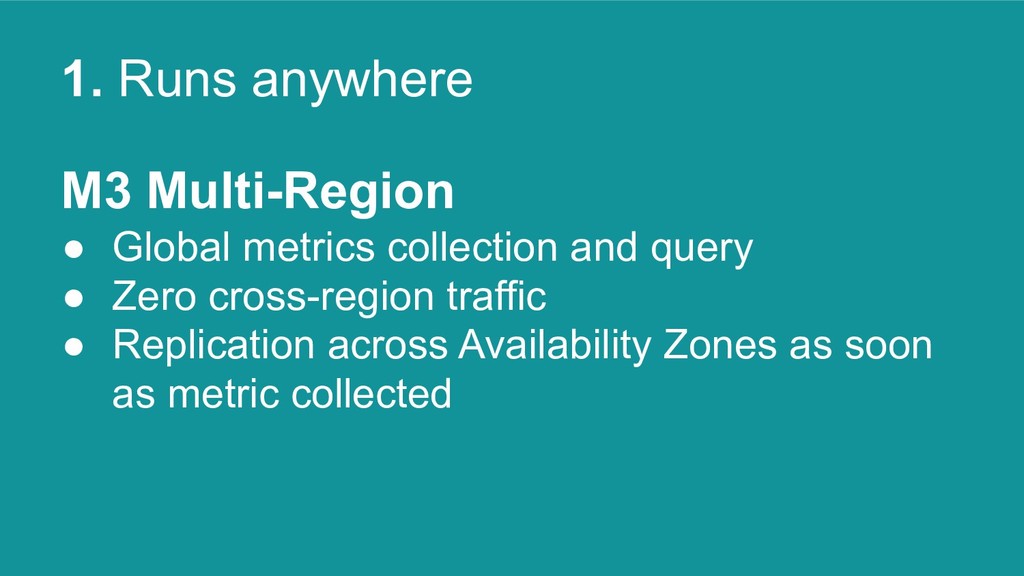
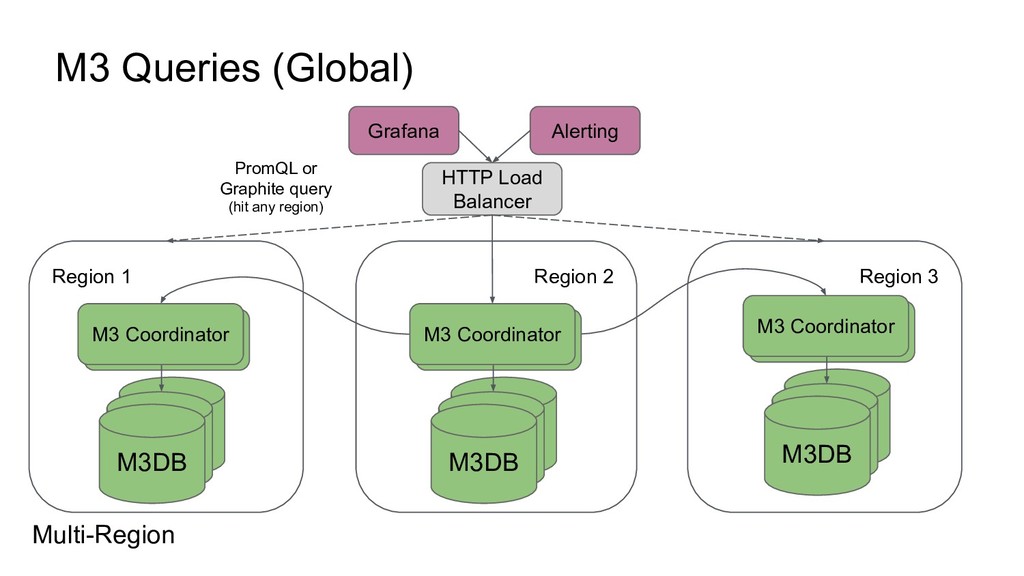
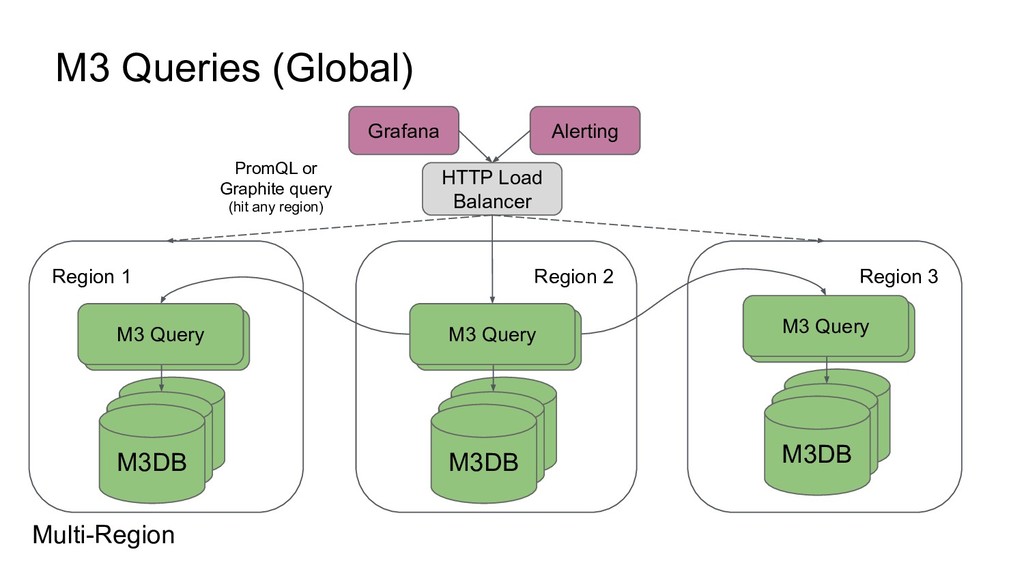
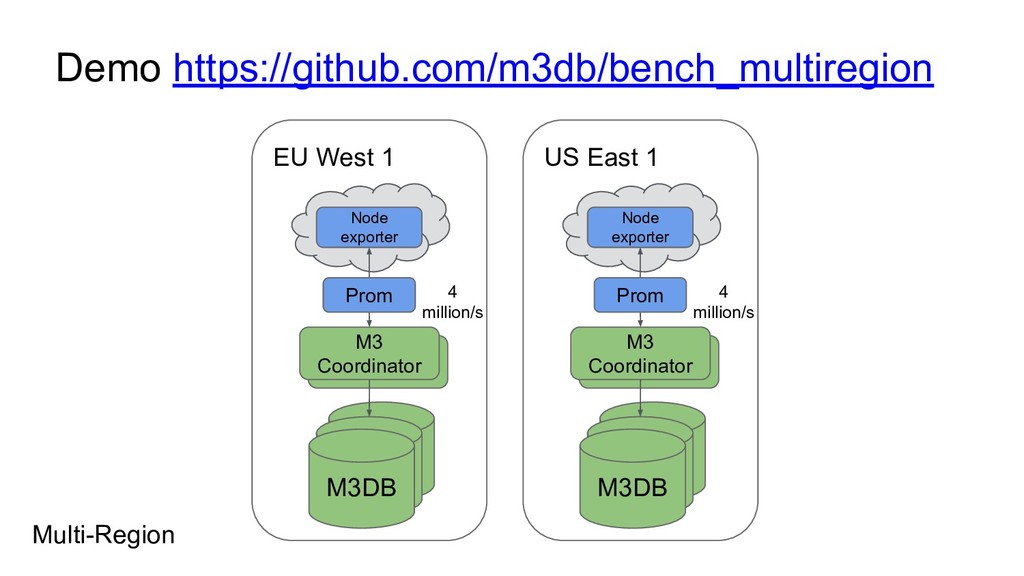
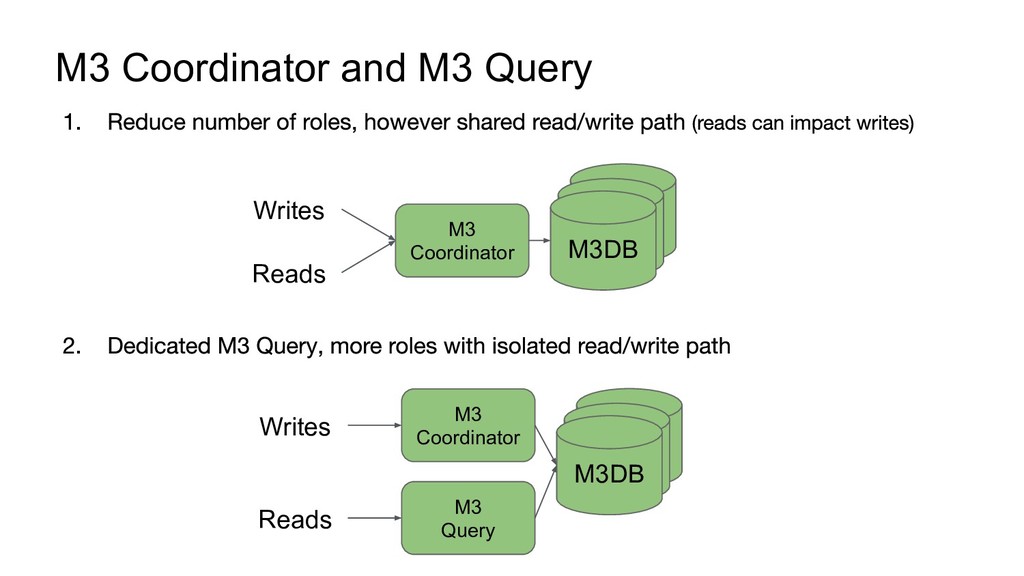
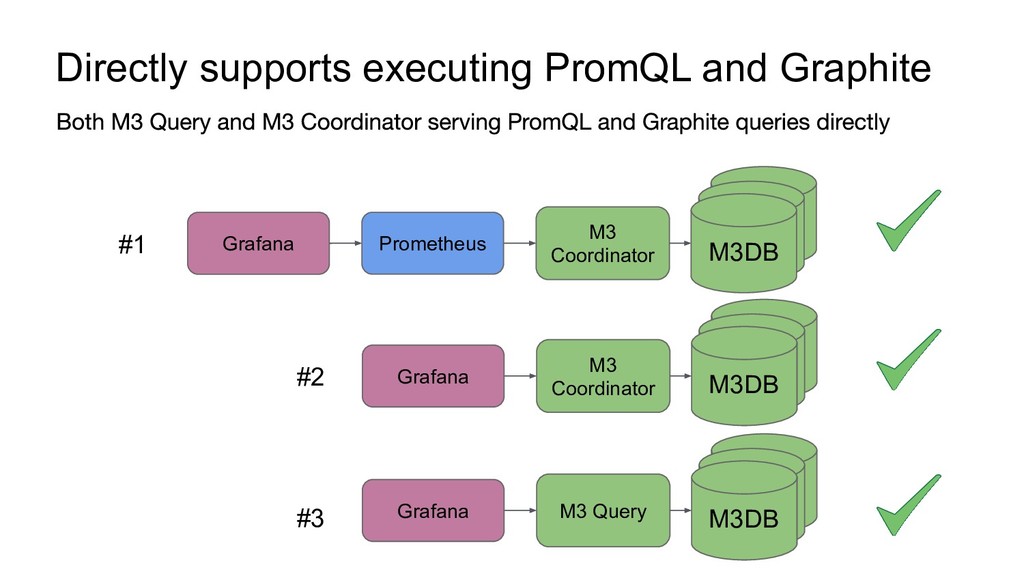
Using a real world example we will cover in this talk how to deploy M3Coordinator and M3DB using the M3 Kubernetes operator and connect your Prometheus instances together into a single global monitoring system.

Avatar for Rob Skillington

Rob Skillington

May 22, 2019
Tweet

More Decks by Rob Skillington

Other Decks in Programming

Transcript

  1. Cloud Region #N What is M3? • • Cloud Region

    #0 M3 Query Aggregation M3 Coordinator Prometheus Graphite Grafana (PromQL, Graphite) PagerDuty M3DB M3DB M3DB
  2. 1. Runs anywhere Why M3 and Prometheus • Store metrics

    for weeks, months or years • Store metrics at different retention based on mapping rules (e.g. app:nginx endpoints:/api*) • Scale up storage just by adding nodes
  3. M3 and Prometheus (option 1) Prometheus My App Grafana Alerting

    Single Region M3 Coordinator M3DB M3DB M3DB Prometheus remote read and write with M3 Coordinator
  4. M3 and Prometheus (option 2) Prometheus My App Grafana Alerting

    Single Region M3 Coordinator M3DB M3DB M3DB Directly query M3 using coordinator for single Grafana datasource
  5. M3 and Prometheus (option 3) Prometheus My App Single Region

    M3 Coordinator M3DB M3DB M3DB Grafana Alerting M3 Query Dedicated M3 Query to isolate queries impacting writes
  6. M3 and Graphite My App Grafana Alerting M3 Coordinator M3DB

    M3DB M3DB Carbon TCP Line Protocol Store Graphite and Prometheus metrics side-by-side
  7. M3 Multi-Region • Global metrics collection and query • Zero

    cross-region traffic • Replication across Availability Zones as soon as metric collected 1. Runs anywhere
  8. Zone 1 M3 Ingestion (Region Local) Single Region M3 Coordinator

    Zone 2 My App M3 Coordinator M3DB M3DB M3DB Prom Cluster configured for replication to isolated by Availability Zone (managed by k8s) My App Prom
  9. Region 3 M3 Coordinator M3DB M3DB M3DB M3 Coordinator M3

    Coordinator Region 1 M3 Queries (Global) M3DB M3DB M3DB Region 2 PromQL or Graphite query (hit any region) M3 Coordinator M3 Coordinator M3DB M3DB M3DB M3 Coordinator HTTP Load Balancer Grafana Alerting Multi-Region
  10. Region 3 M3 Coordinator M3DB M3DB M3DB M3 Query M3

    Coordinator Region 1 M3 Queries (Global) M3DB M3DB M3DB Region 2 PromQL or Graphite query (hit any region) M3 Query M3 Coordinator M3DB M3DB M3DB M3 Query HTTP Load Balancer Grafana Alerting Multi-Region
  11. M3 at Uber • 4,000 plus microservices • No onboarding

    to monitoring or provisioning of servers (just add storage nodes as required) 2. Scalable to billions of metrics
  12. • • ◦ ◦ • • • What’s it used

    for (and why are there so many metrics)
  13. Architected for Reliability and Scale • Each component designed to

    run across Availability Zones in a Region • Low inter-region network bandwidth, data always kept in region 2. Scalable to billions of metrics
  14. Queries executed in distributed and parallel m3coordinator M3 Query Grafana

    M3DB Node M3DB Node M3DB Node ... Each storage node Find metrics matching query and return in parallel knowing exactly where to extract series data from local store. M3DB Node
  15. As opposed to fetch archived data to single node m3coordinator

    Thanos Query Grafana S3 Single query node Read all index and data chunks for time windows included by query, if too much index data then can’t hold it entirely in memory.
  16. Filter and Regexp queries over billions of metrics M3DB doesn’t

    use Go standard Regexp libraries which match each metric through iteration, Finite State Transducer segments (as used by Apache Lucene) are used with upstream changes to the Go Couchbase Vellum library. Index backed by FST segments
  17. 1. Runs anywhere 2. Scalable to billions of metrics 3.

    Focus on simple operability Let’s try it out?
  18. EU West 1 Demo https://github.com/m3db/bench_multiregion Multi-Region M3 Coordinator Node exporter

    M3DB M3DB M3DB 4 million/s Prom US East 1 M3 Coordinator Node exporter M3DB M3DB M3DB 4 million/s Prom
  19. Thank you and Q&A M3 License: Apache 2 Website: https://www.m3db.io

    Repo: https://github.com/m3db/m3 Docs: https://docs.m3db.io Gitter (chat): https://gitter.im/m3db/Lobby Mailing list: https://groups.google.com/forum/#!forum/m3db Blog post: https://eng.uber.com/m3
  20. 2x Prom Zone 2 2x Prom Zone 1 Prometheus HA

    Single Region Zone 1 Prometheus Zone 1 My App Grafana Alerting Zone 2 My App Prometheus Zone 2
  21. Zone 1 2x Prom Zone 1 My App Zone 2

    My App 2x Prom Zone 2 Region 2 Prometheus HA Zone 1 2x Prom Zone 1 My App Grafana Alerting Zone 2 My App 2x Prom Zone 2 Region 1 Multi-Region
  22. Region 2 Zone 2 M3 Coordinator My App Prom Zone

    1 M3 Coordinator M3 DB M3 DB M3DB My App Prom Region 1 M3 HA Multi-Region Zone 1 M3 Coordinator My App Prom Zone 1 M3 Coordinator My App Prom M3 DB M3 DB M3DB Grafana Alerting HTTP Load Balancer
  23. M3 Coordinator and M3 Query M3DB M3DB M3DB M3 Coordinator

    Writes Reads M3DB M3DB M3DB M3 Coordinator Writes Reads M3 Query
  24. Directly supports executing PromQL and Graphite M3DB M3DB M3DB M3

    Coordinator Grafana M3DB M3DB M3DB M3 Coordinator Prometheus Grafana M3DB M3DB M3DB M3 Query Grafana #1 #2 #3