Lock in $30 Savings on PRO—Offer Ends Soon! ⏳

Building and running a world-class observabilit...

Building and running a world-class observability function

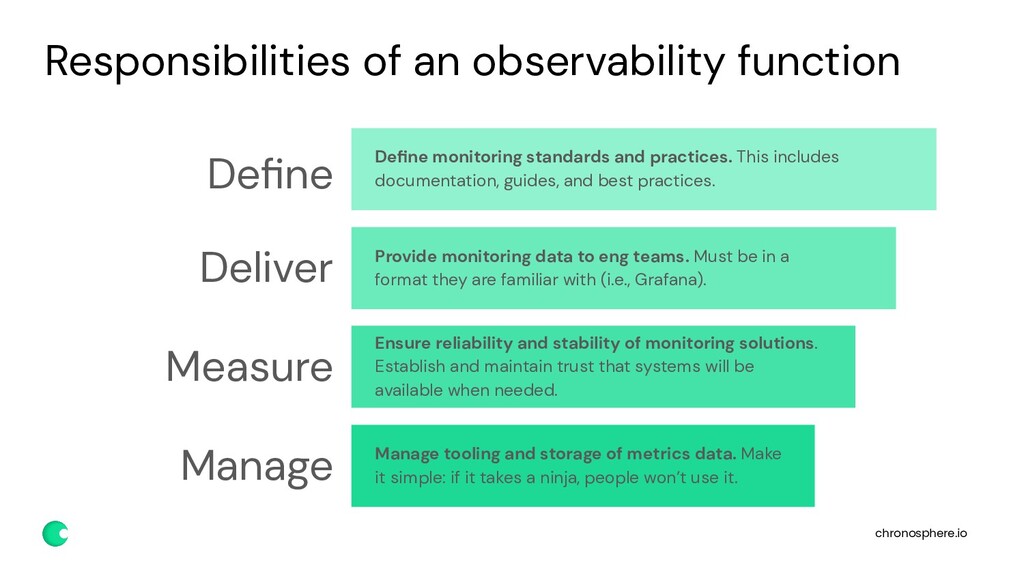
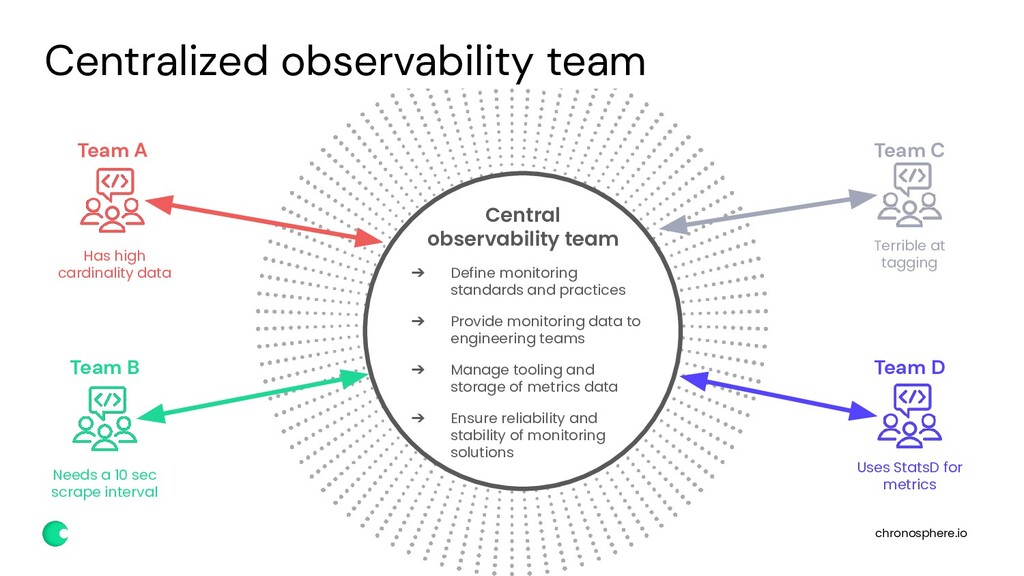
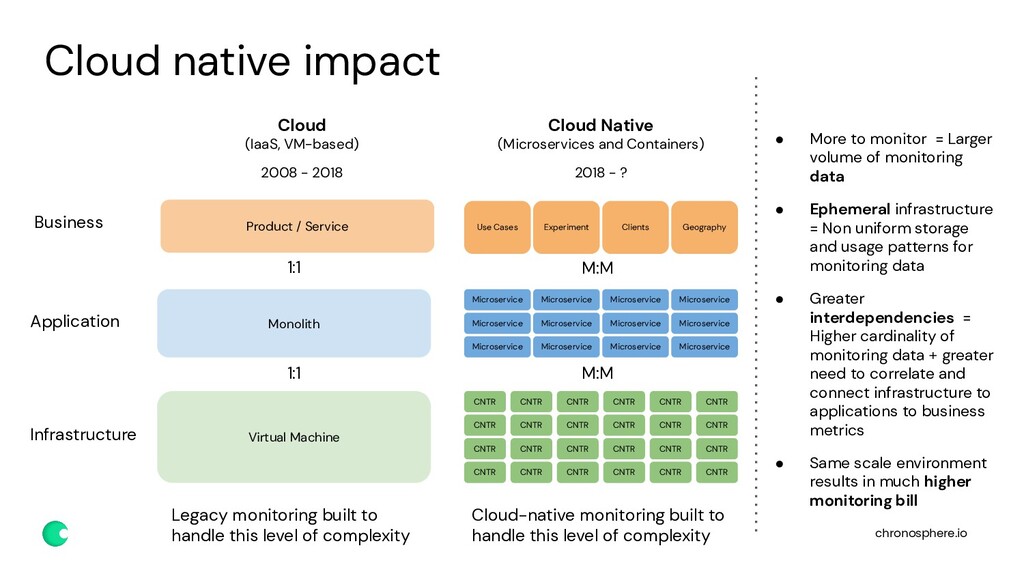
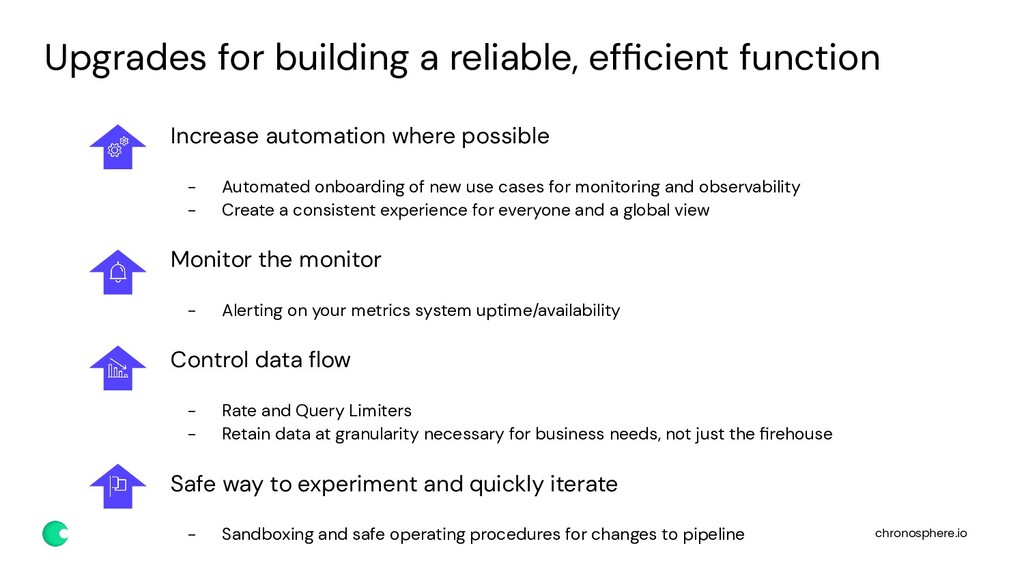
Observability teams as a centralized function within SRE or IT Operations are a relatively recent phenomenon. These teams are responsible for managing the monitoring and observability toolset and empowering developer and engineering teams to push the right data into the systems to get back the information they need. Central observability teams must walk a fine line between controlling cardinality and cost associated with data growth while also providing a complete dataset for quick troubleshooting and diagnostics.

This session will explore the people and process side of observability with lessons learned from the community, including:

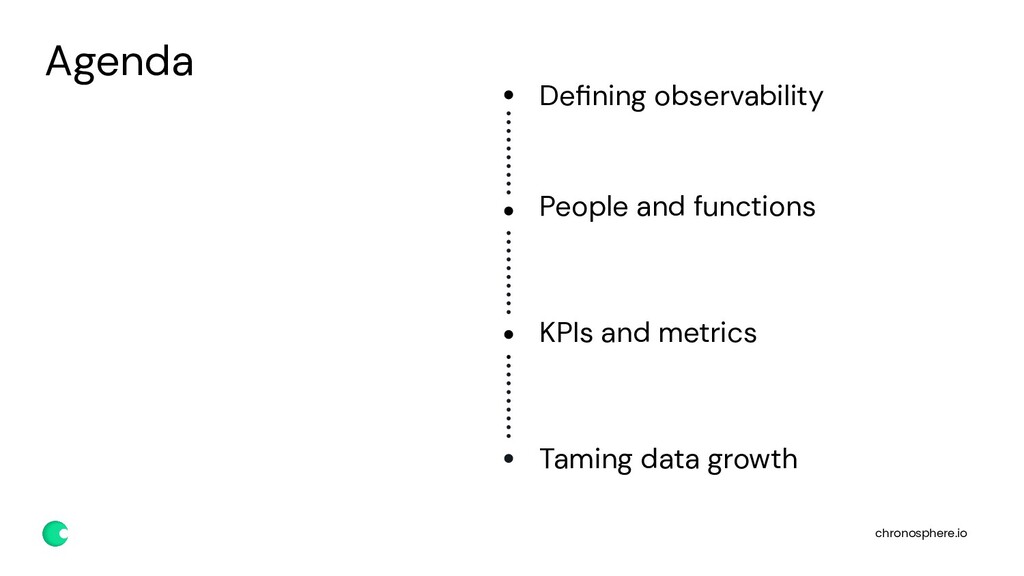
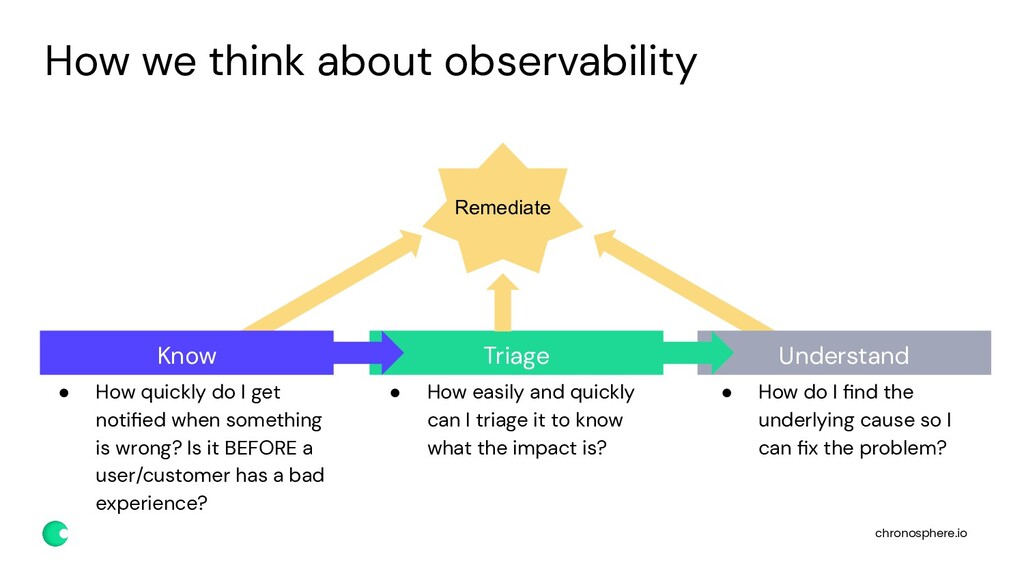
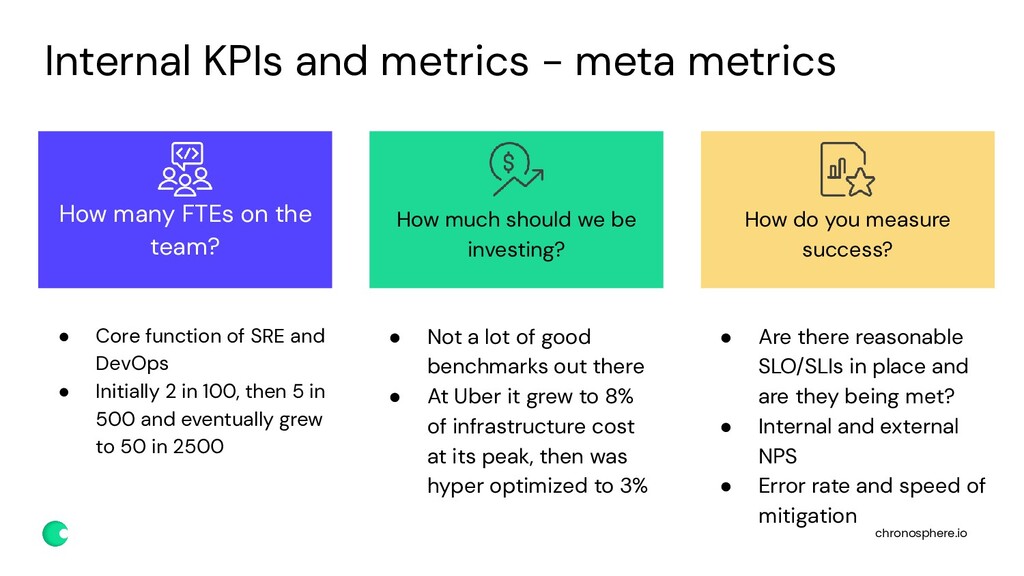
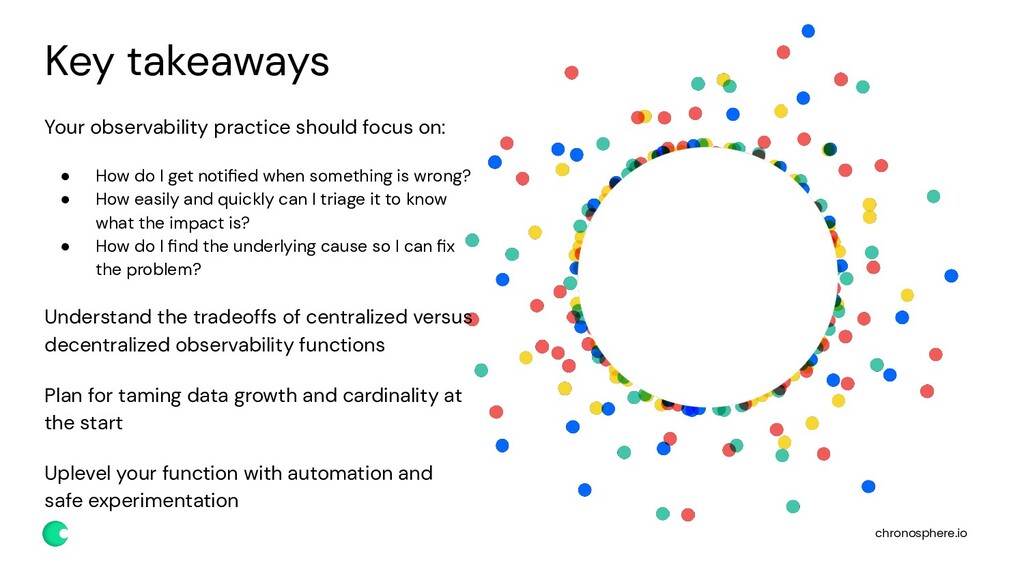
Internal KPIs and metrics: how do you measure the success of your observability practice?

Tagging best practices: how to get tags and labels under control and working to your advantage?

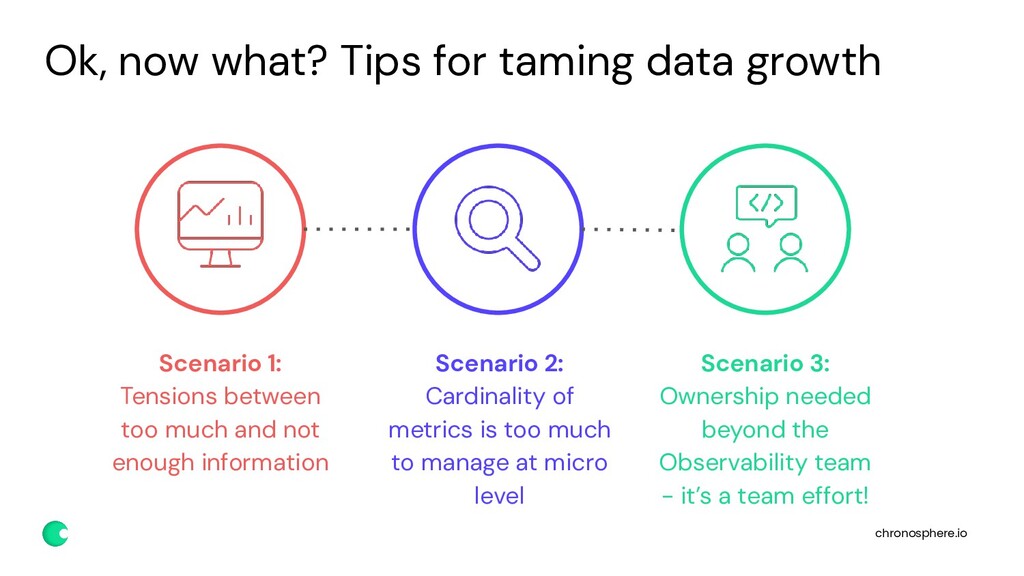
Taming cardinality: What processes can help keep cardinality under control?

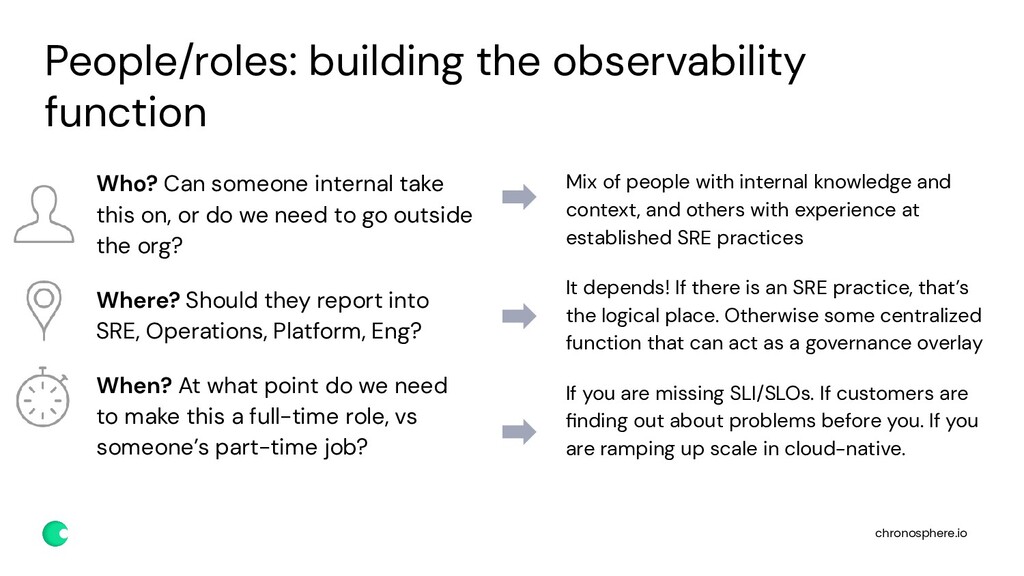
Roles and responsibilities: Who is responsible for running centralized observability functions? How do you know you need a dedicated team and how many people should be on it?

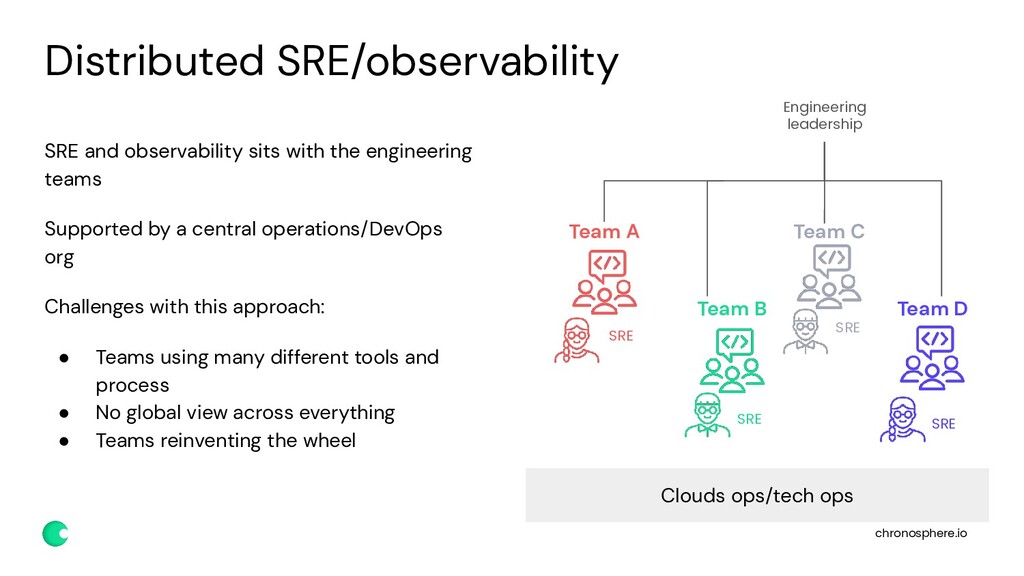
Centralized vs distributed teams: How to manage the balance between individual service teams unique requirements and the need for a centralized and consistent view for SREs.

Avatar for Rob Skillington

Rob Skillington

May 17, 2021
Tweet

More Decks by Rob Skillington

Other Decks in Programming

Transcript

  1. chronosphere.io Rob Skillington, Co-Founder and CTO @ Chronosphere - M3

    Open Source Creator - OpenMetrics Contributor - Twitter: @roskilli About me
  2. chronosphere.io Know Triage Understand How we think about observability •

    How quickly do I get notified when something is wrong? Is it BEFORE a user/customer has a bad experience? • How easily and quickly can I triage it to know what the impact is? • How do I find the underlying cause so I can fix the problem? Remediate
  3. chronosphere.io Responsibilities of an observability function Define Define monitoring standards

    and practices. This includes documentation, guides, and best practices. Deliver Provide monitoring data to eng teams. Must be in a format they are familiar with (i.e., Grafana). Measure Ensure reliability and stability of monitoring solutions. Establish and maintain trust that systems will be available when needed. Manage Manage tooling and storage of metrics data. Make it simple: if it takes a ninja, people won’t use it.
  4. chronosphere.io Who? Can someone internal take this on, or do

    we need to go outside the org? Where? Should they report into SRE, Operations, Platform, Eng? When? At what point do we need to make this a full-time role, vs someone’s part-time job? People/roles: building the observability function Mix of people with internal knowledge and context, and others with experience at established SRE practices It depends! If there is an SRE practice, that’s the logical place. Otherwise some centralized function that can act as a governance overlay If you are missing SLI/SLOs. If customers are finding out about problems before you. If you are ramping up scale in cloud-native.
  5. chronosphere.io SRE and observability sits with the engineering teams Supported

    by a central operations/DevOps org Challenges with this approach: • Teams using many different tools and process • No global view across everything • Teams reinventing the wheel Distributed SRE/observability Team D Team C Team A SRE Team B SRE SRE SRE Engineering leadership Clouds ops/tech ops
  6. chronosphere.io Centralized observability team ➔ Define monitoring standards and practices

    ➔ Provide monitoring data to engineering teams ➔ Manage tooling and storage of metrics data ➔ Ensure reliability and stability of monitoring solutions Central observability team Team B Team D Team C Team A Has high cardinality data Needs a 10 sec scrape interval Uses StatsD for metrics Terrible at tagging
  7. • What you emit and how you consume the telemetry

    data is critical ◦ More data is not more better • Teach the DevOps teams how to fish ◦ According to a GitLab survey, in 2021 only 26% of developers instrument their code for production monitoring (up from 18% in 2020). ◦ Delegate to get to an outsized impact with a small team • Don’t build if you don’t have to! ◦ COTS tools can help ◦ Look for the most user-friendly vendor or open source tooling ◦ Minimal effort, and maximal future proofing Staying focused with a small team
  8. chronosphere.io • Core function of SRE and DevOps • Initially

    2 in 100, then 5 in 500 and eventually grew to 50 in 2500 • Not a lot of good benchmarks out there • At Uber it grew to 8% of infrastructure cost at its peak, then was hyper optimized to 3% Internal KPIs and metrics - meta metrics • Are there reasonable SLO/SLIs in place and are they being met? • Internal and external NPS • Error rate and speed of mitigation How many FTEs on the team? How much should we be investing? How do you measure success?
  9. chronosphere.io 1 Product in 3 Cities 1 Monolith 10s Hosts

    10s Products in 100 Cities 200 Services 1000s VMs 100s Products in 600 Cities 4,000 Microservices 1,000,000s Containers Data Growth @ 1.5B datapoints/s 10X Cost Efficiency 99.99% Reliability Growth in monitoring data at Uber Metrics & Monitoring Team • Founded 2015
  10. chronosphere.io Monolith Microservice Microservice Microservice Microservice Microservice Microservice Virtual Machine

    CNTR Application Infrastructure Microservice Microservice Microservice Microservice Microservice Microservice CNTR CNTR CNTR CNTR CNTR CNTR CNTR CNTR CNTR CNTR CNTR CNTR CNTR CNTR CNTR CNTR CNTR CNTR CNTR CNTR CNTR CNTR CNTR 1:1 1:1 M:M M:M Product / Service Use Cases Experiment Clients Geography Business Cloud (IaaS, VM-based) 2008 - 2018 Cloud Native (Microservices and Containers) 2018 - ? Legacy monitoring built to handle this level of complexity Cloud-native monitoring built to handle this level of complexity • More to monitor = Larger volume of monitoring data • Ephemeral infrastructure = Non uniform storage and usage patterns for monitoring data • Greater interdependencies = Higher cardinality of monitoring data + greater need to correlate and connect infrastructure to applications to business metrics • Same scale environment results in much higher monitoring bill Cloud native impact
  11. chronosphere.io Ok, now what? Tips for taming data growth Scenario

    1: Tensions between too much and not enough information Scenario 2: Cardinality of metrics is too much to manage at micro level Scenario 3: Ownership needed beyond the Observability team - it’s a team effort!
  12. chronosphere.io Increase automation where possible - Automated onboarding of new

    use cases for monitoring and observability - Create a consistent experience for everyone and a global view Monitor the monitor - Alerting on your metrics system uptime/availability Control data flow - Rate and Query Limiters - Retain data at granularity necessary for business needs, not just the firehouse Safe way to experiment and quickly iterate - Sandboxing and safe operating procedures for changes to pipeline Upgrades for building a reliable, efficient function
  13. chronosphere.io Your observability practice should focus on: • How do

    I get notified when something is wrong? • How easily and quickly can I triage it to know what the impact is? • How do I find the underlying cause so I can fix the problem? Understand the tradeoffs of centralized versus decentralized observability functions Plan for taming data growth and cardinality at the start Uplevel your function with automation and safe experimentation Key takeaways