Upgrade to Pro — share decks privately, control downloads, hide ads and more …

What if? Supporting decisions with software dynamics simulations

What if? Supporting decisions with software dynamics simulations

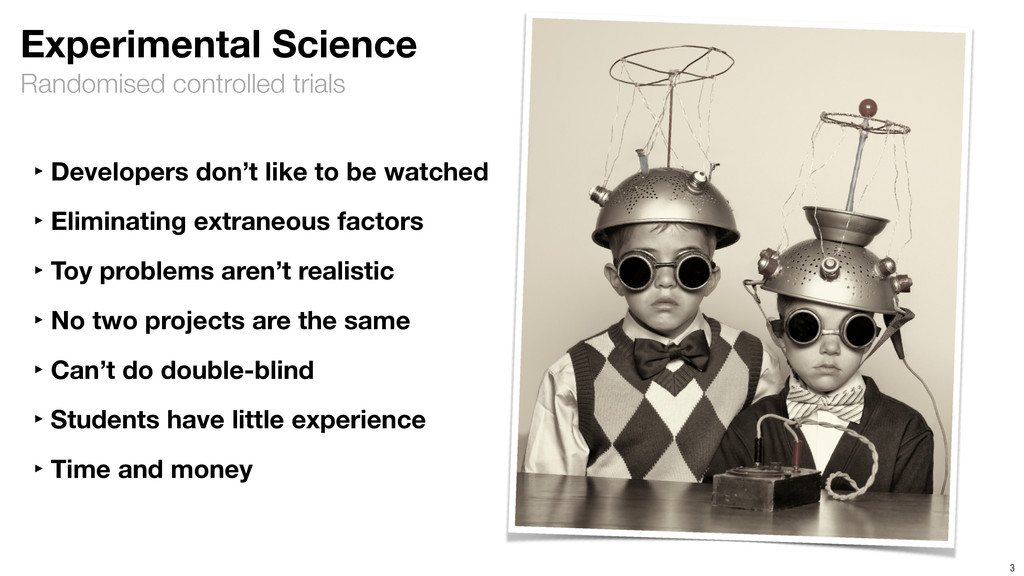
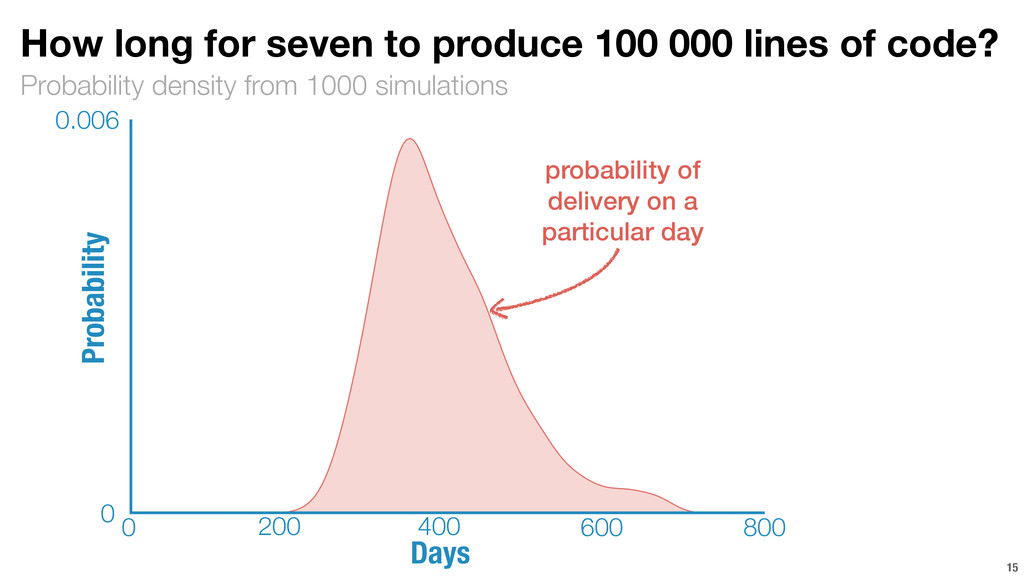
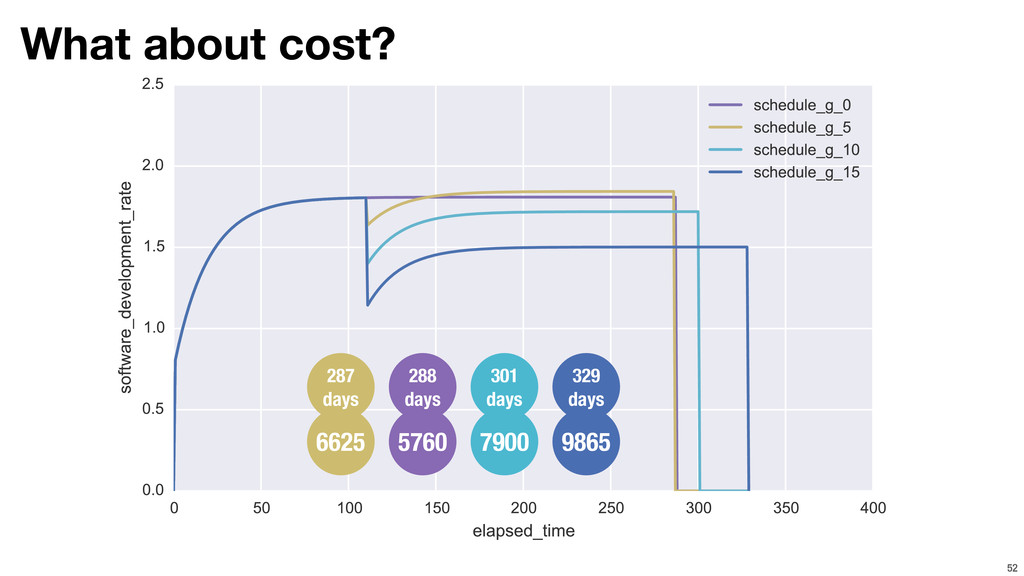
It's awkward to perform science experiments on developers, so let's simulate them instead!

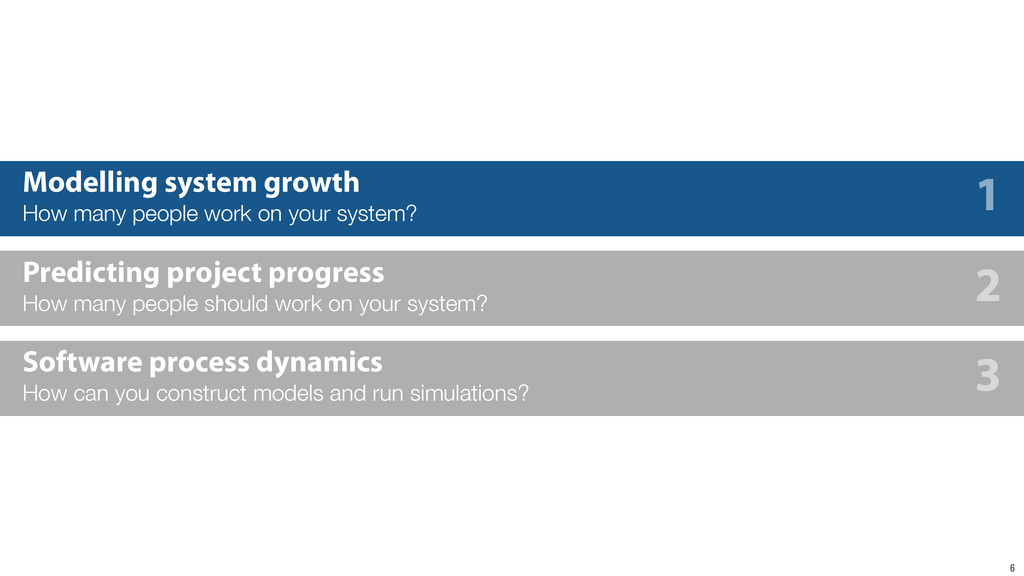
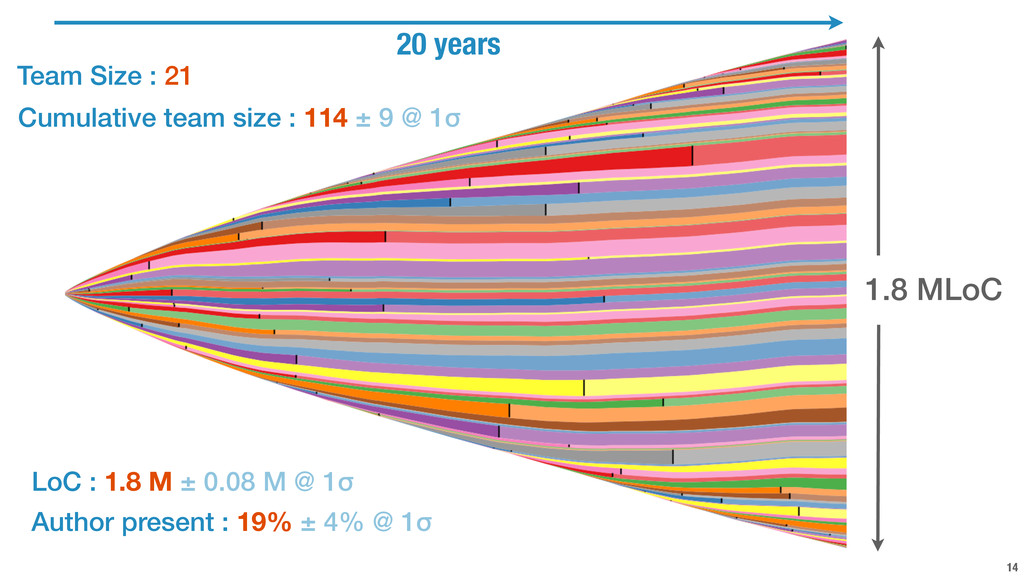
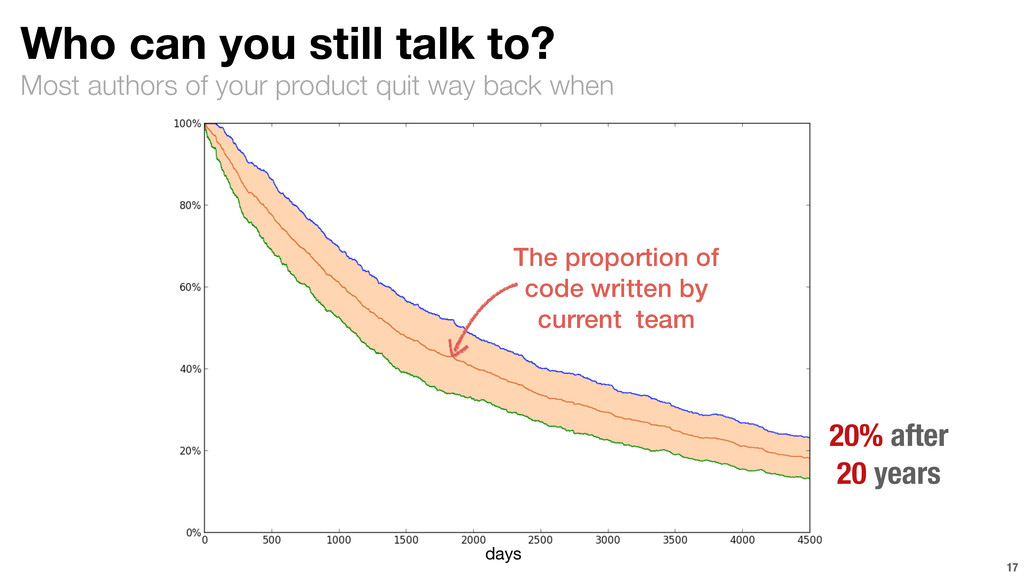
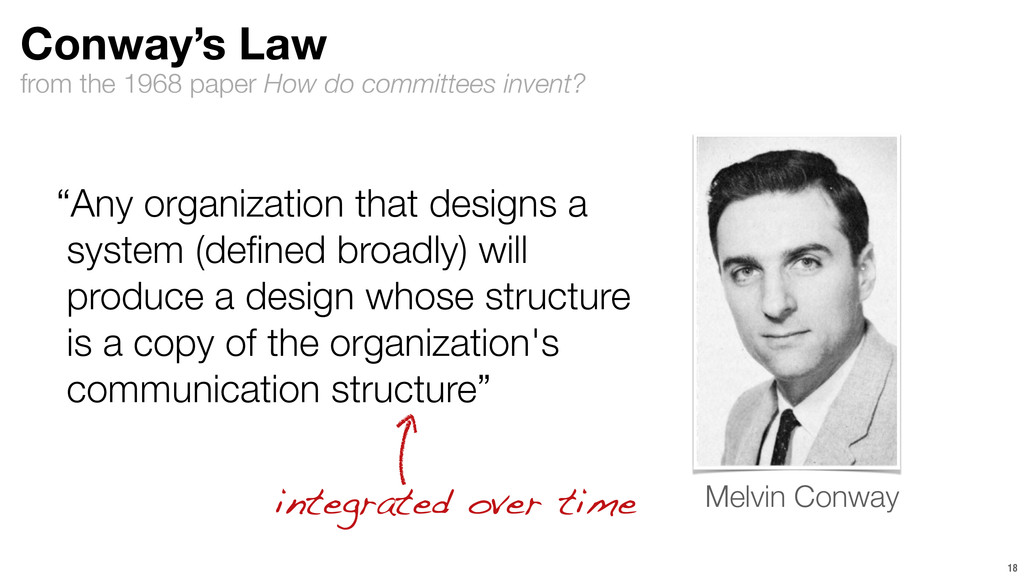
In 1968 Melvin Conway pointed out a seemingly inevitable symmetry between organisations and the software systems they construct. Organisations today are more fluid than 40 years ago, with short developer tenure, and frequent migration of individuals between projects and employers. In this slot we’ll examine - and perhaps collect - data on the tenure and productivity of programmers and use this to gain insight into codebases, by simulating their growth with simple stochastic models. From such models, we can make important predictions about the maintainability and long-term viability of software systems, with implications for how we approach software design, documentation and how we assemble teams.

Robert Smallshire

October 15, 2015
Tweet

More Decks by Robert Smallshire

Other Decks in Programming

Transcript

  1. 2

  2. Randomised controlled trials 3 Experimental Science ‣ Developers don’t like

    to be watched ‣ Eliminating extraneous factors ‣ Toy problems aren’t realistic ‣ No two projects are the same ‣ Can’t do double-blind ‣ Students have little experience ‣ Time and money
  3. 4

  4. How can we know? 5 Prediction Comparison Modelling Observation Formulate

    a hypothesis. Design a conceptual model. Run simulations. Observe and record reality. Validate or refute the model. 1 2 3 4
  5. 6 Modelling system growth How many people work on your

    system? Predicting project progress How many people should work on your system? Software process dynamics How can you construct models and run simulations? 1 2 3
  6. Systems and their architectures are long lived Lifetimes in the

    software industry 7 Category Title Developers Windows XP Applications CEOs Lines of code FTSE100 Classes Modules 0 15 30 45 60 58 37 22 13 6.8 6.2 4.7 3.1 Sources: Software Lifetime and its Evolution Process over Generations, CEO Succession Practices: 2012 Edition, Investors Chronicle, Half-lives of software related entities The number of years over which half the entities are replaced
  7. 0 10000 30000 20000 Draw teams at random from a

    productivity distribution Simulating Developer Productivity 8 1 Productivity SLOC/year Productivity on 10000 SLOC codebase Probability Density 0% 50% 100% Cumulative Probability max min mode triangular distribution cumulative distribution function
  8. 9

  9. 100 1000 10000 100000 1000 10000 100000 1000000 10000000 Productivity

    (Lines of Code / Year) Total Lines of Code Use published productivity data to forward model code size. Modelling team and code evolution 10 Sources: COCOMO II At any given system size we can predict a distribution for developer productivity. Dramatically less productive on larger code bases 29000 5500
  10. 11 start with nothing some developers contribute more others less

    when a developer leaves After 5 years we have 235 k lines of code written by a total of
 19 people.
 Only 37% of the code is by current team 5 years Simulating a team of seven over five years they are replaced
  11. 12

  12. 13 157 kLoC Cumulative team size : 11 ± 2

    @ 1σ Team Size : 7 LoC : 157 k ± 23 k @ 1σ Author present : 70% ± 14% @ 1σ 3 years
  13. 14 1.8 MLoC Cumulative team size : 114 ± 9

    @ 1σ Team Size : 21 LoC : 1.8 M ± 0.08 M @ 1σ Author present : 19% ± 4% @ 1σ 20 years
  14. Probability density from 1000 simulations How long for seven to

    produce 100 000 lines of code? 15 probability of delivery on a particular day 200 400 600 800 0 Days 0 0.006 Probability
  15. Cumulative probability from 1000 simulations 16 How long for 7

    to produce 100 000 lines of code? 200 400 600 800 0 Days 100% Cumulative Probability 0% 20% 80% probability of delivery before a particular day 330 470
  16. Most authors of your product quit way back when Who

    can you still talk to? 17 days 20% after 20 years The proportion of code written by current team
  17. from the 1968 paper How do committees invent? 18 Conway’s

    Law Melvin Conway “Any organization that designs a system (defined broadly) will produce a design whose structure is a copy of the organization's communication structure” integrated over time
  18. 19 Modelling system growth How many people work on your

    system? Predicting project progress How many people should work on your system? Software process dynamics How can you construct models and run simulations? 1 2 3
  19. 20

  20. 22 “Adding manpower to a late software project makes it

    later.” Fred Brooks / The Mythical Man-Month Wikimedia Commons
  21. How can we know? 23 Prediction Comparison Modelling Observation Formulate

    a hypothesis. Design a conceptual model. Run simulations. Observe and record reality. Validate or refute the model. 1 2 3 4
  22. Model systems for improving structures, policies and interventions System dynamics

    simulations ‣ Define problem dynamically – over time ‣ Endogenous view of significant dynamics ‣ Model reproduces problem of concern ‣ Derive understanding 24
  23. Events or equations? Discrete versus continuous modelling 25 Discrete ‣

    Individuals ‣ Populations ‣ Definite events ‣ Probability distributions ‣ Stochastic ‣ Concrete scenarios ‣ Harder to formulate as code Continuous ‣ Aggregates ‣ Levels of quantities ‣ Flow rates ‣ Equations ‣ Numerical / analytical solutions ‣ More abstract ‣ Easier to formulate as code
  24. Elements of continuous models 26 personnel hiring
 rate attrition
 rate

    desired
 personnel level Source Supply outside model boundary Sink Repository outside model boundary Rate Flows cause changes in levels Auxiliary Constants or score-keeping variables Level Repository, stock, or accumulation, inside model boundary
  25. 30 Schedule A (Baseline) ! 500 function points 20 personnel

    0.1 fps/person/day
 ! 250 days to completion
  26. 31 requirements (unrealised) developed software new personnel experienced
 personnel software

    development rate assimilation rate nominal productivity Brooks' Law model personnel allocation rate
  27. 32 Schedule B ! 500 function points 20 inexperienced personnel

    0.08 fps/person/day
 ! 313 days to completion
  28. 33 requirements (unrealised) developed software new personnel experienced
 personnel software

    development rate assimilation rate nominal productivity Brooks' Law model personnel allocation rate
  29. 34 Schedule C ! 500 function points 20 inexperienced personnel

    20 day assimilation delay
 ! 215 days to completion
  30. 35 requirements (unrealised) developed software new personnel experienced
 personnel software

    development rate assimilation rate nominal productivity experienced personnel for training training overhead Brooks' Law model personnel allocation rate
  31. 36 Schedule D ! 500 function points 20 inexperienced personnel

    20 day assimilation delay 25% of an experienced person needed for training each new person during assimilation
 ! 220 days to completion
  32. 37 requirements (unrealised) developed software new personnel experienced
 personnel software

    development rate assimilation rate nominal productivity experienced personnel for training communication overhead training overhead Brooks' Law model personnel allocation rate
  33. 38 Schedule E ! 500 function points 20 inexperienced personnel

    20 day assimilation delay 25% of an experienced person needed for training each new person during assimilation Abdel-Hamid quadratic communication overhead
 ! 286 days to completion
  34. 39 Schedule E ! 500 function points 20 inexperienced personnel

    20 day assimilation delay 25% of an experienced person needed for training each new person during assimilation Abdel-Hamid quadratic communication overhead
 ! 286 days to completion
  35. 40 Schedule E Assimilation Delay Sensitivity Analysis ! 10 day

    280 days 20 day 286 days 30 day 292 days
  36. 41 requirements (unrealised) developed software new personnel experienced
 personnel software

    development rate assimilation rate nominal productivity experienced personnel for training communication overhead training overhead planned completion Brooks' Law model personnel allocation rate
  37. 42 import brooks.communication ! ! def initial(): """Configure the initial

    model state.""" return dict( step_duration_days=1, num_function_points_requirements=500, num_function_points_developed=0, num_new_personnel=20, num_experienced_personnel=0, personnel_allocation_rate=0, personnel_assimilation_rate=0, assimilation_delay_days=20, nominal_productivity=0.1, new_productivity_weight=0.8, experienced_productivity_weight=1.2, training_overhead_proportion=0.25, communication_overhead_function=brooks.communication.quadratic_overhead_proportion, software_development_rate=None, ) ! ! def intervene(step_number, elapsed_time, state): """Intervene in the current step before the main simulation step is executed.""" return state ! ! def is_complete(step_number, elapsed_time_seconds, state): """Determine whether the simulation should end.""" return state.num_function_points_developed >= state.num_function_points_requirements ! ! def complete(step_number, elapsed_time_seconds, state): """Finalise the simulation state for the last recorded step.""" state.software_development_rate = 0 return state schedule_e.py
  38. 43 import brooks.communication ! ! def initial(): """Configure the initial

    model state.""" return dict( step_duration_days=1, num_function_points_requirements=500, num_function_points_developed=0, num_new_personnel=20, num_experienced_personnel=0, personnel_allocation_rate=0, personnel_assimilation_rate=0, assimilation_delay_days=20, nominal_productivity=0.1, new_productivity_weight=0.8, experienced_productivity_weight=1.2, training_overhead_proportion=0.25, communication_overhead_function=brooks.communication.quadratic_overhead_proportion, software_development_rate=None, ) ! ! def intervene(step_number, elapsed_time, state): """Intervene in the current step before the main simulation step is executed.""" if elapsed_time == 110: state.num_new_personnel += 5 return state ! ! def is_complete(step_number, elapsed_time_seconds, state): """Determine whether the simulation should end.""" return state.num_function_points_developed >= state.num_function_points_requirements ! ! def complete(step_number, elapsed_time_seconds, state): """Finalise the simulation state for the last recorded step.""" state.software_development_rate = 0 return state schedule_f_5.py
  39. 44 Schedule F 5 Add 5 new personnel on day

    110 ! Schedule E : 286 days Schedule F5 : 283 days
  40. 47 Schedule F 10 Add 10 new personnel on day

    110 ! Schedule E : 286 days Schedule F5 : 283 days Schedule F10 : 307 days
  41. 49 ValueError: Communication overhead proportion personnel number 34.9 out of

    range Model limitations ! Prevent extrapolation outside reasonable bounds!
  42. 50

  43. 51

  44. 53 Modelling system growth How many people work on your

    system? Predicting project progress How many people should work on your system? Software process dynamics How can you construct models and run simulations? 1 2 3
  45. Program it yourself ‣ Python ‣ Matplotlib (charting) ‣ Pandas

    (tables, time-series) ‣ Numpy (fast numerics) 55
  46. 56

  47. ‣ Secure buy-in for modelling and models ‣ Parameterise the

    model ‣ As simple as possible, but no simpler ‣ Be clear on system boundary / assumptions ‣ Experiment! ‣ Discuss results 59
  48. 62

  49. 63