$30 off During Our Annual Pro Sale. View Details »

Performance is no more a curse

Performance is no more a curse

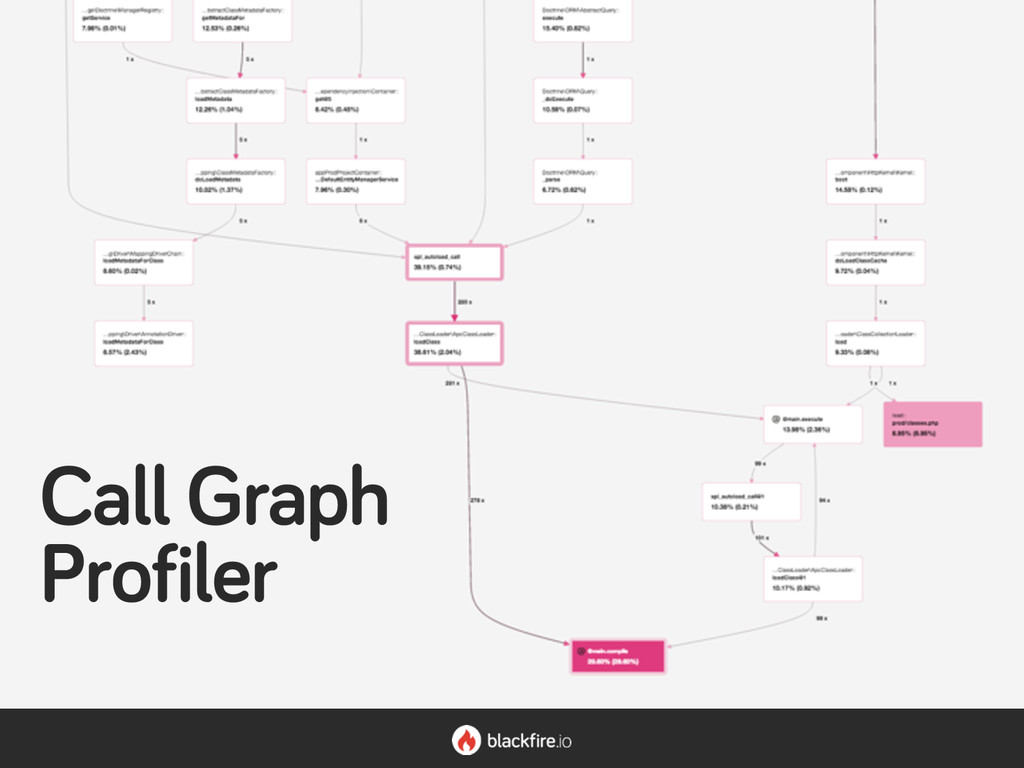
I bet you are writing unit tests for your apps; if not, you probably feel ashamed. But what about performance? Everyone is talking about it but very few people actually integrate performance into their development workflow... After some quick theory, I will show you how to use Blackfire that makes it so easy to profile your apps that you won't have any more excuses anymore for not doing it. Finally, I will talk about my new holy grail: Continuous Performance Profiling.

Romain Neutron

September 15, 2015
Tweet

More Decks by Romain Neutron

Other Decks in Programming

Transcript

  1. Performance
    is no more a
    curse

    with
    RomainNeutron
    https://www.flickr.com/photos/latitudes/348189242

    View Slide

  2. Romain Neutron


    Blackfire.io developer

    OpenSource contributor


    https://github.com/romainneutron
    https://twitter.com/romainneutron

    View Slide

  3. Why Profiling?
    https://www.flickr.com/photos/latitudes/348189242

    View Slide

  4. https://www.flickr.com/photos/latitudes/348189242
    Performance
    means Resources
    Less CPU
    Less Memory
    Less Network
    Less Servers
    ...

    Sustainable computing

    View Slide

  5. Performance
    means Business
    More repeat business
    More page views per visit
    Better conversions
    More revenue
    Increased user satisfaction
    ...
    http://www.slideshare.net/stoyan/the-business-of-performance

    View Slide

  6. abandon a website that
    takes more than
    3 seconds to load
    40% of users

    View Slide

  7. -100ms
    +1%

    revenue
    -2.2s
    +15%

    downloads

    View Slide

  8. Performance as a feature
    https://www.flickr.com/photos/jprovost/5733297977

    View Slide

  9. Profiling
    Benchmarking
    Load-testing
    Monitoring
    https://www.flickr.com/photos/fallsroad/13240207

    View Slide

  10. Performance?

    View Slide

  11. microtime()
    https://www.flickr.com/photos/rainriver/6967744353

    View Slide

  12. Instrumentation
    https://www.flickr.com/photos/dlajholt/4939986995/

    View Slide

  13. Wall Clock Time
    https://www.flickr.com/photos/guiseiz/6094701062

    View Slide

  14. function foo()

    {
    bar();

    echo 'foo';

    }

    foo();
    Wall-Clock Time

    View Slide

  15. function foo()

    {
    bar();

    echo 'foo';

    }

    foo();
    Inclusive Time

    View Slide

  16. Inclusive Time
    Critical path of an app

    View Slide

  17. function foo()

    {
    bar();

    echo 'foo';

    }

    foo();
    Exclusive Time

    View Slide

  18. Exclusive Time
    Find the functions to optimize first

    View Slide

  19. Wall Time = CPU + I/O
    I/O = Network + Disk

    View Slide

  20. Memory

    View Slide

  21. Call Graph
    Profiler

    View Slide

  22. The easiest way to profile applications
    in the development but also in the production environment
    The best visualization tool for interpreting profiling traces
    for memory, CPU, I/O and for all languages*
    * Specific extension for PHP, callgrind for other languages

    View Slide

  23. Browser
    Companion
    PHP
    Probe Agent
    10/ Upload
    aggregated
    profile
    1/ Sign request
    2/ Signed request
    3/ Create profile
    4/ Check signature
    5/ Request
    6/ Response
    7/ Send profile
    8/ Continue or stop
    9/ Continue or stop
    Storage
    11/ Store

    View Slide

  24. LA DEMO

    View Slide

  25. Continuous Performance

    View Slide

  26. Performance Tests
    https://www.flickr.com/photos/garrett/2548828323/

    View Slide

  27. # ~/workspace/projet/.blackfire.yml


    tests:

    "Pages should be fast enough":

    path: "/.*"

    assertions:

    - "main.wall_time < 300ms"

    - "main.memory < 50M"

    - "main.peak_memory < 75M"

    - "main.io < 20ms"

    - "main.cpu_time < 100ms"

    "Pages should not do too many SQL queries":

    path: "/.*"

    assertions:

    - "metrics.sql.queries.count <= 12"

    "Pages should be light":

    path: "/.*"

    assertions:

    - "metrics.output.network_out < 100KB"

    "Pages should not become slower":

    path: "/.*"

    assertions:

    - "percent(main.wall_time) < 10%"

    - "diff(metrics.sql.queries.count) < 2"

    .blackfire.yml

    View Slide

  28. # ~/workspace/projet/.blackfire.yml


    tests:

    "Page should not tag a graph":

    path: ".*"

    assertions:

    - “metrics.process.run.count == 0"


    metrics:

    process.run:

    label: “Run a process"

    layer: ~

    matching_calls:

    php:

    - callee: “=proc_open"
    Custom Metrics

    View Slide

  29. Try it today!
    @blackfireio #blackfireio
    OSLEZMEETUP092015

    View Slide