Upgrade to Pro
— share decks privately, control downloads, hide ads and more …
Speaker Deck
Features
Speaker Deck
PRO
Sign in
Sign up for free
Search
Search
Performance Testing using DTrace
Search
Sponsored
·
Your Podcast. Everywhere. Effortlessly.
Share. Educate. Inspire. Entertain. You do you. We'll handle the rest.
→
Renzo Crisóstomo
February 14, 2018
Programming
2
120
Performance Testing using DTrace
Slides from the presentation given at CocoaHeads Berlin February 2018 meet up.
Renzo Crisóstomo
February 14, 2018
Tweet
Share
More Decks by Renzo Crisóstomo
See All by Renzo Crisóstomo
Continuous Integration in a monorepo
ruenzuo
0
500
Secret History: xcconfig files
ruenzuo
0
66
!Introducing Swift in large code bases
ruenzuo
1
82
Scheduled Releases
ruenzuo
0
36
Other Decks in Programming
See All in Programming
The Past, Present, and Future of Enterprise Java
ivargrimstad
0
600
Claude Codeセッション現状確認 2026福岡 / fukuoka-aicoding-00-beacon
monochromegane
4
430
クライアントワークでSREをするということ。あるいは事業会社におけるSREと同じこと・違うこと
nnaka2992
1
340
文字コードの話
qnighy
44
17k
The Past, Present, and Future of Enterprise Java
ivargrimstad
0
600
Unity6.3 AudioUpdate
cova8bitdots
0
140
コーディングルールの鮮度を保ちたい / keep-fresh-go-internal-conventions
handlename
0
200
ポーリング処理廃止によるイベント駆動アーキテクチャへの移行
seitarof
3
1.1k
エラーログのマスキングの仕組みづくりに役立ったASTの話
kumoichi
0
230
技術検証結果の整理と解析をAIに任せよう!
keisukeikeda
0
120
オブザーバビリティ駆動開発って実際どうなの?
yohfee
3
860
仕様漏れ実装漏れをなくすトレーサビリティAI基盤のご紹介
orgachem
PRO
0
120
Featured
See All Featured
Un-Boring Meetings
codingconduct
0
230
Put a Button on it: Removing Barriers to Going Fast.
kastner
60
4.2k
Taking LLMs out of the black box: A practical guide to human-in-the-loop distillation
inesmontani
PRO
3
2.1k
<Decoding/> the Language of Devs - We Love SEO 2024
nikkihalliwell
1
160
Fireside Chat
paigeccino
42
3.8k
Tips & Tricks on How to Get Your First Job In Tech
honzajavorek
0
460
Art, The Web, and Tiny UX
lynnandtonic
304
21k
JavaScript: Past, Present, and Future - NDC Porto 2020
reverentgeek
52
5.9k
Side Projects
sachag
455
43k
The innovator’s Mindset - Leading Through an Era of Exponential Change - McGill University 2025
jdejongh
PRO
1
130
Agile Leadership in an Agile Organization
kimpetersen
PRO
0
110
Performance Is Good for Brains [We Love Speed 2024]
tammyeverts
12
1.5k
Transcript
PERFORMANCE TESTING USING DTRACE
MOTIVATION
NON-FUNCTIONAL SOFTWARE REQUIREMENTS
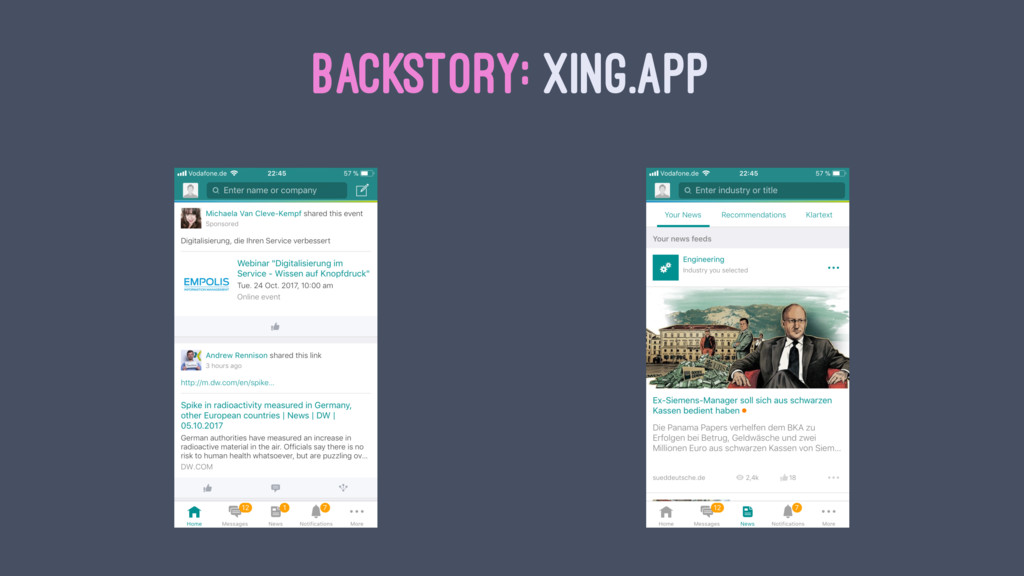
BACKSTORY: XING.APP
MEASURING PERFORMANCE WITH XCODE > CACurrentMediaTime / mach_absolute_time() > dispatch_benchmark
> -[XCTestCase measureBlock:]
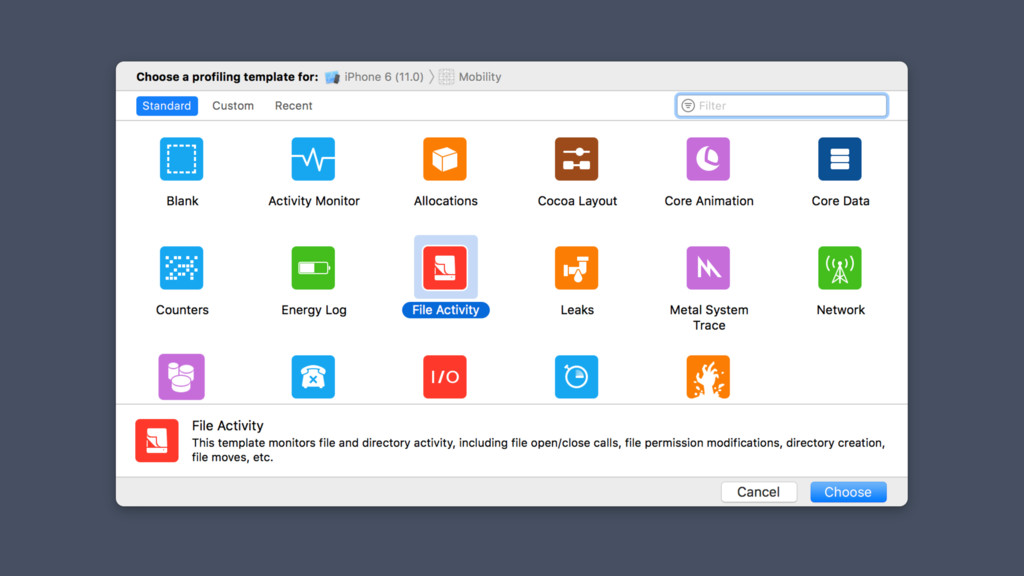
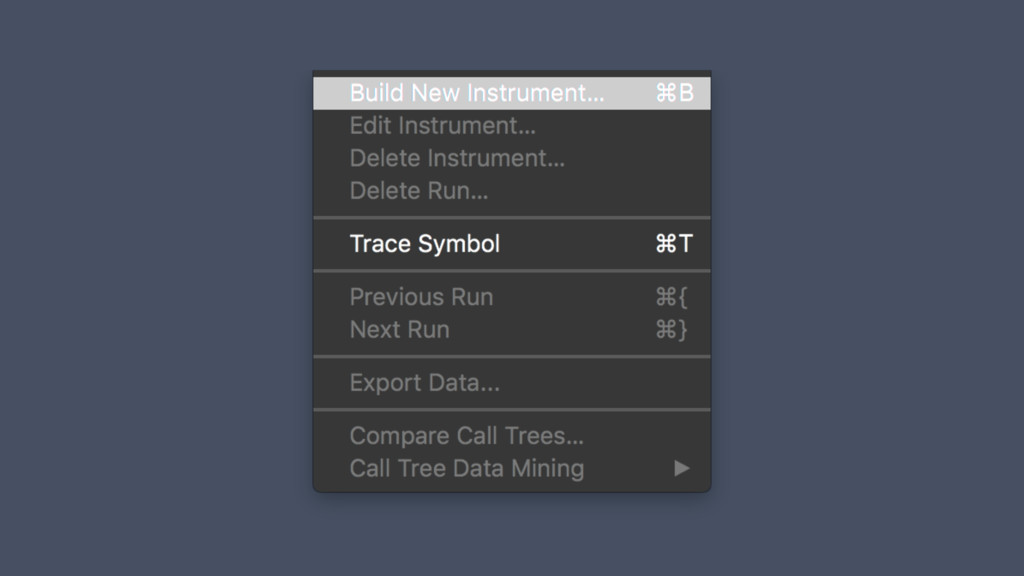
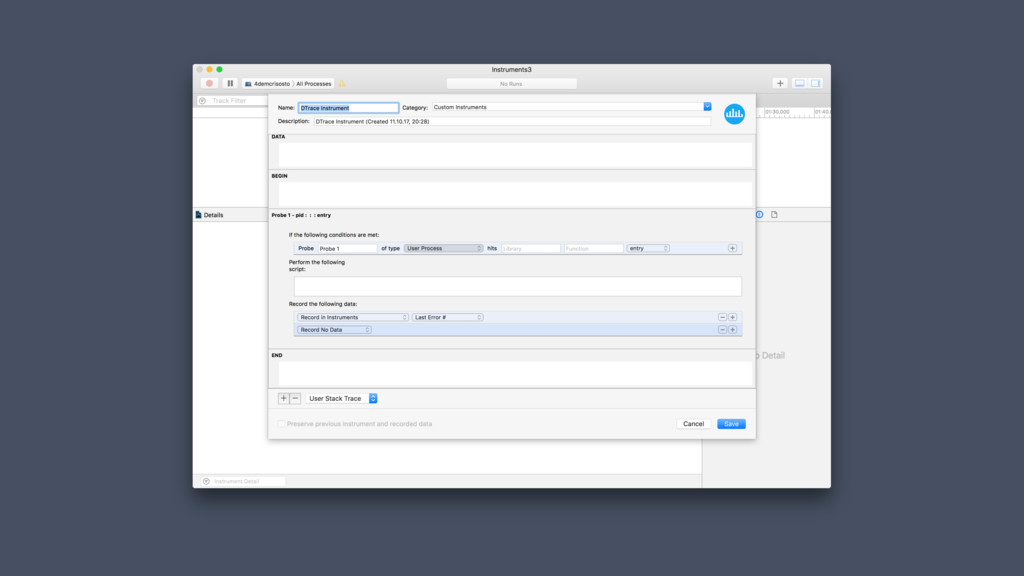
INSTRUMENTS.APP
None
None
DTRACE
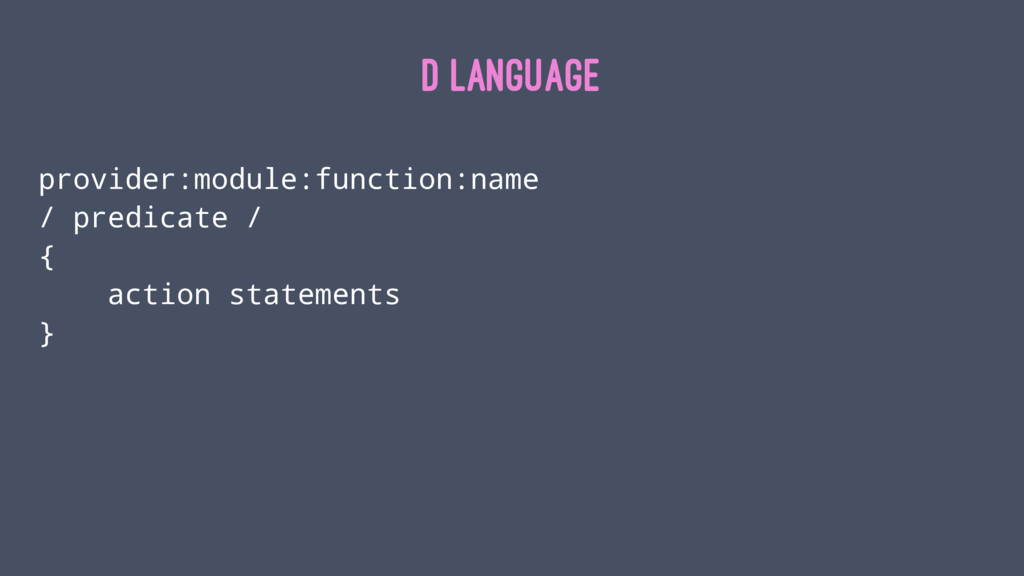
D LANGUAGE provider:module:function:name / predicate / { action statements }
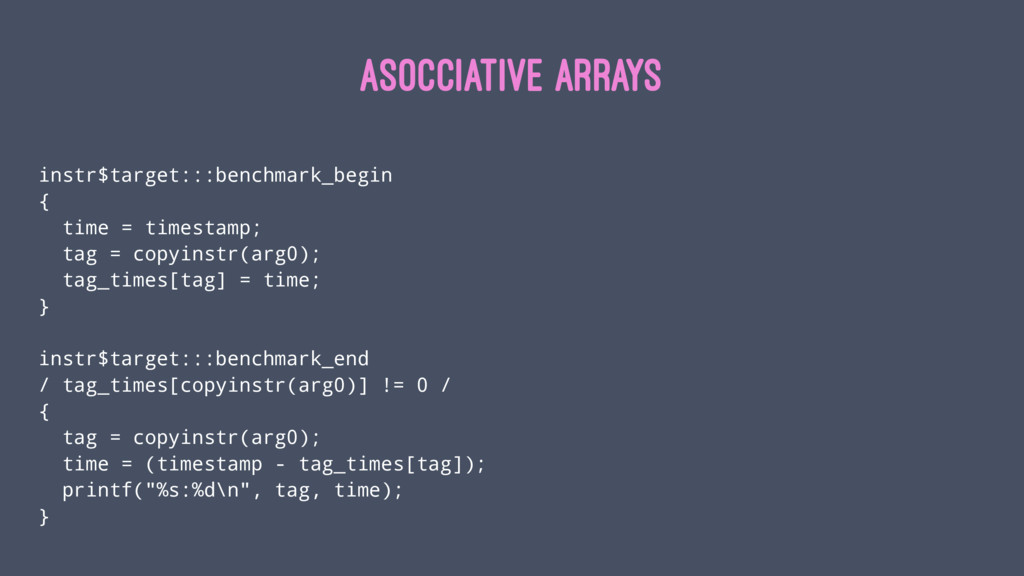
ASOCCIATIVE ARRAYS instr$target:::benchmark_begin { time = timestamp; tag = copyinstr(arg0);
tag_times[tag] = time; } instr$target:::benchmark_end / tag_times[copyinstr(arg0)] != 0 / { tag = copyinstr(arg0); time = (timestamp - tag_times[tag]); printf("%s:%d\n", tag, time); }
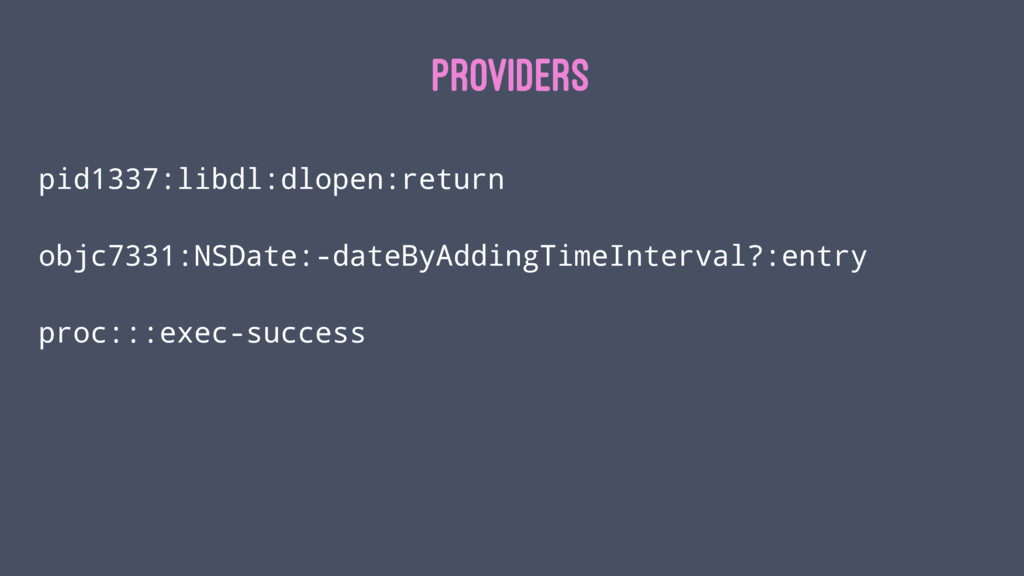
PROVIDERS pid1337:libdl:dlopen:return objc7331:NSDate:-dateByAddingTimeInterval?:entry proc:::exec-success
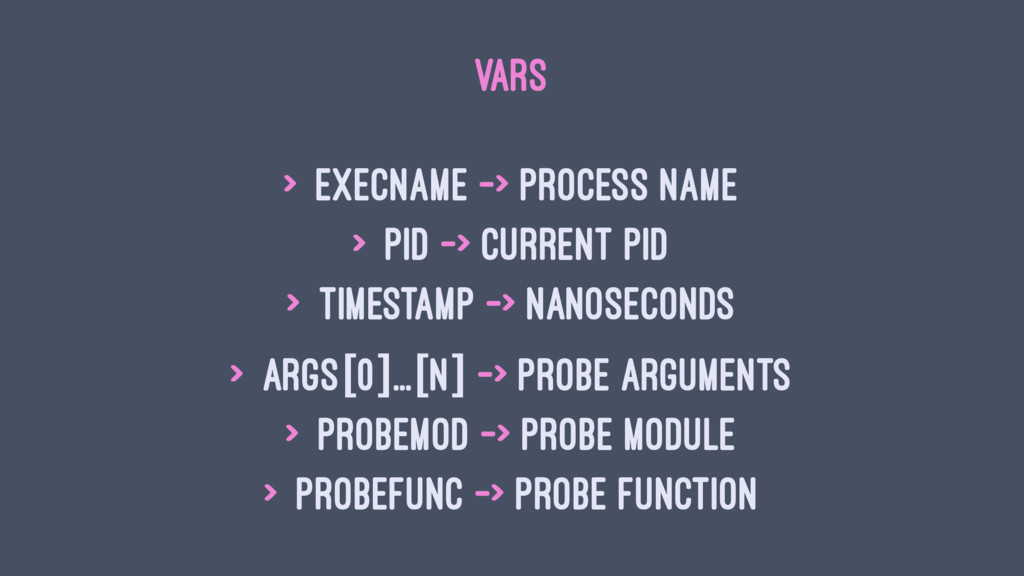
VARS > execname -> process name > pid -> current
pid > timestamp -> nanoseconds > args[0]...[N] -> probe arguments > probemod -> probe module > probefunc -> probe function
None
None
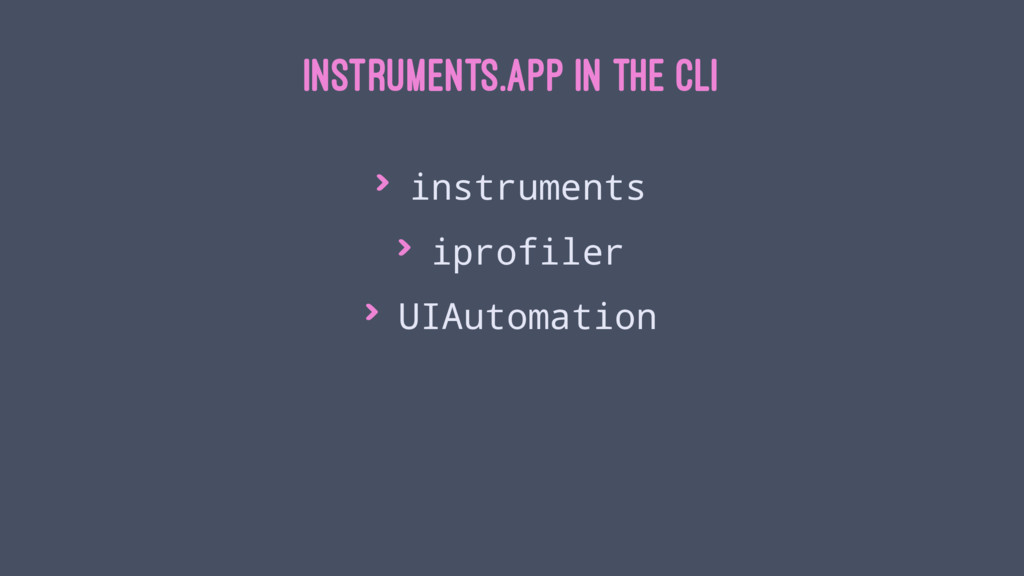
INSTRUMENTS.APP IN THE CLI > instruments > iprofiler > UIAutomation
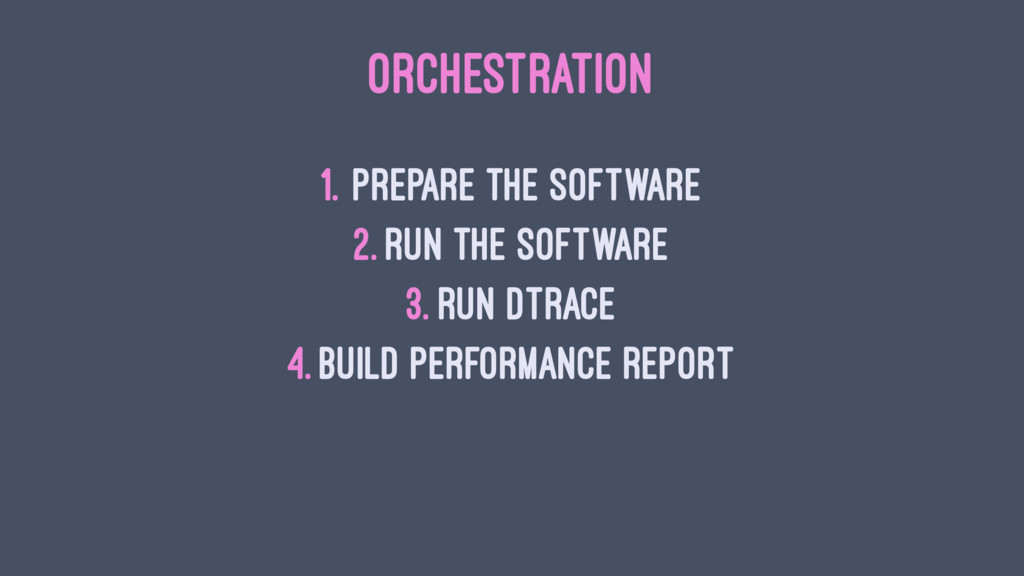
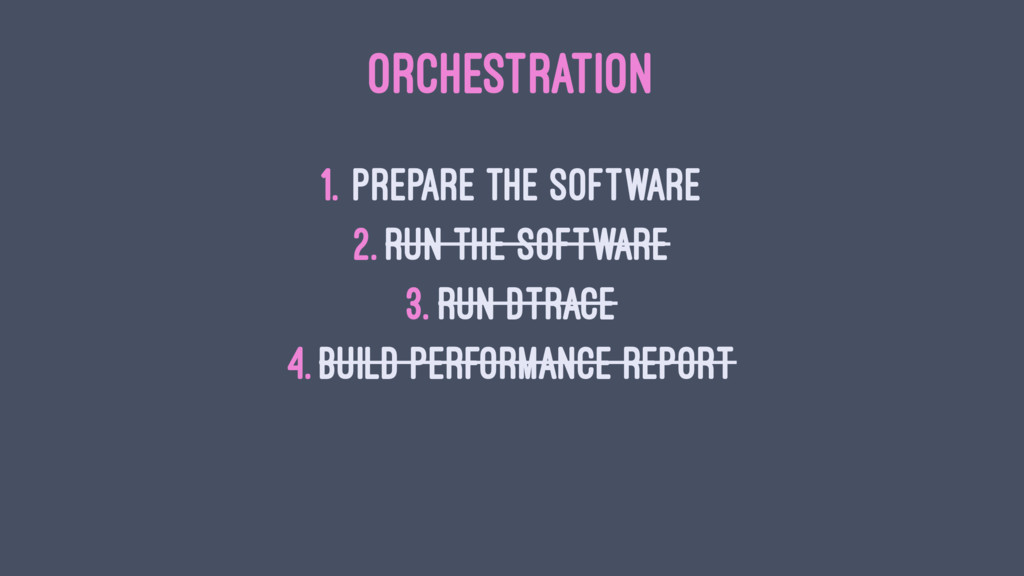
ORCHESTRATION 1. Prepare the software 2. Run the software 3.
Run DTrace 4. Build performance report
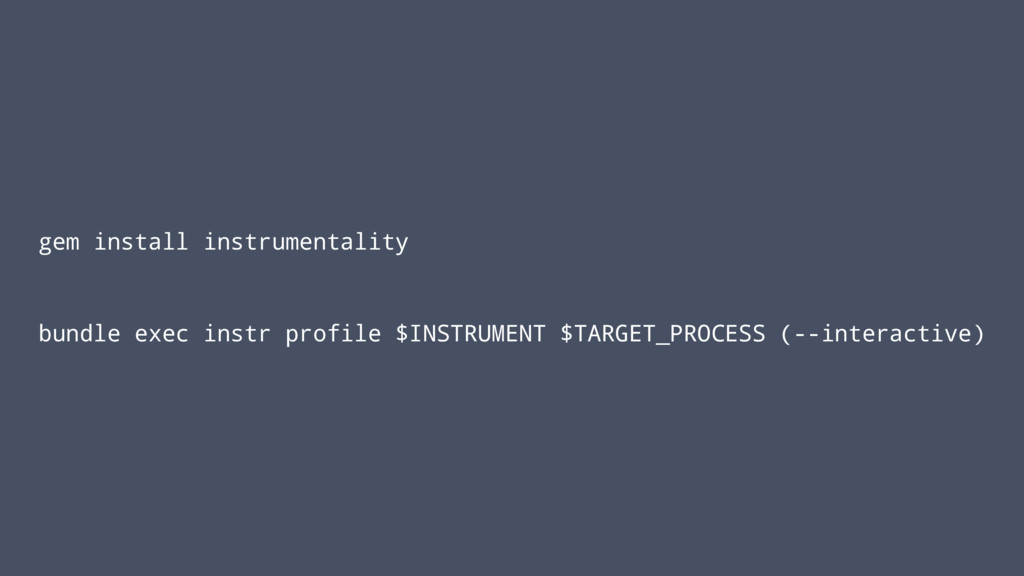
instr
ORCHESTRATION 1. Prepare the software 2. Run the software 3.
Run DTrace 4. Build performance report
gem install instrumentality bundle exec instr profile $INSTRUMENT $TARGET_PROCESS (--interactive)
DEMO
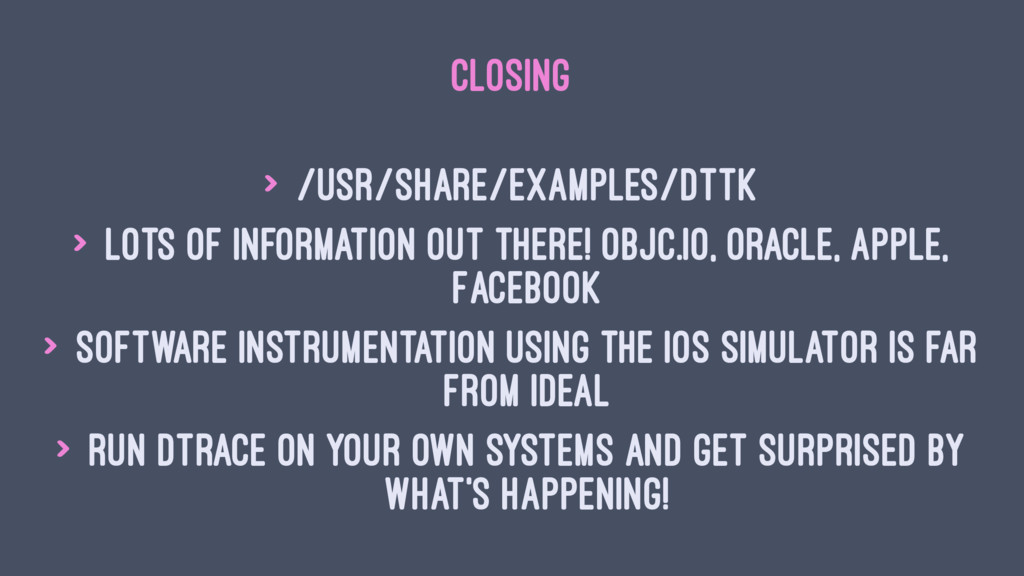
CLOSING > /usr/share/examples/DTTk > Lots of information out there! objc.io,
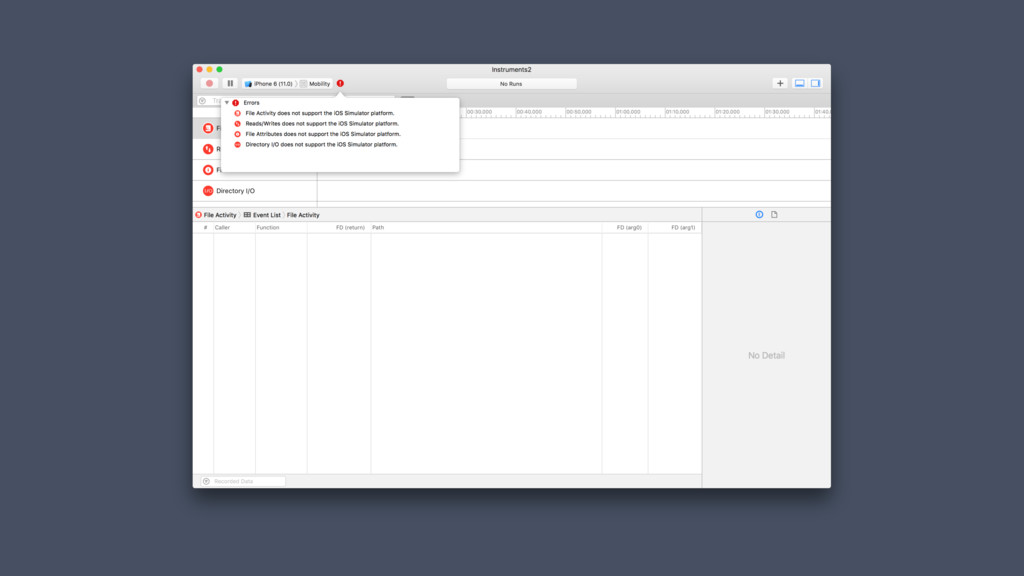
Oracle, Apple, Facebook > Software instrumentation using the iOS Simulator is far from ideal > Run DTrace on your own systems and get surprised by what's happening!
LINKS > objc.io: DTrace > instr > Jenkins demo: GitHub