Upgrade to Pro — share decks privately, control downloads, hide ads and more …

R Today

Saghir
February 01, 2017

R Today

Overview of R and R Tidyverse in Feb 2017

Saghir

February 01, 2017
Tweet

More Decks by Saghir

Other Decks in Programming

Transcript

  1. R Today R Core Team has built a great product

    Base R is very reliable and well tested It has a strong foundation and is easily extendable It develops fast! Where is R Today? 4
  2. Tidyverse “The packages in the tidyverse share a common philosophy

    of data and R programming, and are designed to work together naturally.” 1 1http://tidyverse.org 7
  3. Importing Data Packages • Text files & CSVs • readr

    • Excel Spreadsheets • readxl • SAS, Stata, SPSS • haven • Web (e.g. HTML, XML, json) • rvest, xml2, httr and jsonlite • Databases • DBI, RMySQL, RSQLite, RPostgreSQL 9
  4. Importing Data – CSV with Base R read.csv(text="subjid , country

    , gender, age, score 1001 , BE , Male , 63, 15.3 1002 , NL , Female , 63, 18.9 1003 , FR , Female , 46, 9.1") ## subjid country gender age score ## 1 1001 BE Male 63 15.3 ## 2 1002 NL Female 63 18.9 ## 3 1003 FR Female 46 9.1 10
  5. Importing Data – CSV with Base R str(read.csv(text="subjid , country

    , gender, age, score 1001 , BE , Male , 63, 15.3 1002 , NL , Female , 63, 18.9 1003 , FR , Female , 46, 9.1")) ## data.frame : 3 obs. of 5 variables: ## $ subjid : Factor w/ 3 levels " 1001 "," 1002 ",..: 1 2 ## $ country: Factor w/ 3 levels " BE "," FR ",..: 1 3 2 ## $ gender : Factor w/ 2 levels " Female "," Male ": 2 ## $ age : int 63 63 46 ## $ score : num 15.3 18.9 9.1 11
  6. Importing Data – CSV with readr read_csv("subjid , country ,

    gender, age, score 1001 , BE , Male , 63, 15.3 1002 , NL , Female , 63, 18.9 1003 , FR , Female , 46, 9.1") ## # A tibble: 3 × 5 ## subjid country gender age score ## <chr> <chr> <chr> <int> <dbl> ## 1 1001 BE Male 63 15.3 ## 2 1002 NL Female 63 18.9 ## 3 1003 FR Female 46 9.1 12
  7. Importing Data – Web with xml2 # Cast of Lion

    (2017) read_html("http://www.imdb.com/title/tt3741834") %>% html_nodes("#titleCast .itemprop span") %>% html_text() ## [1] "Sunny Pawar" "Abhishek Bharate" ## [3] "Priyanka Bose" "Khushi Solanki" ## [5] "Shankar Nisode" "Tannishtha Chatterjee" ## [7] "Nawazuddin Siddiqui" "Riddhi Sen" ## [9] "Koushik Sen" "Rita Boy" ## [11] "Udayshankar Pal" "Surojit Das" ## [13] "Deepti Naval" "Menik Gooneratne" ## [15] "David Wenham" 13
  8. Tidy Data Data can be presented in different ways “Tidy

    datasets are all alike; every messy dataset is messy in its own way” Hadley Wickham (paraphrasing Leo Tolstoy) 14
  9. Tidy Data Packages • “Modern” dataframe (made easy) • tibble

    • Easily go from long to wide datasets and vice versa • tidyr 15
  10. Data Transformations Packages • Manipulate, process, merge, ... data •

    dplyr – “A grammar of data manipulation” • String manipulation • stringr • Handling dates & time • lubridate & hms • Factor variables • forcats 16
  11. Chick Weight Data Four variables: weight (g), time (days), chick

    ID and diet (four) Twelve weight measurements per chick over 21 days ## # A tibble: 578 × 4 ## weight Time Chick Diet ## * <dbl> <dbl> <ord> <fctr> ## 1 42 0 1 1 ## 2 51 2 1 1 ## 3 59 4 1 1 ## 4 64 6 1 1 ## # ... with 574 more rows 17
  12. Pipe – %>% Pipes are a powerful tool to do

    multiple steps in “one” go ChickWeight %>% as_tibble() %>% filter(Diet==2 & Time %in% c(0, 21)) %>% group_by(Time) %>% summarise(N=n(), mean=mean(weight)) ## # A tibble: 2 × 3 ## Time N mean ## <dbl> <int> <dbl> ## 1 0 10 40.7 ## 2 21 10 214.7 18
  13. Data Visualisation Packages • Implementation of “Grammar of Graphics” •

    ggplot2 • Interactive graphics • plotly • Scalable Vector Graphics • svglite 19
  14. Chick Weight (i) ggplot(ChickWeight, aes(Time, weight, colour = Diet)) +

    geom_point() 100 200 300 0 5 10 15 20 Time weight Diet 1 2 3 4 20
  15. Chick Weight (ii) ggplot(ChickWeight, aes(Time, weight, colour = Diet)) +

    stat_summary(fun.y="mean", geom="line") 100 200 0 5 10 15 20 Time weight Diet 1 2 3 4 21
  16. Base Graphics vs ggplot2 Assume that we have the following

    datasets mydat1 <- tibble( day = c(1:12), resp = c(2, 4, NA, 8, 10, 12, NA, 16, 18, 20, NA, NA) ) mydat2 <- tibble( day = c(1:12), resp = 0.5 + 3.2*day + rnorm(12) ) 22
  17. Base Graphics – “Painter Model” (i) Plot the first dataset

    plot(mydat1$day, mydat1$resp) 2 4 6 8 10 12 5 10 15 20 mydat1$day mydat1$resp 23
  18. Base Graphics – “Painter Model” (ii) Add a line for

    the second dataset plot(mydat1$day, mydat1$resp) lines(mydat2$day, mydat2$resp, pch=19, col="blue") 2 4 6 8 10 12 5 10 15 20 mydat1$day mydat1$resp 24
  19. ggplot2 – “Grammar of Graphics” (i) Plot the first dataset

    mygph <- ggplot(mydat1, aes(day, resp)) + geom_point() mygph 5 10 15 20 2.5 5.0 7.5 10.0 12.5 resp 25
  20. ggplot2 – “Grammar of Graphics” (ii) Add a line for

    the second dataset mygph + geom_line(data=mydat2, colour="blue") 10 20 30 40 2.5 5.0 7.5 10.0 12.5 day resp 26
  21. Base Graphics vs ggplot2 Base graphics plotted the second dataset

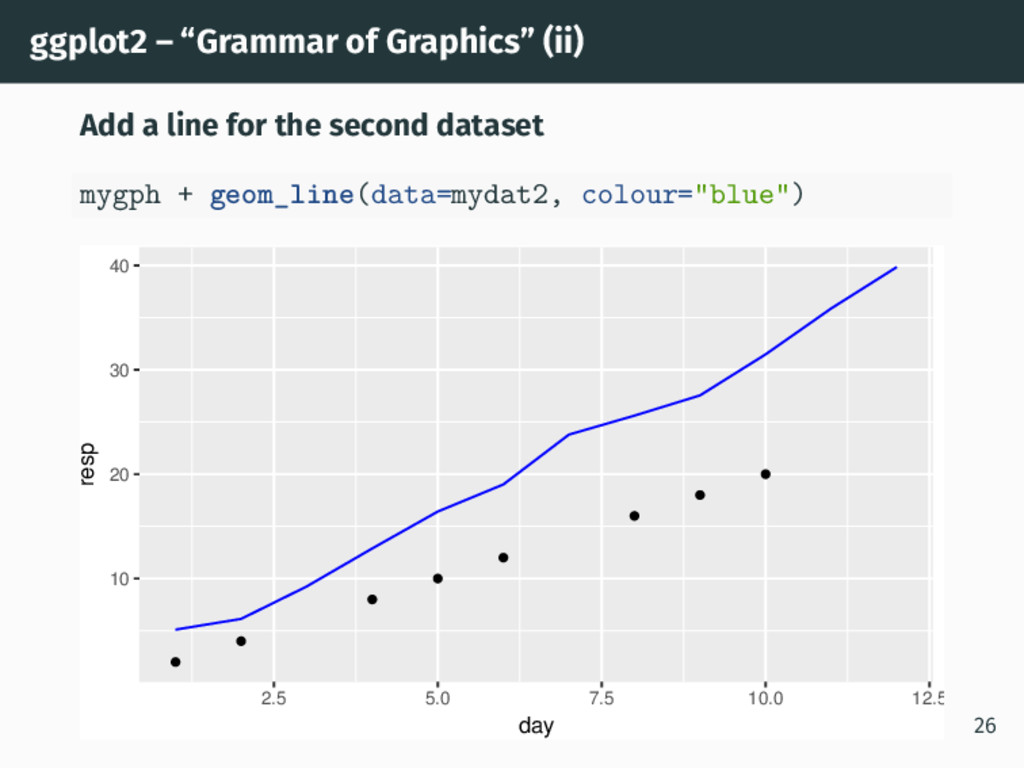
    without warning that there were values outside the plot. ggplot2 adapted the plot for the second dataset. • It also gave a warning (not shown) about the 4 missing values. The Base graphics issue could be programmed out but ggplot2 takes it away. 27
  22. Modelling Packages • Convert statistical analysis objects from R into

    tidy data frames • broom • Modelling Functions that Work with the Pipe (%>%) • modelr 28
  23. Programming Packages • Less development time, readable code and easier

    maintenance • magrittr (origin of the pipe like operator %>% ) • Functional Programming Tools - consistent version of apply family of functions • purrr 29
  24. Literate Programming “Let us change our traditional attitude to the

    construction of programs. Instead of imagining that our main task is to instruct a computer what to do, let us concentrate rather on explaining to humans what we want the computer to do.” Donald E. Knuth, Literate Programming, 1984 30
  25. Documentation Packages • Dynamic Documents for R • rmarkdown, knitr,

    pander • Authoring Books and Technical Documents with R Markdown • bookdown • blogdown for blogs (under development) • Microsoft Word and PowerPoint Documents • ReporteRs 32
  26. R Markdown Rmarkdown is an authoring framework for your code,

    results and commentary. From data to final report in one document. • Great for reproducible research • Quality Control workload can be reduced • Can output to different formats 33
  27. R Markdown Outputs • Reports • HTML • PDF •

    Microsoft Word • Presentations • PDF (L A TEX beamer)2 • HTML 5 (ioslides, slidy) 2Like this presentation :) 34
  28. Web Apps Package • Web Application Framework • shiny, opencpu

    • Interactive Web Maps • leaflet & rmaps (under development) • JavaScript Data Visualization • htmlwidgets 36
  29. Miscellaneous Package • Extension of data.frame to reduce programming and

    compute time tremendously • data.table • Language agnostic fast, lightweight, and easy-to-use binary file format for storing data frames • feather 38
  30. R Community R has a strong community across the world

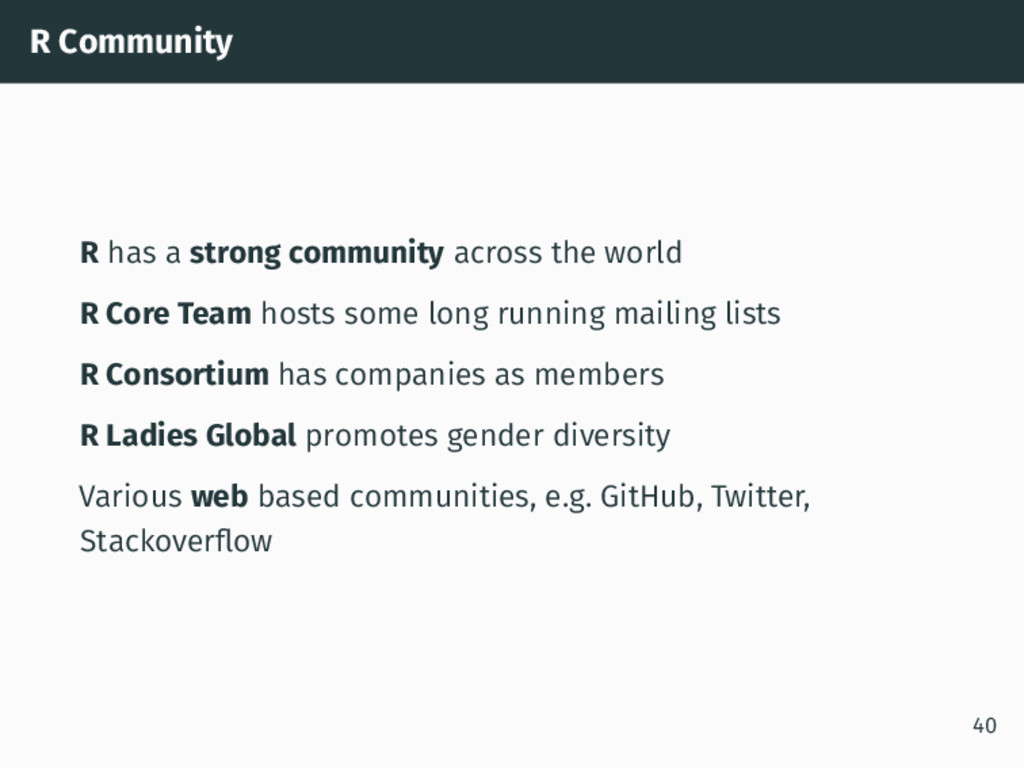
    R Core Team hosts some long running mailing lists R Consortium has companies as members R Ladies Global promotes gender diversity Various web based communities, e.g. GitHub, Twitter, Stackoverflow 40
  31. How can you keep up? It can be a full

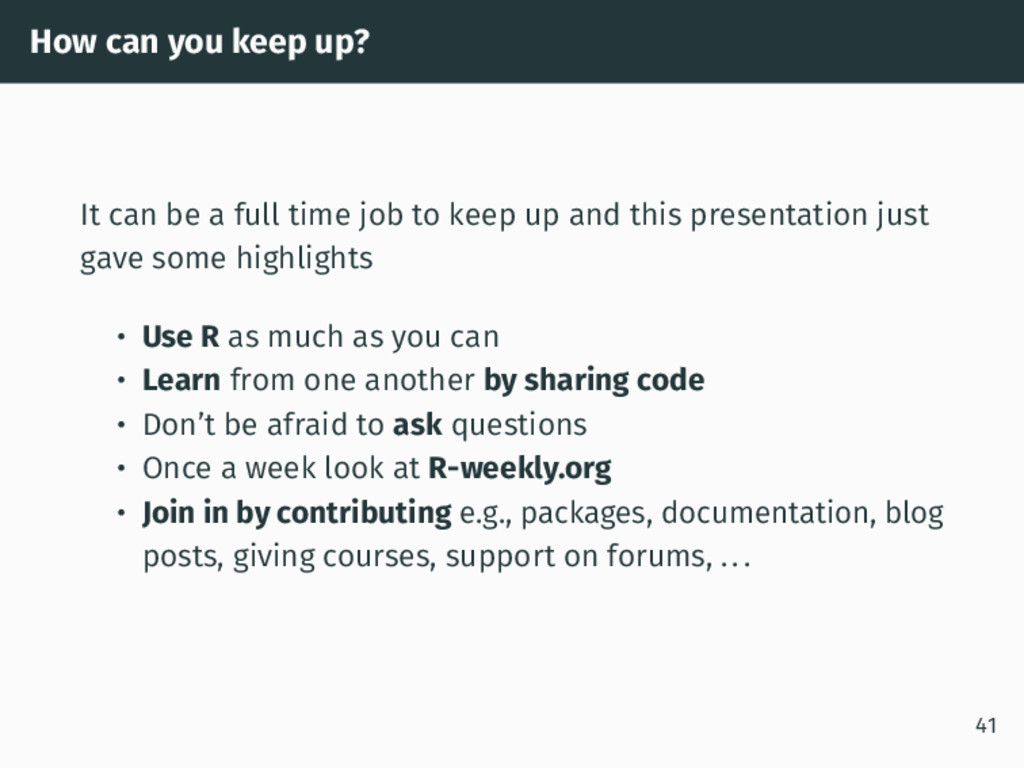
    time job to keep up and this presentation just gave some highlights • Use R as much as you can • Learn from one another by sharing code • Don’t be afraid to ask questions • Once a week look at R-weekly.org • Join in by contributing e.g., packages, documentation, blog posts, giving courses, support on forums, ... 41
  32. Summary R Core Team have developed a high quality and

    reliable product Base R is flexible and extendable by design Fast development – there are more than 10,000 packages R Community is diverse and strong Tidyverse approach lets you think about what you want to do and less about what R is doing 43
  33. This work is licensed under the Creative Commons Attribution-NonCommercial 4.0

    International License. To view a copy of this license, visit http://creativecommons.org/licenses/by-nc/4.0/ 43