Upgrade to Pro — share decks privately, control downloads, hide ads and more …

Data Science Thinking Workshop: Chick Weight Data

Saghir
December 05, 2017

Data Science Thinking Workshop: Chick Weight Data

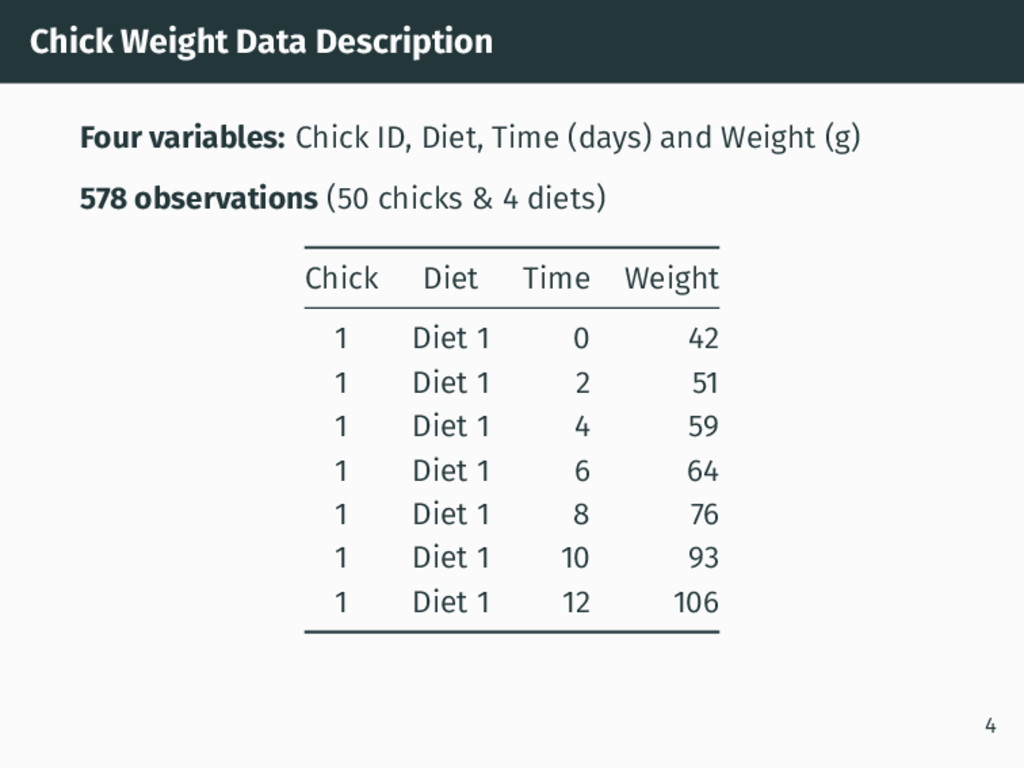
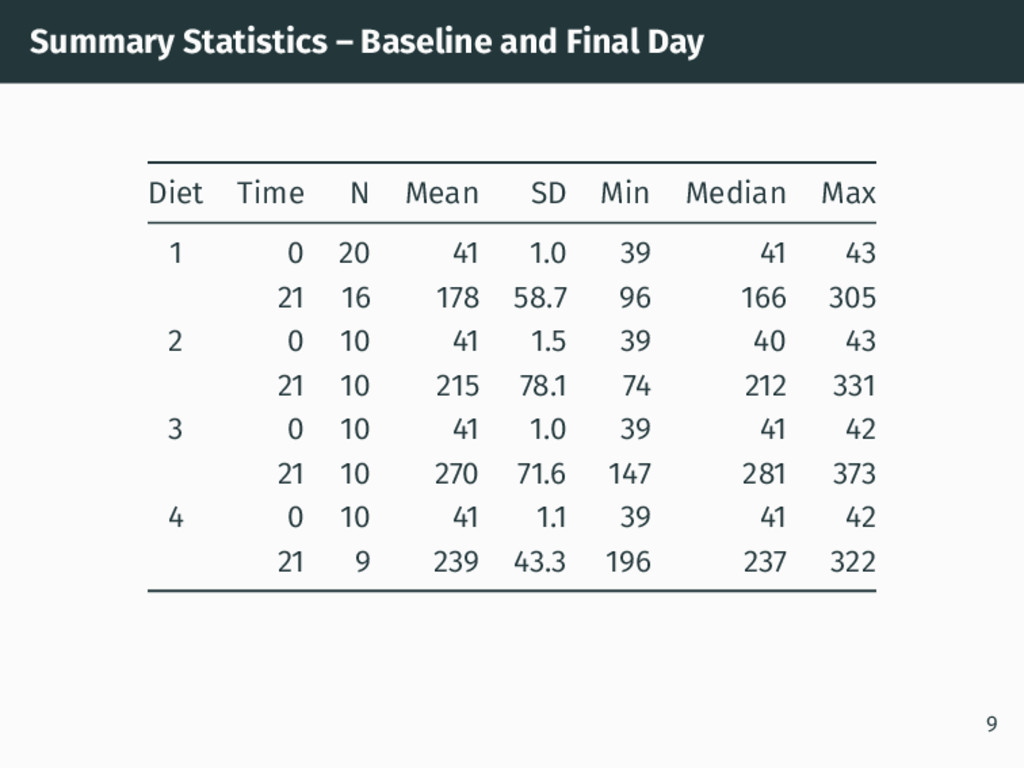
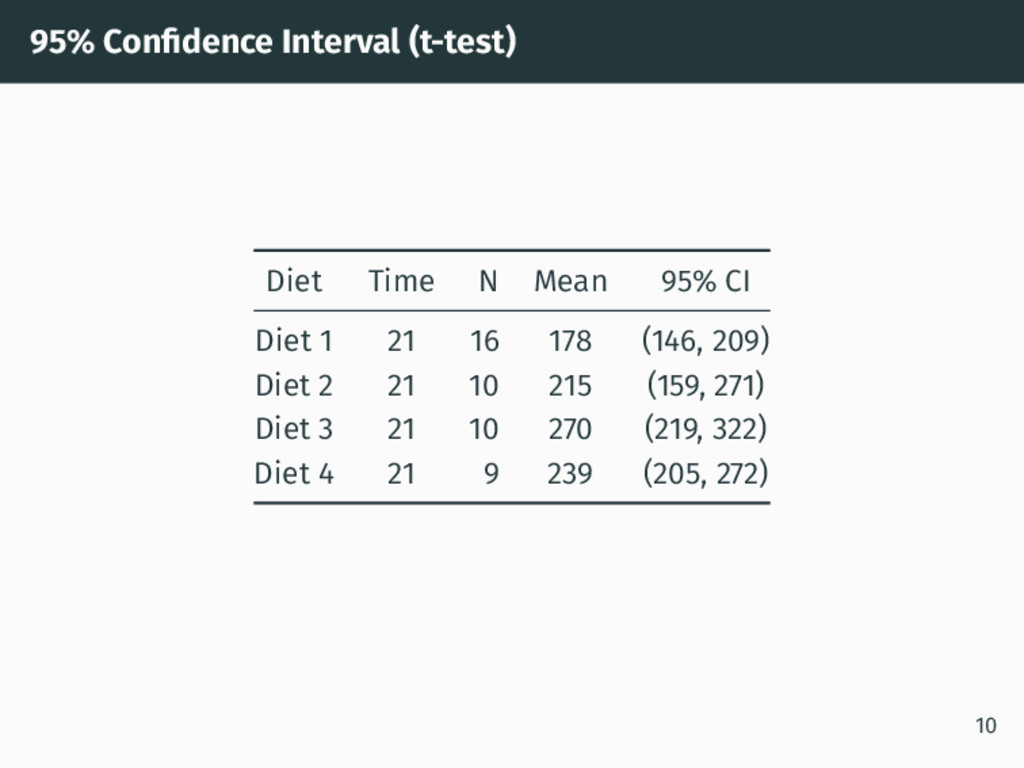
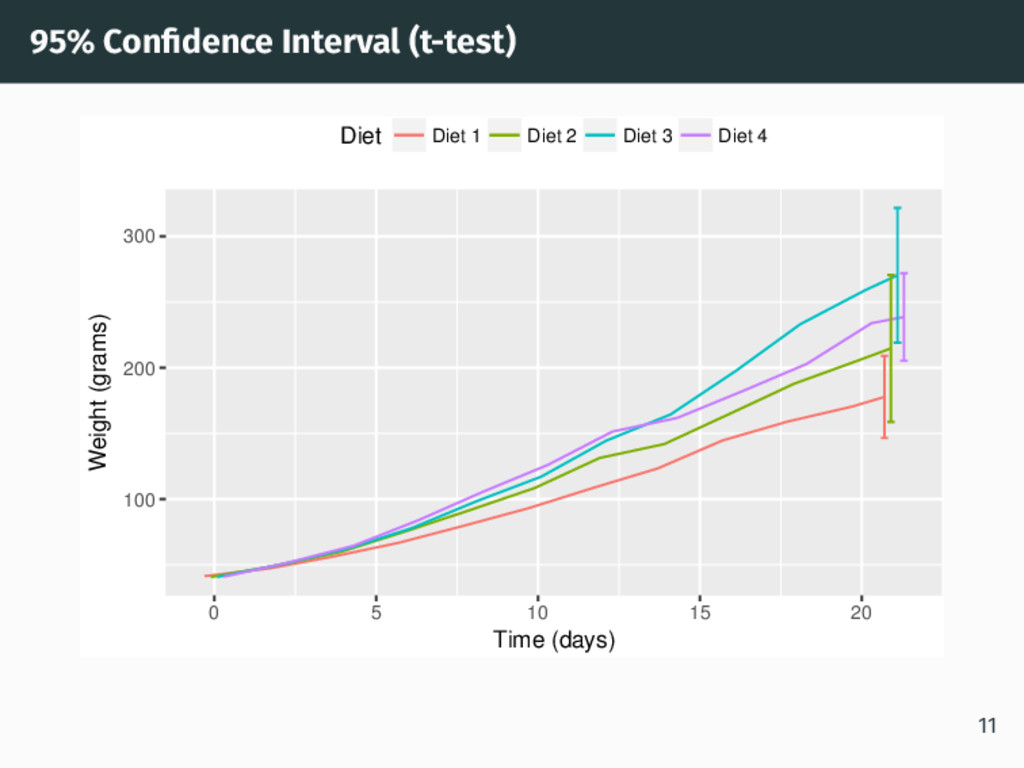
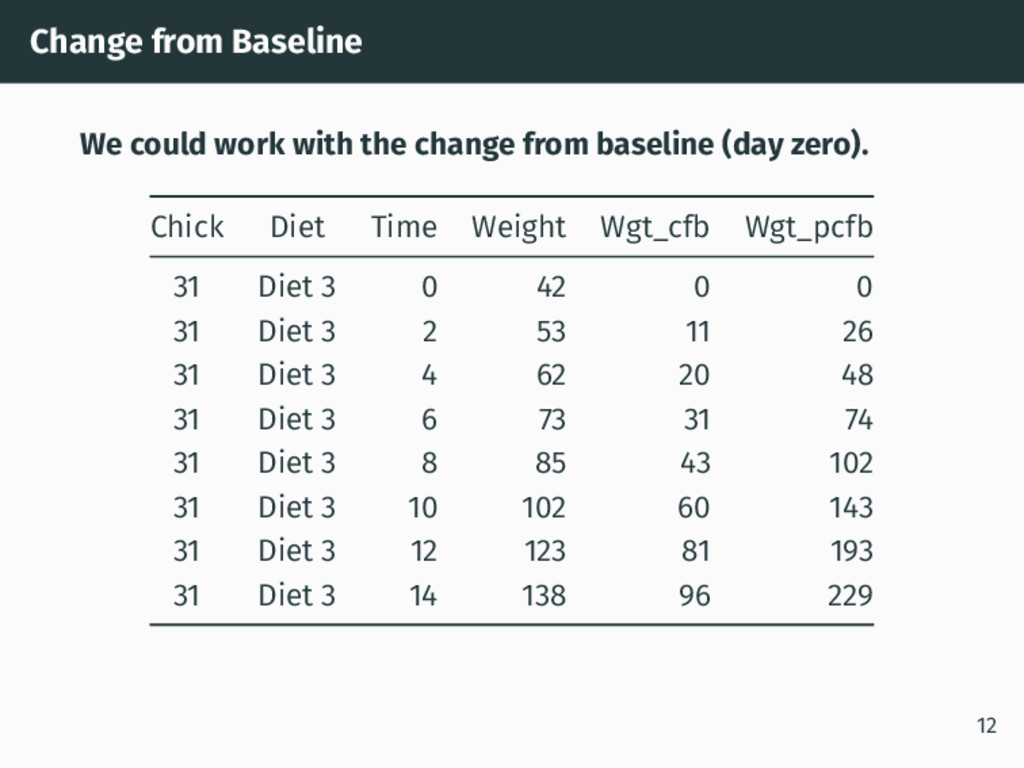
The R Chick Weight data (from datasets package) was used to develop "Trustworthy Data Science" thinking. Participants worked in groups to discuss the trustworthiness of the what was presented and how it could be improved.
Video: https://youtu.be/KSlsw_gVIhs

Meetup: https://www.meetup.com/Data-Science-Unplugged/events/245278023/

Saghir

December 05, 2017
Tweet

More Decks by Saghir

Other Decks in Science

Transcript

  1. DS Unplugged Workshop: Chick Weight Data Saghir Bashir & Andreia

    Carlos 5th December 2017 www.ilustat.com 1
  2. Chick Weight Data Description Four variables: Chick ID, Diet, Time

    (days) and Weight (g) 578 observations (50 chicks & 4 diets) Chick Diet Time Weight 1 Diet 1 0 42 1 Diet 1 2 51 1 Diet 1 4 59 1 Diet 1 6 64 1 Diet 1 8 76 1 Diet 1 10 93 1 Diet 1 12 106 4
  3. Question “The body weights of the chicks were measured at

    birth and every second day thereafter until day 20. They were also measured on day 21. There were four groups of chicks on di erent protein diets.” Which of the fours diets leads to the most body weight gain? 5
  4. Mean Lines & Points by Diet Over Time 100 200

    300 0 5 10 15 20 Time (days) Weight (grams) Diet Diet 1 Diet 2 Diet 3 Diet 4 6
  5. Mean Lines & Points Diet 3 Diet 4 Diet 1

    Diet 2 0 5 10 15 20 0 5 10 15 20 100 200 300 100 200 300 Time (days) Weight (grams) 7
  6. Box Whisker Plot by Diet Diet 3 Diet 4 Diet

    1 Diet 2 0 5 10 15 20 0 5 10 15 20 100 200 300 100 200 300 Time (days) Weight (grams) 8
  7. Summary Statistics – Baseline and Final Day Diet Time N

    Mean SD Min Median Max 1 0 20 41 1.0 39 41 43 21 16 178 58.7 96 166 305 2 0 10 41 1.5 39 40 43 21 10 215 78.1 74 212 331 3 0 10 41 1.0 39 41 42 21 10 270 71.6 147 281 373 4 0 10 41 1.1 39 41 42 21 9 239 43.3 196 237 322 9
  8. 95% Con dence Interval (t-test) Diet Time N Mean 95%

    CI Diet 1 21 16 178 (146, 209) Diet 2 21 10 215 (159, 271) Diet 3 21 10 270 (219, 322) Diet 4 21 9 239 (205, 272) 10
  9. 95% Con dence Interval (t-test) 100 200 300 0 5

    10 15 20 Time (days) Weight (grams) Diet Diet 1 Diet 2 Diet 3 Diet 4 11
  10. Change from Baseline We could work with the change from

    baseline (day zero). Chick Diet Time Weight Wgt_cfb Wgt_pcfb 31 Diet 3 0 42 0 0 31 Diet 3 2 53 11 26 31 Diet 3 4 62 20 48 31 Diet 3 6 73 31 74 31 Diet 3 8 85 43 102 31 Diet 3 10 102 60 143 31 Diet 3 12 123 81 193 31 Diet 3 14 138 96 229 12
  11. Change from Baseline: Means by Diet 0 50 100 150

    200 0 5 10 15 20 Time (days) Weight Change from Baseline (grams) Diet Diet 1 Diet 2 Diet 3 Diet 4 13
  12. Change from Baseline: Mean Lines & Points Diet 3 Diet

    4 Diet 1 Diet 2 0 5 10 15 20 0 5 10 15 20 0 100 200 300 0 100 200 300 Time (days) Weight Change from Baseline (grams) Diet Diet 1 Diet 2 Diet 3 Diet 4 14
  13. % Change from Baseline: Means by Diet 0 200 400

    0 5 10 15 20 Time (days) % Weight Change from Baseline Diet Diet 1 Diet 2 Diet 3 Diet 4 15
  14. % Change from Baseline: Mean Lines & Points Diet 3

    Diet 4 Diet 1 Diet 2 0 5 10 15 20 0 5 10 15 20 0 200 400 600 800 0 200 400 600 800 Time (days) % Weight Change from Baseline Diet Diet 1 Diet 2 Diet 3 Diet 4 16
  15. Group Discussions The aim is to push the limits of

    your thinking • It is not about the right and wrong answers • Link it to your experience and work What needs to be known to make a “good” decision? • What do you and don’t you trust? • Think pragmatically! You can collaborate with the other groups • The idea is to have fun, learn and share 18
  16. Question Context: Objective is to sell the chicks based on

    their weight. Question: Which of the four diets leads to the most body weight gain? • Is the question objective, unbiased and answerable? • Can you think of a better question or questions? 19
  17. Data Discuss whether the data is appropriate and valid to

    answer the question? What is the quality of the data and how was it processed? Hints: • What bias reduction measures were taken (e.g. when assigning chicks to diets)? • How and when were measurements made (e.g calendar time and feeding times)? • What quality control measures were in place (e.g. when weighting chicks)? 20
  18. Analysis Discuss the summary statistics, graphs and 95% con dence

    intervals presented Hints: • Are the results generalisable? • What factors should you consider when tting a statistical model? • What assumptions would you make? • Would you model the raw data, change from baseline or the % change from baseline? • What can you say about bias and uncertainty? 21
  19. Communication What would you communicate? Hints: • What are your

    main messages? • Which Diet would you recommend and why? • What are the strengths and weaknesses of the study? • Think of biases and the uncertainty • Be open and transparent • Can a “good” decision be made using this study? 22
  20. Data - Chick Related Were the chicks allocated randomly (i.e.

    randomisation) Where the chicks treated equally? • Fed at the same time with identical quantities of food • Weighted at the same time at each weighing • Same “living” conditions? Were the temperature and humidity levels similar? What was the species of chick? Were they the same? • What was the gender distribution? • Were there siblings? How were they handled? 24
  21. Data - Experiment Related Were the experimenters trained in the

    same way? Were the diets blinded? To whom? • Was there a control diet? When was the experiment conducted? • Start and end dates? Diet groups run in parallel? Were the weighing machine(s) calibrated and identical? • How were weights recorded? Were other variables collected (e.g. chick sex)? 25
  22. Analysis - Presented in Slides Raw values, change from baseline

    or % change from baseline • All should lead to similar conclusions given that the baseline values are around 40g for all chicks • Raw values are best as chicks will be sold by weight Assumptions: • The data is a randomly selected sample that represents the general population of chicks • Independence between chicks (clearly not true for siblings) 26
  23. Analysis - By Chick Plot Diet 3 Diet 4 Diet

    1 Diet 2 0 5 10 15 20 0 5 10 15 20 100 200 300 100 200 300 Time (days) Weight (grams) 27
  24. Analysis - Thoughts for Modelling Weight over time is correlated

    for each chick • Variable “Chick” must be part of “model structure” • There could be correlation between chicks that are siblings Modelling variables: • Weight is the response variable • Diet and Time are explanatory variables • Chick is a “grouping” variable How will chicks that dropped out (or died) be handled? 28
  25. Communication Source data is not well characterised raising questions about

    the quality and the possibility of bias • Unknowns: diet allocation (randomised?), blinding, experiment design and conduct (e.g. feeding & weighing) • Quality control measure not speci ed hence uncertainty increases Other issues: • Sample size seems to be small which increases uncertainty • It is not clear if a control group was included The results should be interpreted very cautiously! 29
  26. Summary Chick Weight Data is not reliable due to the

    unknowns There are too many sources of bias and uncertainty The results should be interpreted very cautiously! • Too many risks! Apply similar methods to your work • Ask yourself the challenging questions before others do • Be open and transparent 31
  27. This work is licensed under the Creative Commons Attribution-NonCommercial 4.0

    International License. To view a copy of this license, visit http://creativecommons.org/licenses/by-nc/4.0/ 43