Upgrade to Pro — share decks privately, control downloads, hide ads and more …

Improve User Experience with Real User Measurements

Samar Panda
January 20, 2019

Improve User Experience with Real User Measurements

Browser metrics those can help to measure before and after loading experience of a site. If we can't measure we can't improve.

Samar Panda

January 20, 2019
Tweet

Other Decks in Technology

Transcript

  1. Are you measuring it right? Are you measuring right it?

    and if you claim that you can measure it... If you can't measure it, you can't improve it. credits : llya grigorik
  2. Real User Monitoring is a type of performance monitoring that

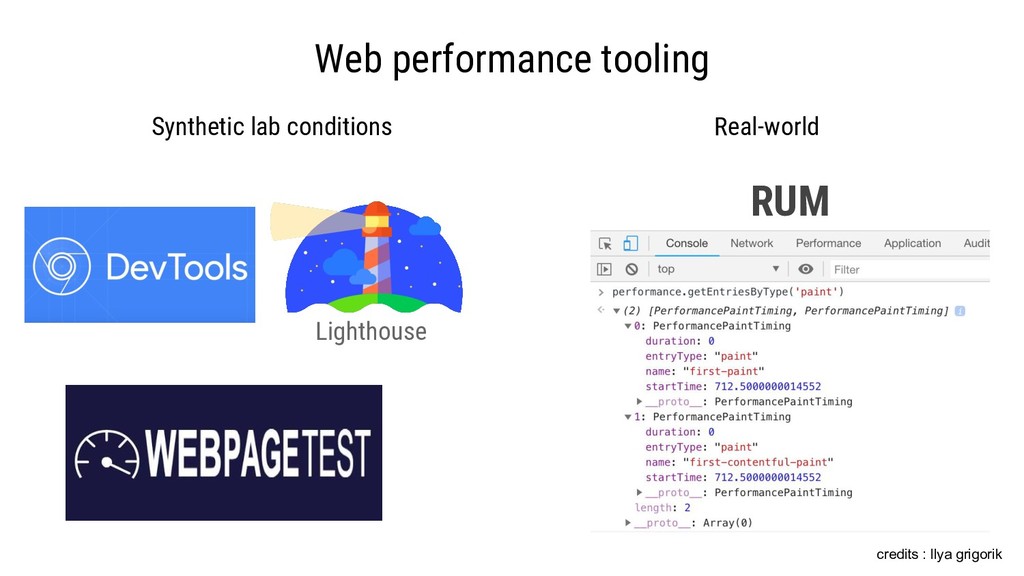
    captures and analyzes each transaction by users of a website or application. It’s also known as real user measurement, real user metrics, end-user experience monitoring or RUM.
  3. Number of transferred bytes Average page load time Time to

    interactive Average First Contentful paint #1 #2 #3 #4 50th: 5.8s 75th: 7.8s 90th: 10.6s 50th: 1285.5kb 75th: 2650.1kb 90th: 5075.8kb 50th: 8.7s 75th: 15.6s 90th: 25.8s 50th: 16s 75th: 25.4s 90th: 40.9s * data from HTTP Archive crawl for Dec/18 credits: llya grigorik
  4. Number of transferred bytes Median page load time Time to

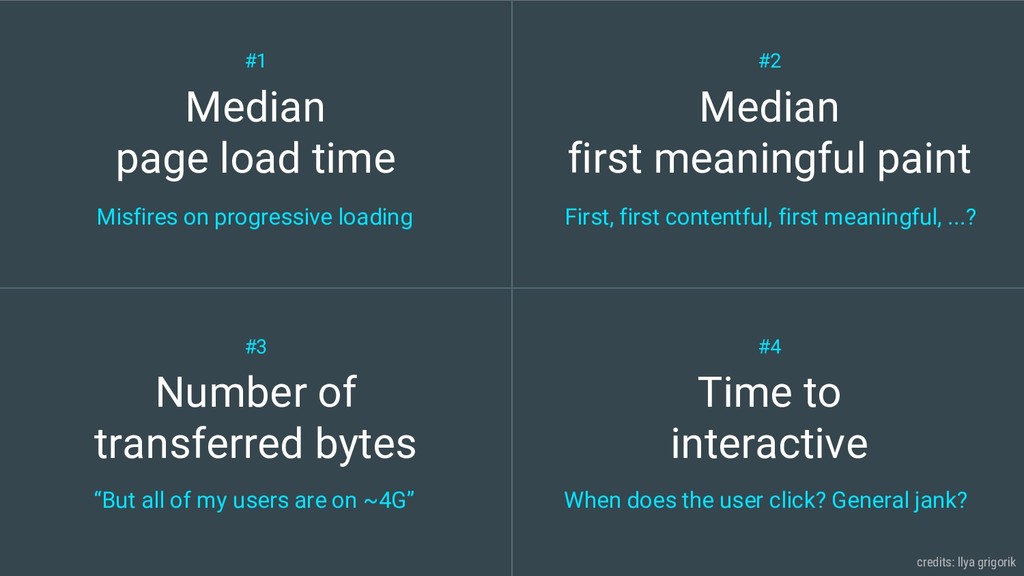
    interactive Median first meaningful paint #1 #2 #3 #4 Misfires on progressive loading First, first contentful, first meaningful, ...? “But all of my users are on ~4G” When does the user click? General jank? credits: llya grigorik
  5. User Timing - Custom Metrics • Marks - record individual

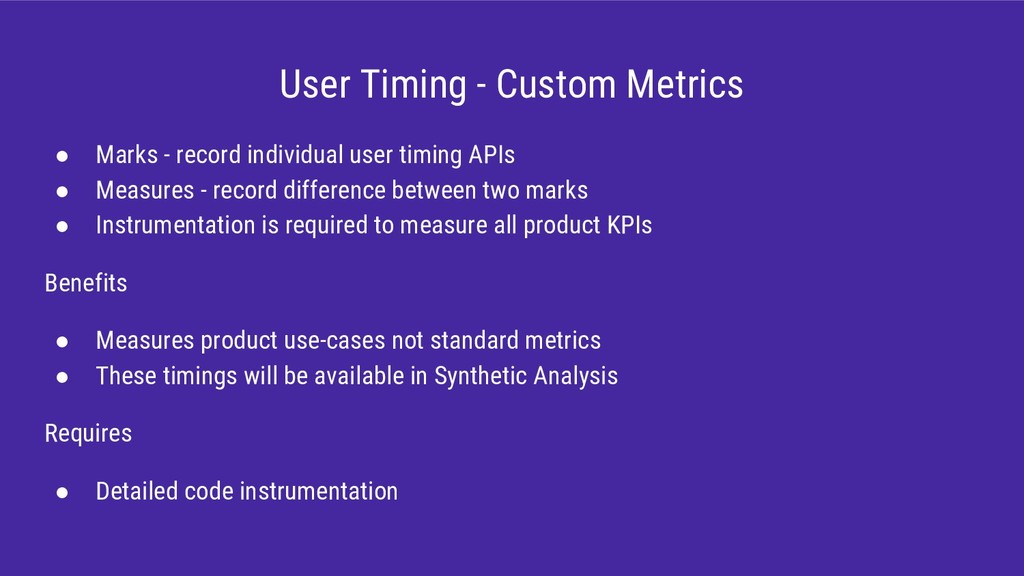
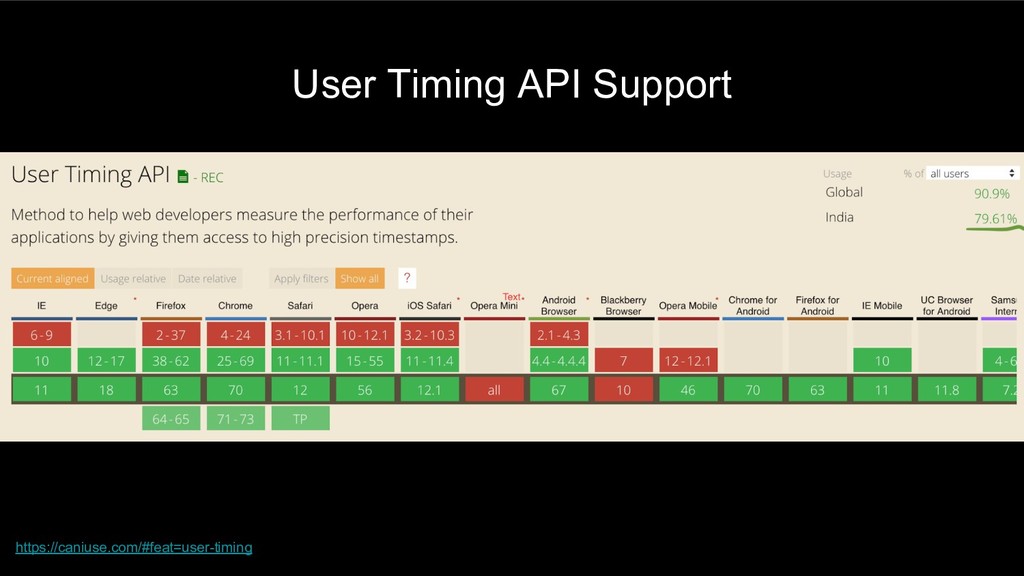
    user timing APIs • Measures - record difference between two marks • Instrumentation is required to measure all product KPIs Benefits • Measures product use-cases not standard metrics • These timings will be available in Synthetic Analysis Requires • Detailed code instrumentation
  6. First Input Delay (FID) First Input Delay (FID) measures the

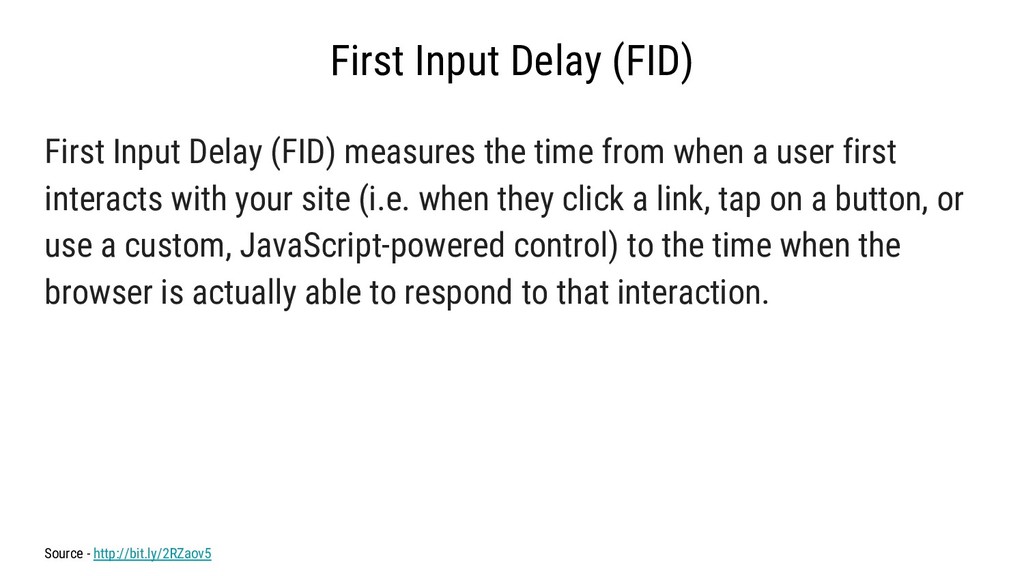
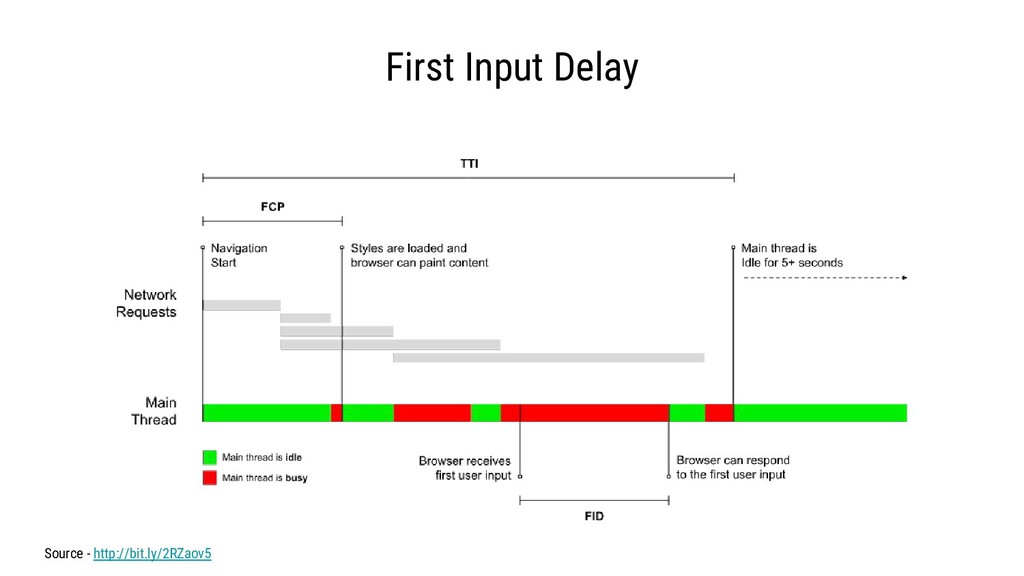
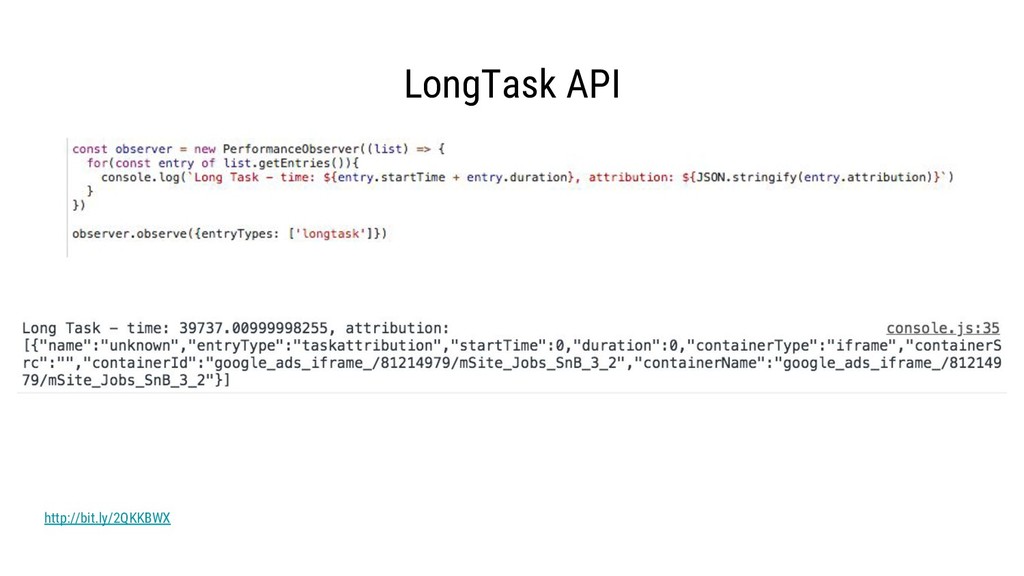
    time from when a user first interacts with your site (i.e. when they click a link, tap on a button, or use a custom, JavaScript-powered control) to the time when the browser is actually able to respond to that interaction. Source - http://bit.ly/2RZaov5
  7. const btn = document.querySelector(‘target-button’) btn.addEventListener(‘click’, (e) => { const lag

    = performance.now() - e.timeStamp; if(lag > 100) sendDataToAnalytics(`Input latency: ${lag}`) }) Calculating input delay for all clicks
  8. Is it happening? Is it useful? Is it usable? Is

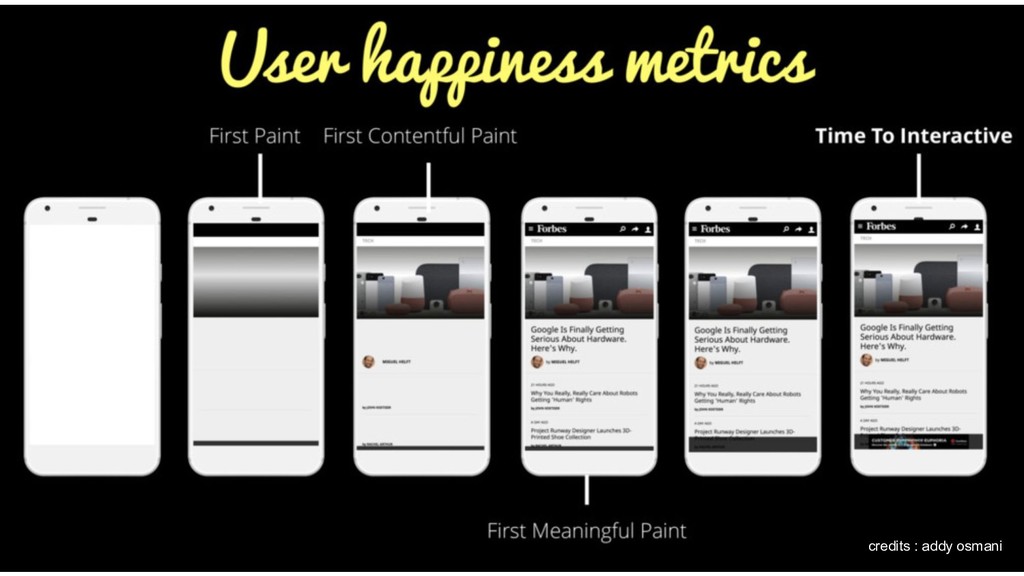
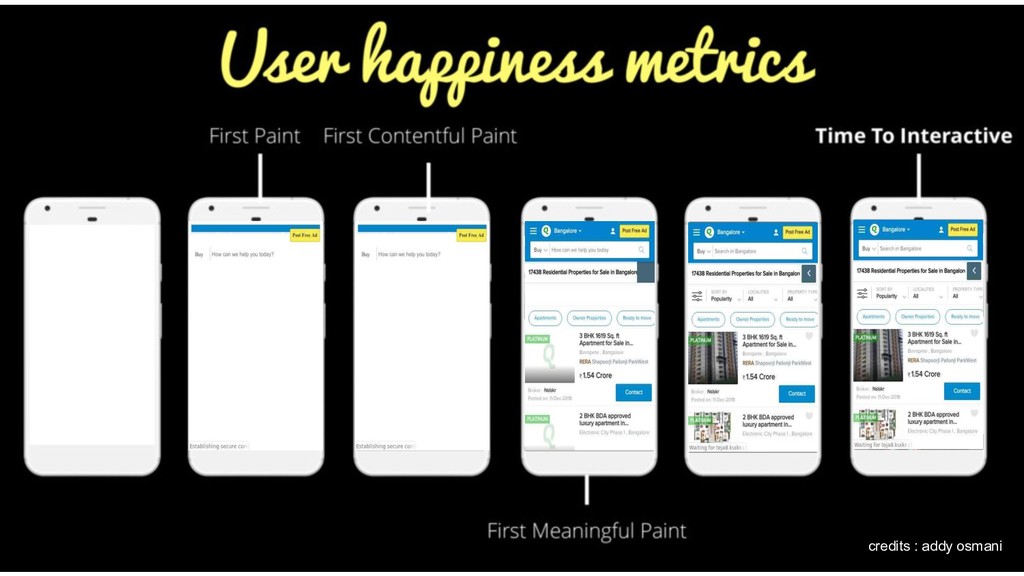
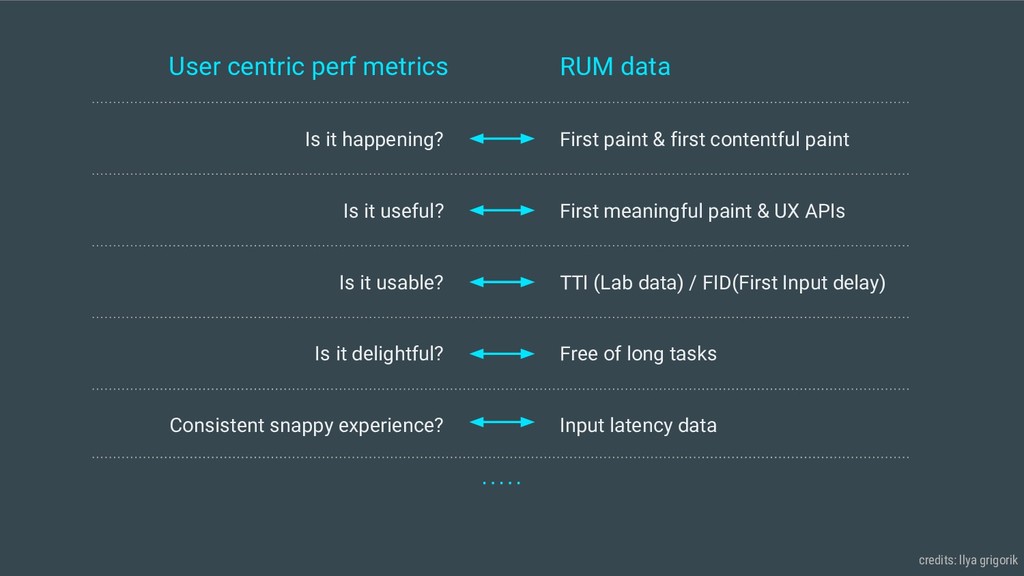
    it delightful? Consistent snappy experience? User centric perf metrics RUM data First paint & first contentful paint First meaningful paint & UX APIs TTI (Lab data) / FID(First Input delay) Free of long tasks Input latency data credits: llya grigorik
  9. • Navigation & Paint metrics will be available for all

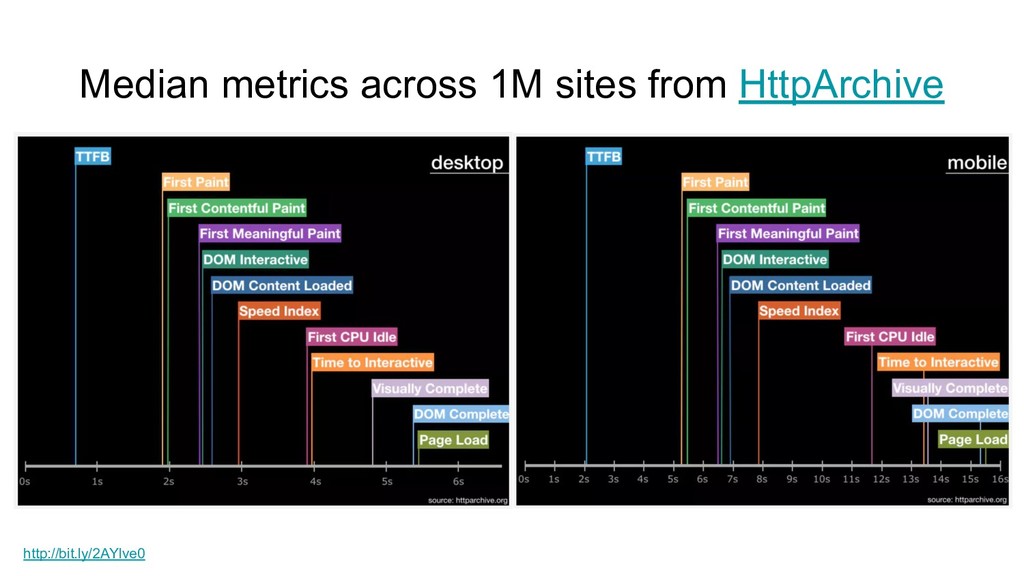
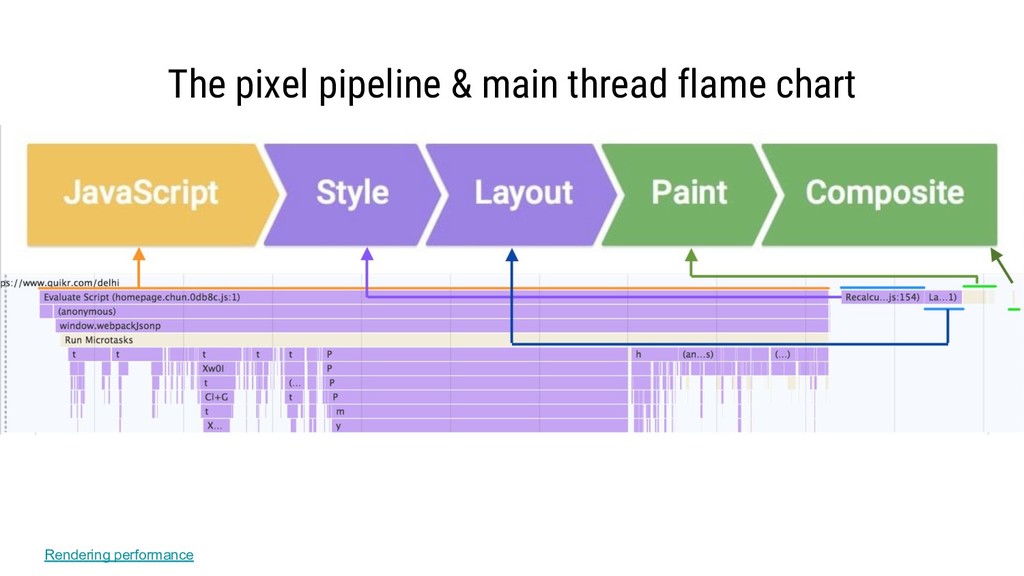
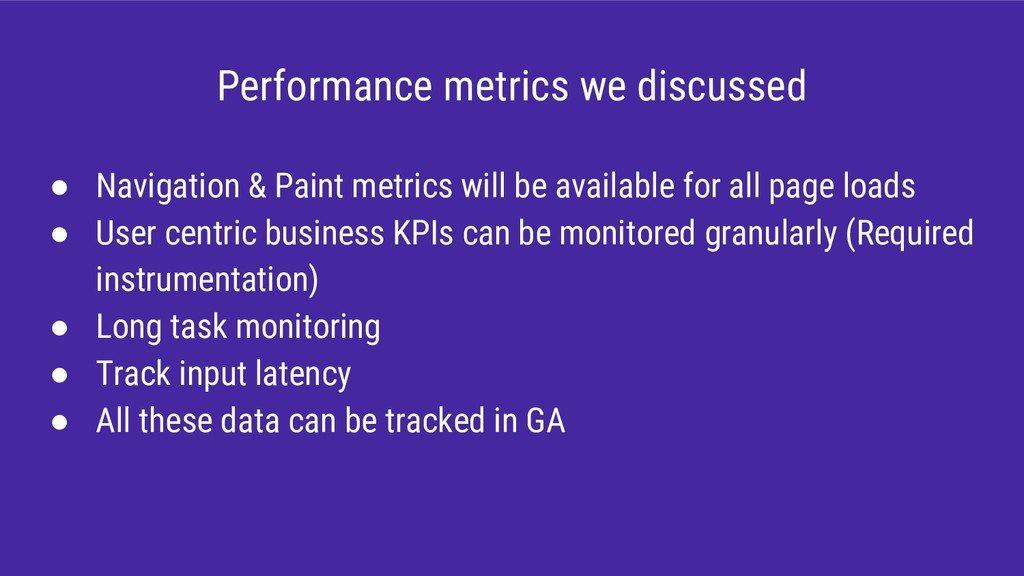
    page loads • User centric business KPIs can be monitored granularly (Required instrumentation) • Long task monitoring • Track input latency • All these data can be tracked in GA Performance metrics we discussed
  10. Product Specific UX Speed Measurements • “Time to first tweet”

    Improving performance on twitter.com • “Pinner wait time” Four lessons of making pinterest faster
  11. Performance budget • Decide perf budget for each page •

    Prioritize features in a page • http://www.performancebudget.io/ • https://bit.ly/perf-budgets
  12. • Logpoint for quicker js debugging • Code coverage •

    Code folding, Improved inspect element tooltip, Copy jspath • Paint timing markers • Pinning console expressions • Storing global variables http://bit.ly/2RMwbH4
  13. Tools • https://www.webpagetest.org/ • Google pagespeed insights • https://pagespeedreports.proteusthemes.com/ -

    Weekly pagespeed reports • https://browserdiet.com/calories/ - Browser Calories Chrome / Firefox extension • https://testmysite.thinkwithgoogle.com - Test your mobile site speed • https://www.thinkwithgoogle.com/feature/mobile/ - Compare with competitor • Chrome dev tools audit using Lighthouse • https://squoosh.app/ - Image optimization