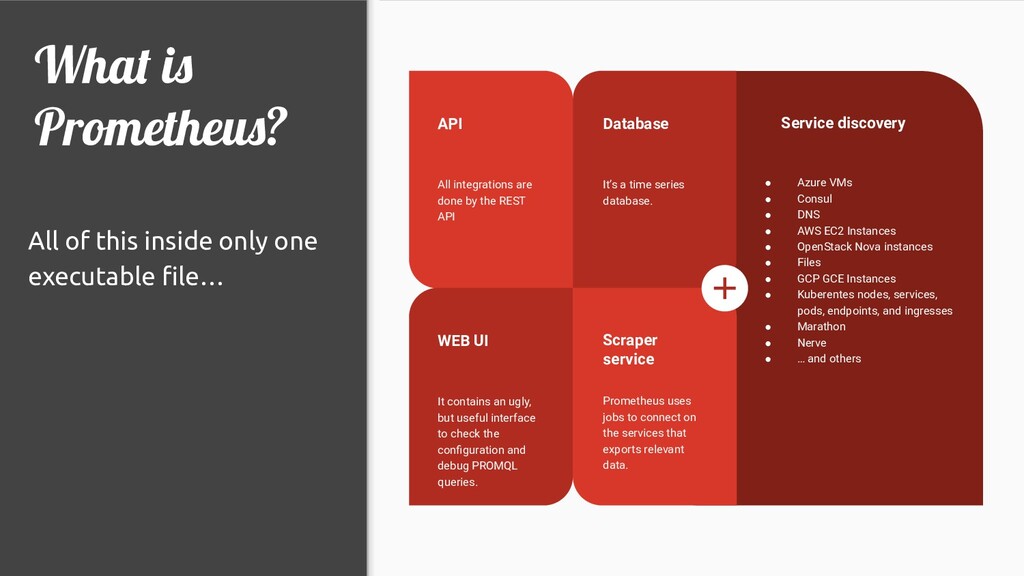
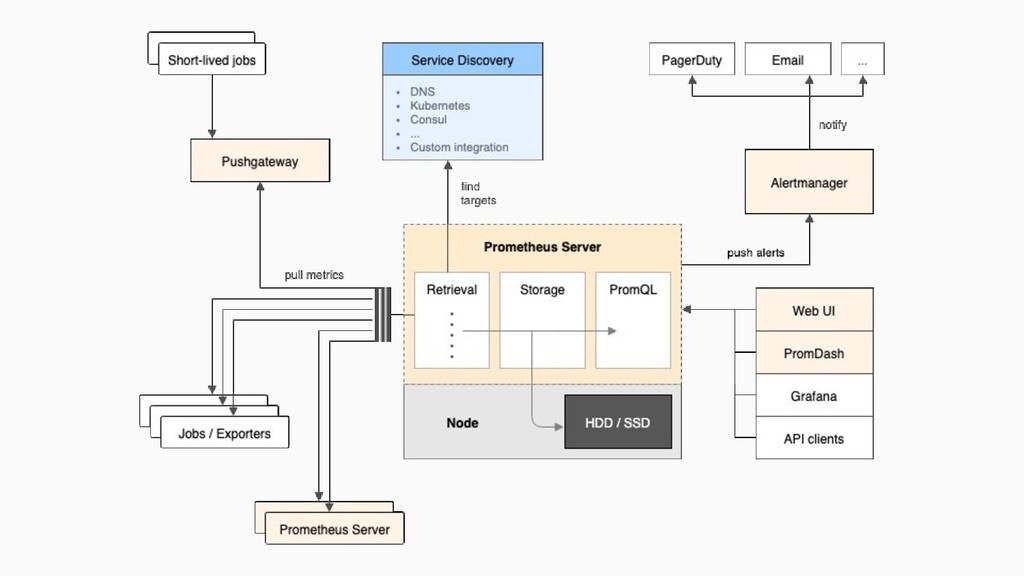
AWS EC2 Instances • OpenStack Nova instances • Files • GCP GCE Instances • Kuberentes nodes, services, pods, endpoints, and ingresses • Marathon • Nerve • … and others What is Prometheus? Database It’s a time series database. API All integrations are done by the REST API WEB UI It contains an ugly, but useful interface to check the configuration and debug PROMQL queries. Scraper service Prometheus uses jobs to connect on the services that exports relevant data. All of this inside only one executable file…
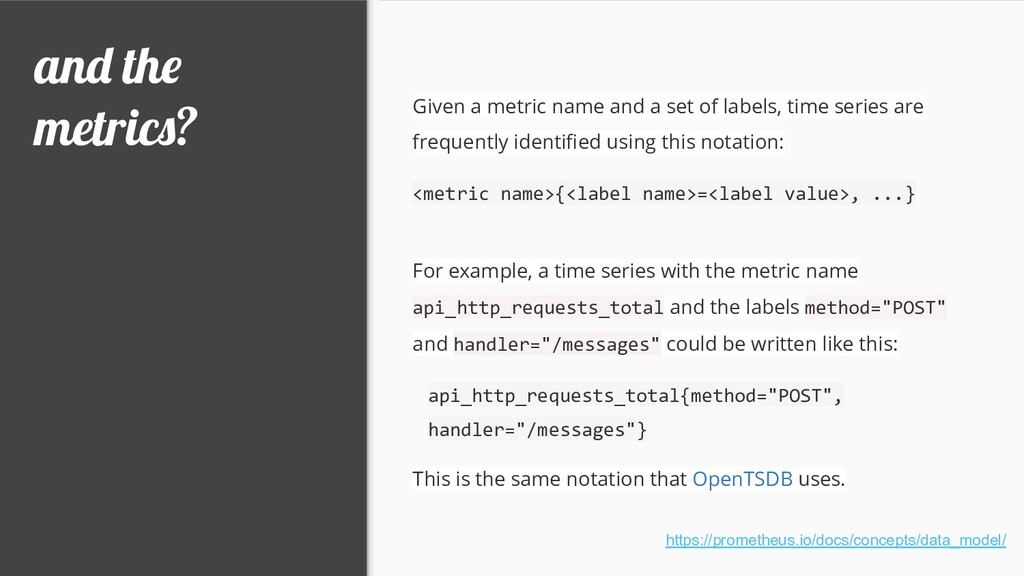
of labels, time series are frequently identified using this notation: <metric name>{<label name>=<label value>, ...} For example, a time series with the metric name api_http_requests_total and the labels method="POST" and handler="/messages" could be written like this: api_http_requests_total{method="POST", handler="/messages"} This is the same notation that OpenTSDB uses. https://prometheus.io/docs/concepts/data_model/