Upgrade to Pro
— share decks privately, control downloads, hide ads and more …
Speaker Deck
Features
Speaker Deck
PRO
Sign in
Sign up for free
Search
Search
Webstock 2014 Workshop
Search
Sha Hwang
February 12, 2014
Design
78
0
Share
Embed
Copy iframe code
Copy JS code
Copy link
Start on current slide
Webstock 2014 Workshop
A workshop on data visualization given at Webstock in Wellington
Sha Hwang
February 12, 2014
More Decks by Sha Hwang
See All by Sha Hwang
From Paper Architect to Product Designer
sha
1
110
A Guidebook to Mapping Techniques
sha
2
140
Life after Mercator
sha
1
93
Astronauts and Architects
sha
1
56
Other Decks in Design
See All in Design
I.A. como meio, não como fim. Como avaliar o valor entregue?
videlvequio
0
380
kintone開発におけるライターの役割の変化〜AI活用を添えて〜 / Changes in the Role of Writers in Kintone Development
keroyama
0
120
ClaudeCodeでマーケターの課題を解決する
kenichiota0711
11
14k
The Art of Caring
klemens
0
350
Accelerating performance improvement based on a software review evaluation matrix
kitanosirokuma
0
250
Frontier
rwang05
0
160
test deck title
shotamatsuo
0
1.5k
Build for the Web, Build on the Web, Build With the Web
csswizardry
0
450
怖くないアクセシビリティ -カウンターカルチャーとしてのアッカン東京-
securecat
1
200
TUNAG BOOK 2024
stmn
PRO
0
1.6k
情報を翻訳する-伝わる可視化3原則とオープンデータ活用-
hjmkth
1
280
「余白」と「欲望」を味方につける ——AI時代のデザインエンジニアリングと「越境」の作法 #KNOTS2026
koyaman
1
1.9k
Featured
See All Featured
Chrome DevTools: State of the Union 2024 - Debugging React & Beyond
addyosmani
10
1.2k
The untapped power of vector embeddings
frankvandijk
2
1.8k
Side Projects
sachag
455
43k
JAMstack: Web Apps at Ludicrous Speed - All Things Open 2022
reverentgeek
1
480
How to Grow Your eCommerce with AI & Automation
katarinadahlin
PRO
1
210
KATA
mclloyd
PRO
35
15k
How Fast Is Fast Enough? [PerfNow 2025]
tammyeverts
3
610
How to Ace a Technical Interview
jacobian
281
24k
Embracing the Ebb and Flow
colly
88
5.1k
Beyond borders and beyond the search box: How to win the global "messy middle" with AI-driven SEO
davidcarrasco
3
160
Writing Fast Ruby
sferik
630
63k
Optimizing for Happiness
mojombo
378
71k
Transcript
Becoming a Data Visualization Superhero Webstock 2014
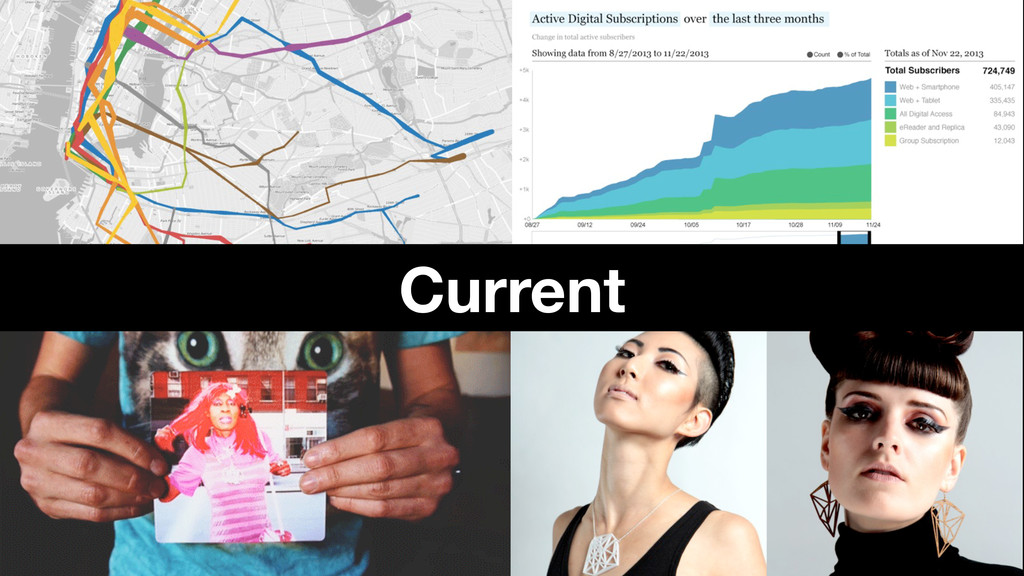
Hi, my name is Sha. postarchitectural.com or @shashashasha
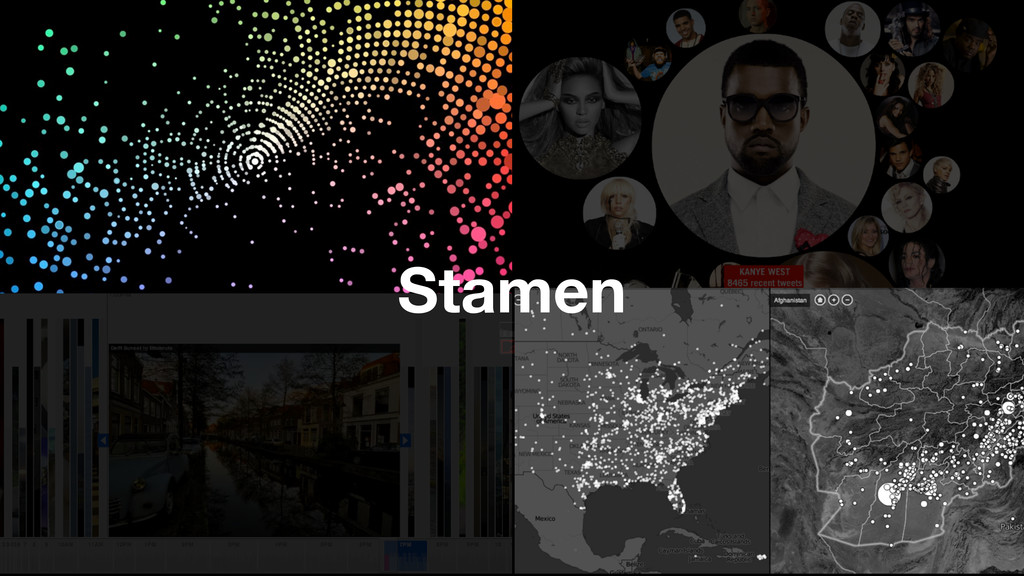
Stamen
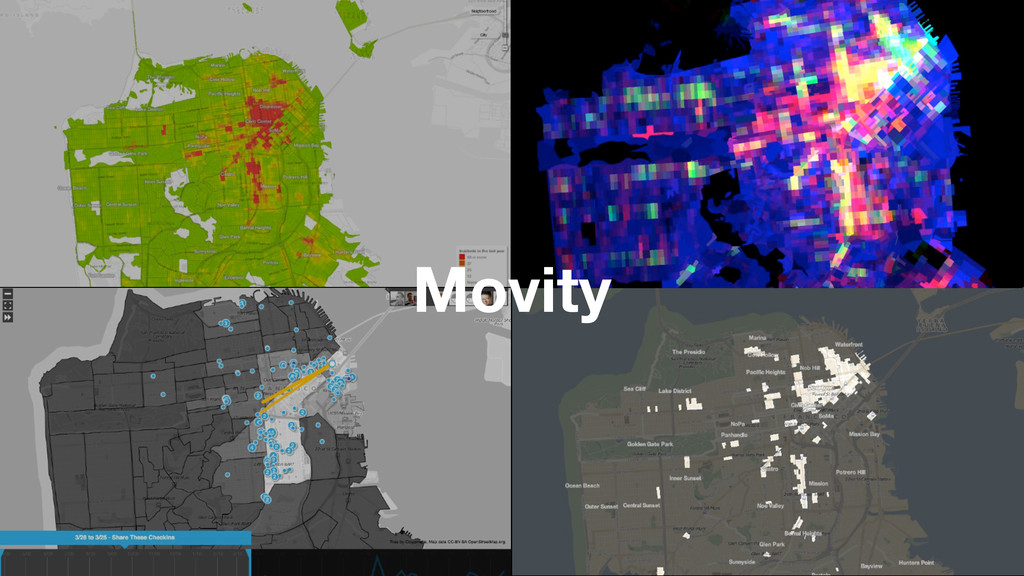
Movity
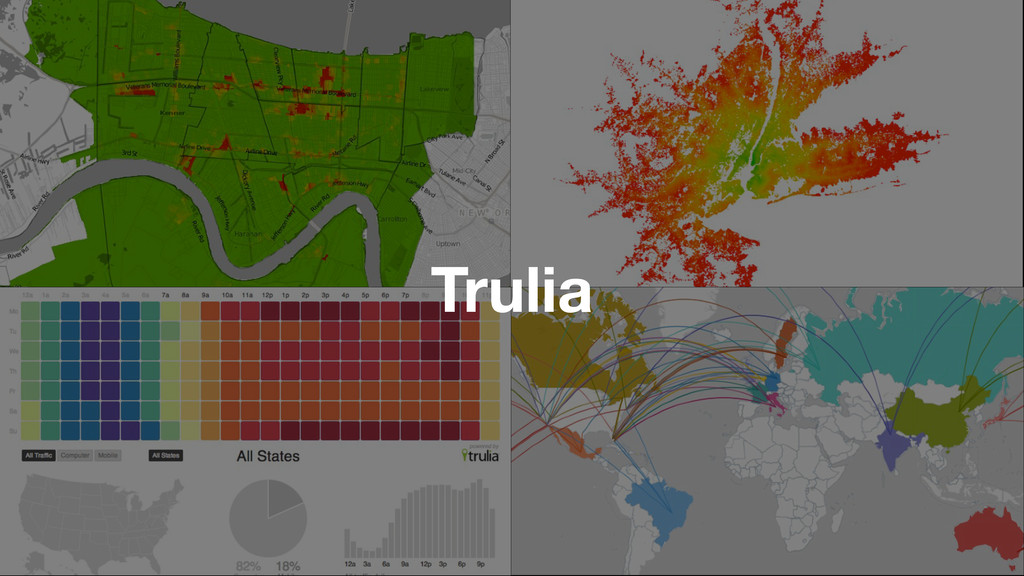
Trulia
Current
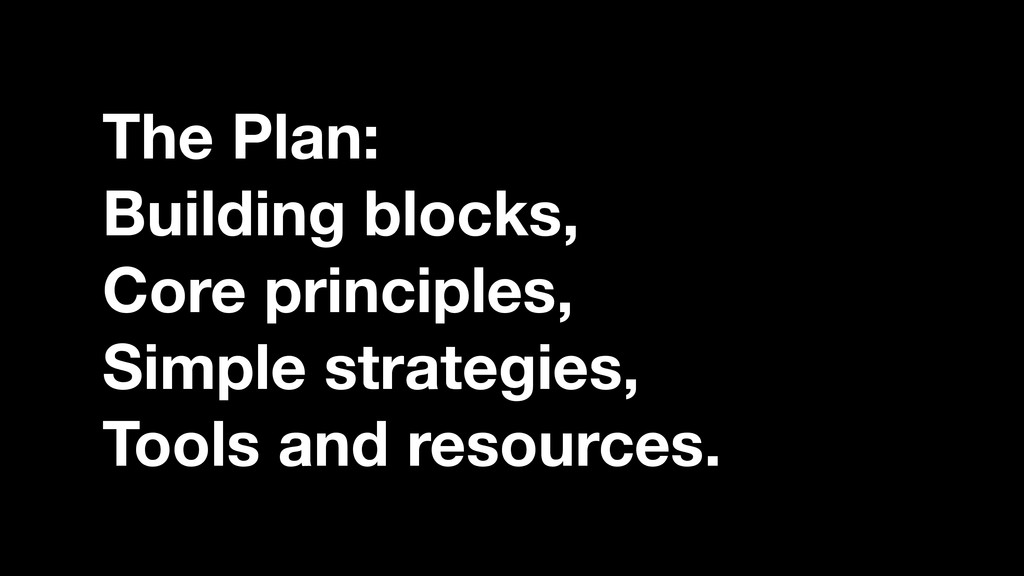
The Plan: Building blocks, Core principles, Simple strategies, Tools and
resources.
Why is data visualization so important now?
Computers vs People
Computers are bad at things like gender, humor.
The Scunthorpe Problem.
The Scunthorpe Problem.
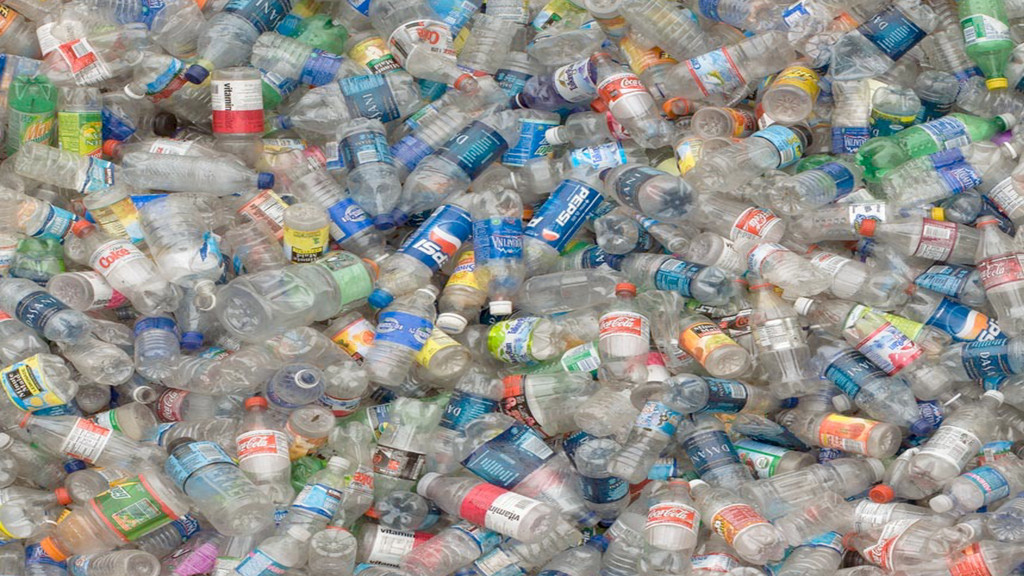
Data is for computers.
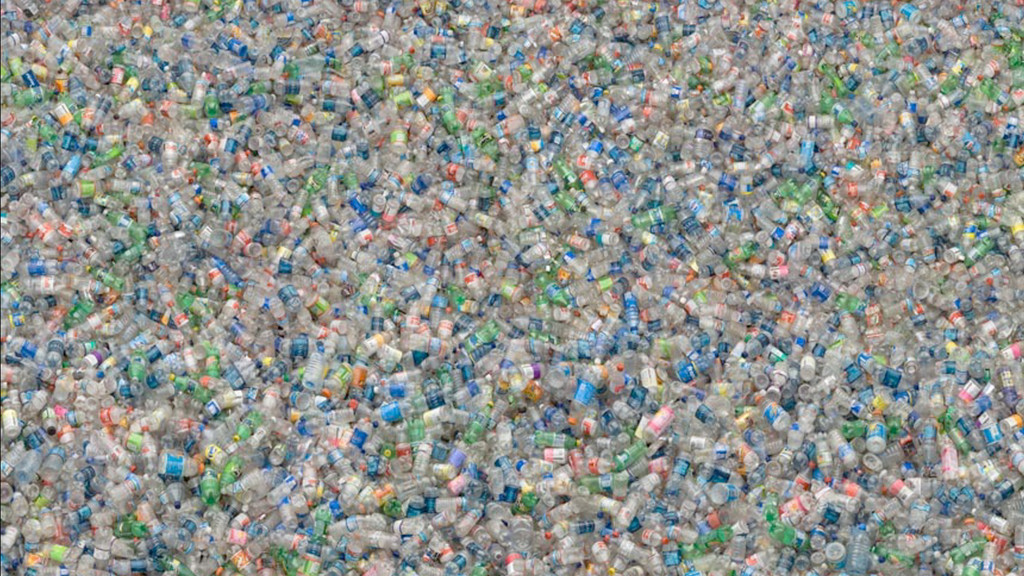
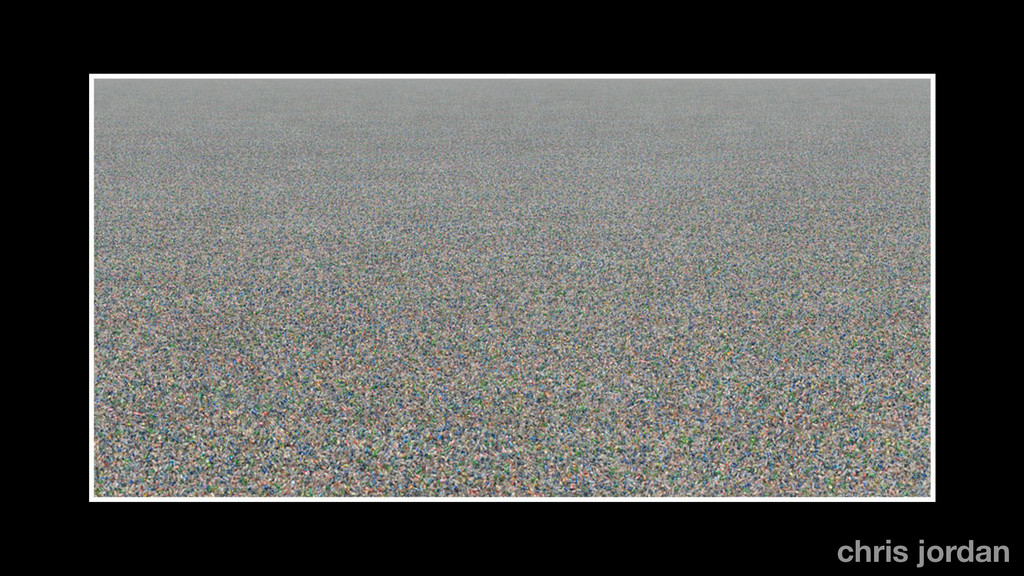
People are bad at things like scale and time.
Everything has become a giant fucking heap. Nick Kallen
shorturl
None
chris jordan
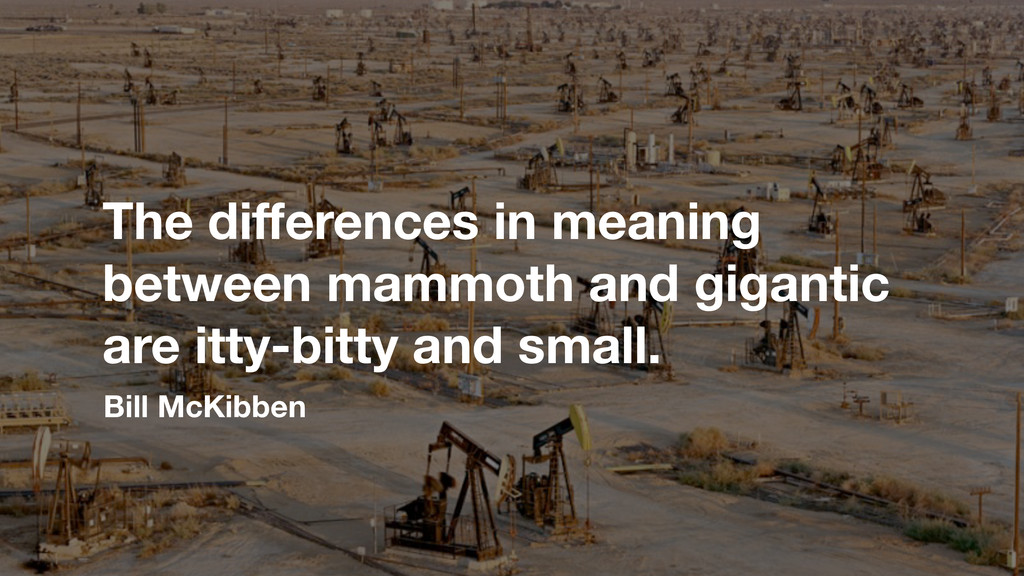
BILL MCKIBBEN
The differences in meaning between mammoth and gigantic are itty-bitty
and small. Bill McKibben
BIG DAM BIG LUNCH
None
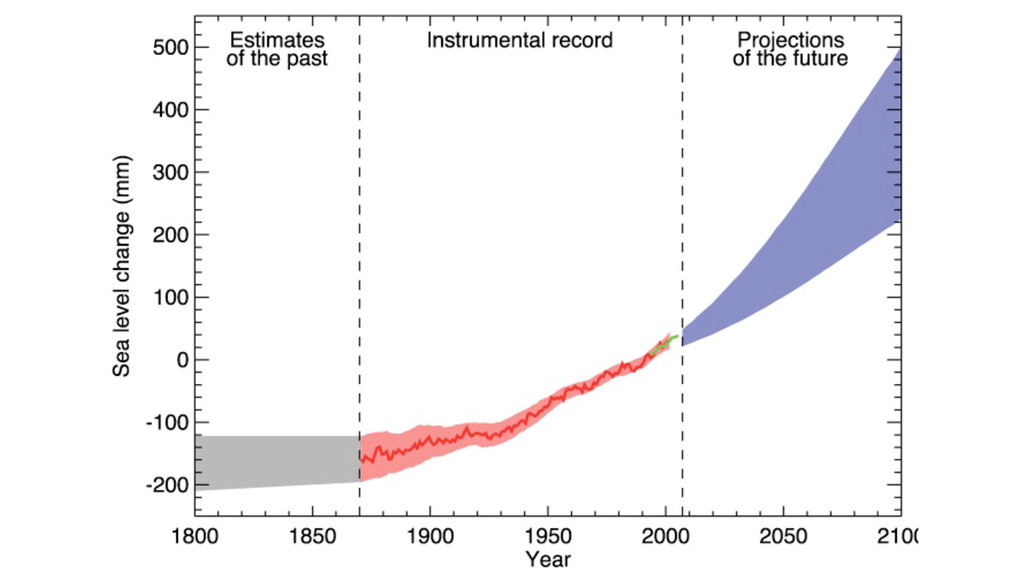
Data visualization is a lens for seeing the world.
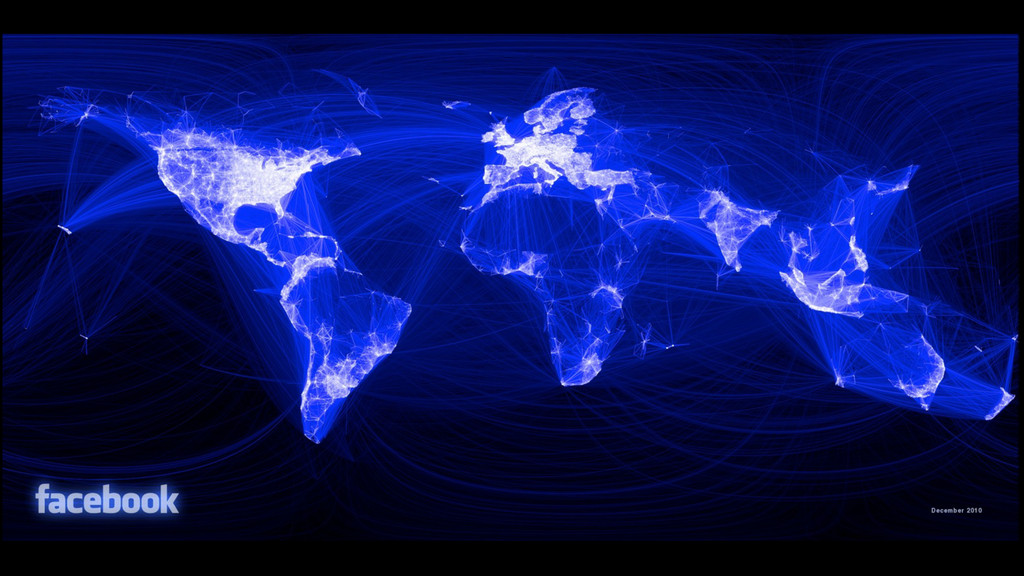
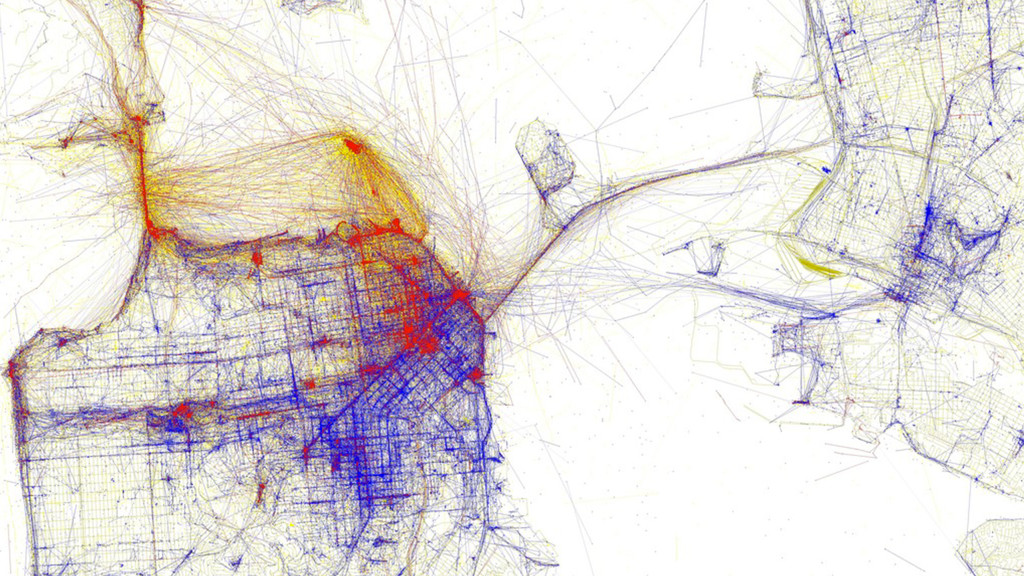
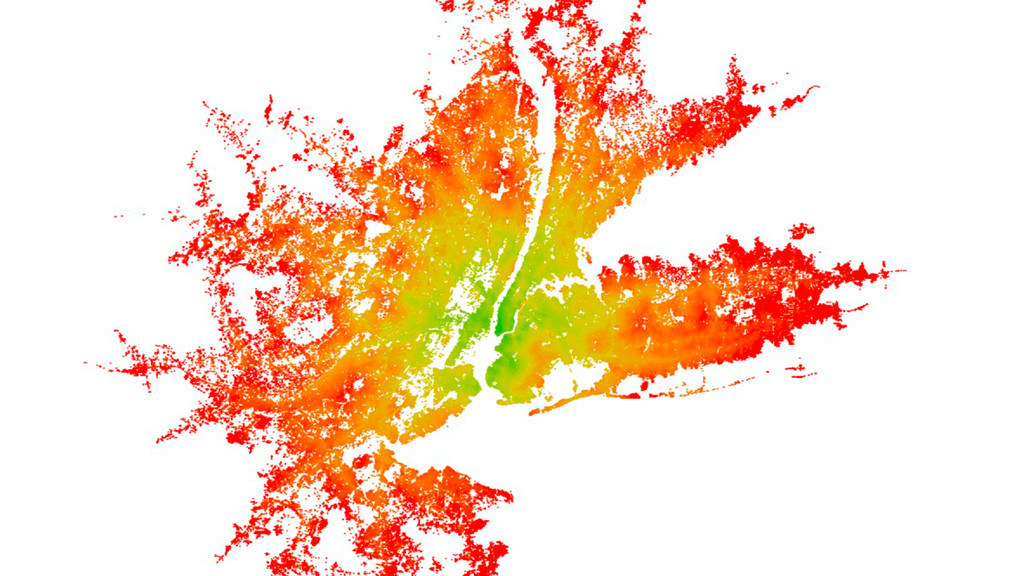
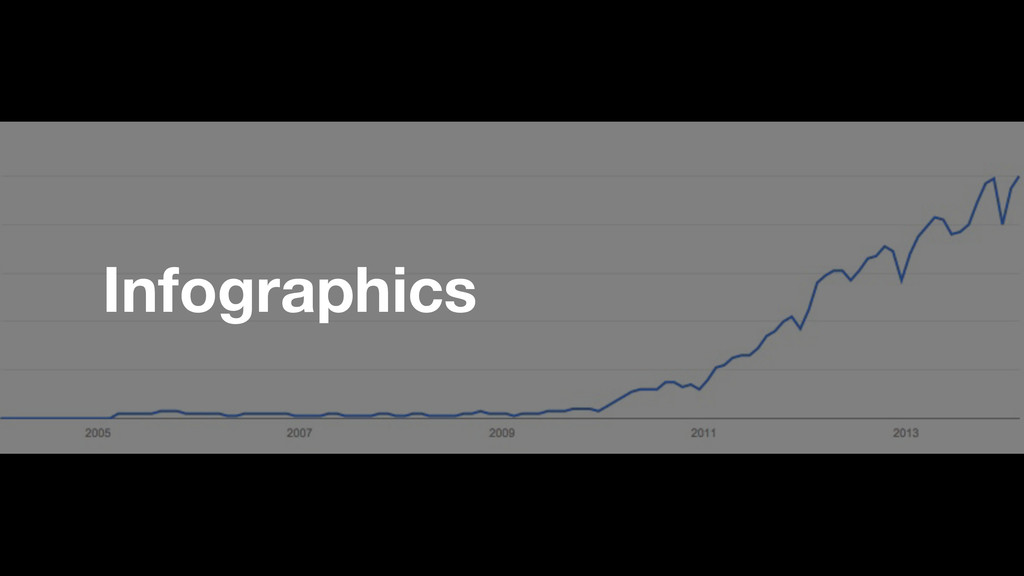
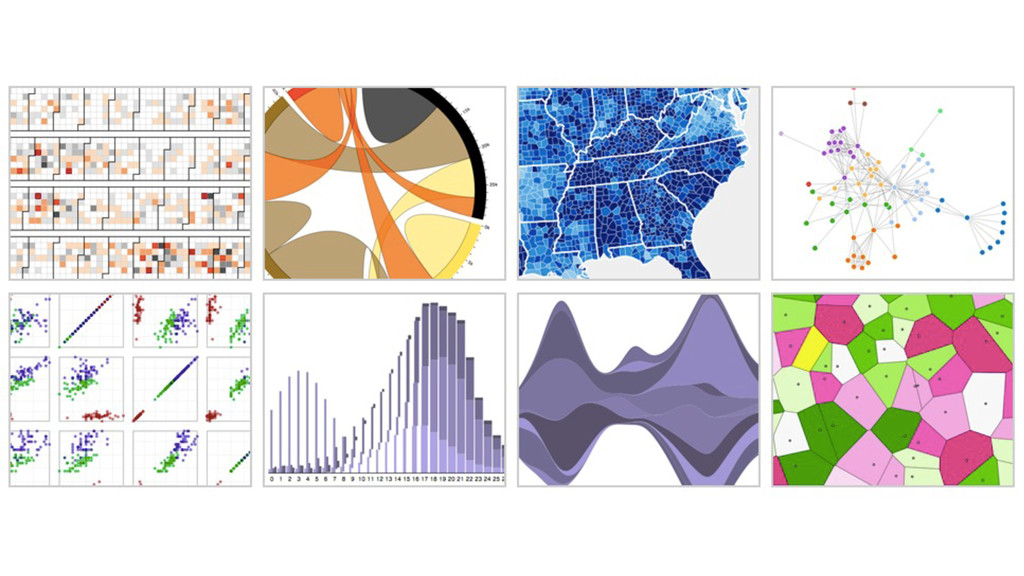
Maps, Infographics, Interactive Visualizations.
None
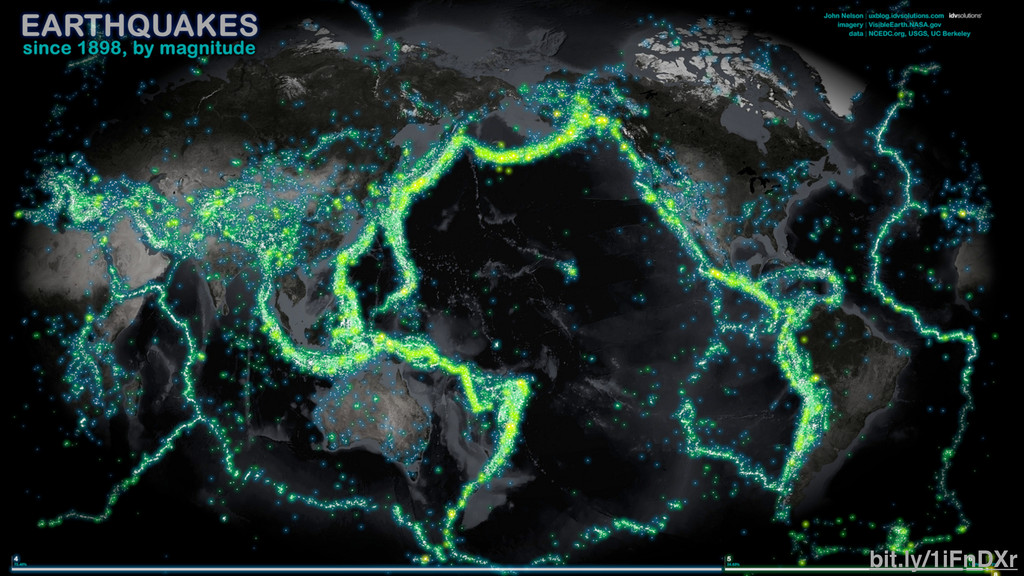
bit.ly/1iFnDXr
aaronkoblin.com/work/flightpatterns
None
None
None
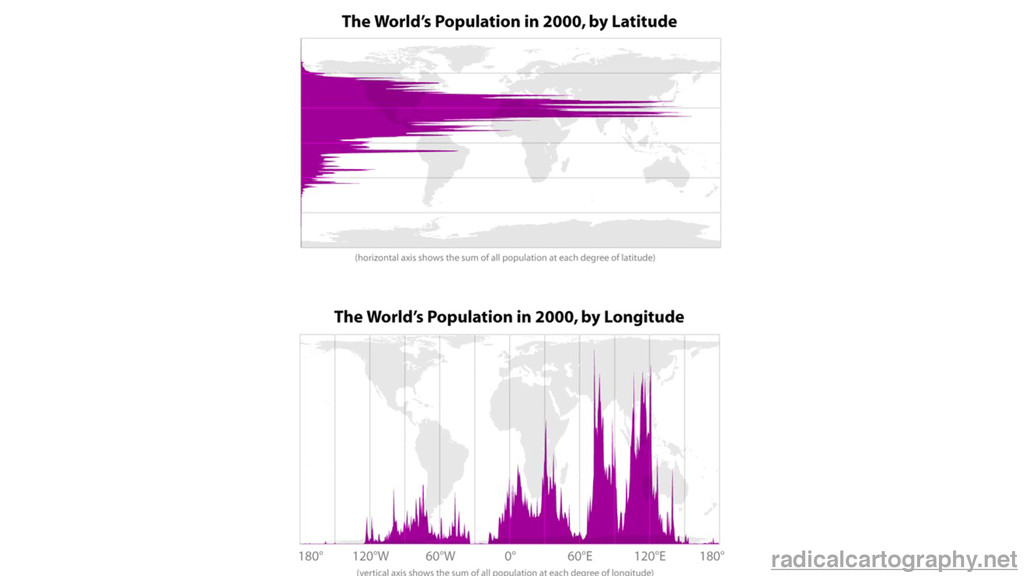
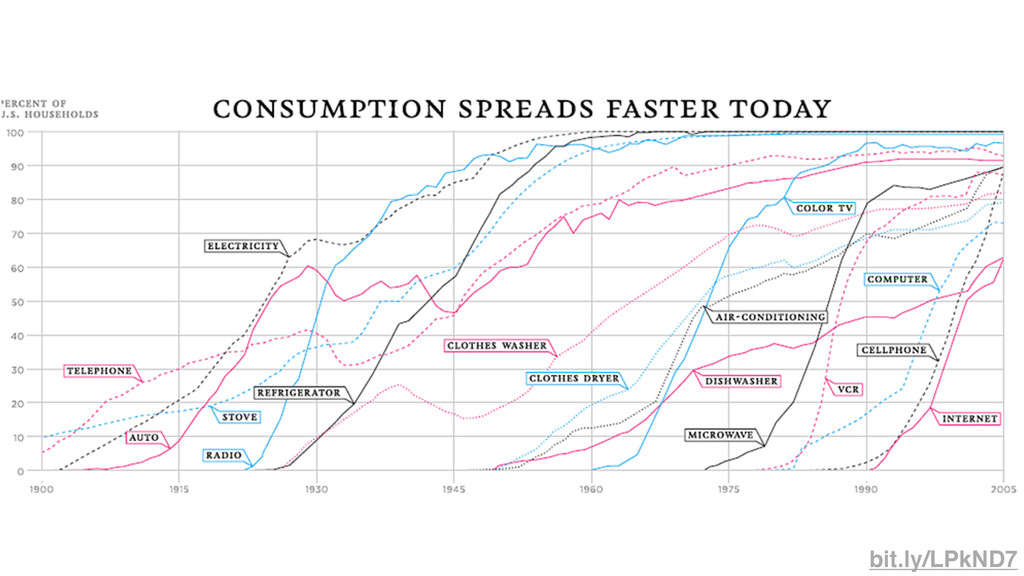
Infographics
radicalcartography.net
bit.ly/LPkND7
None
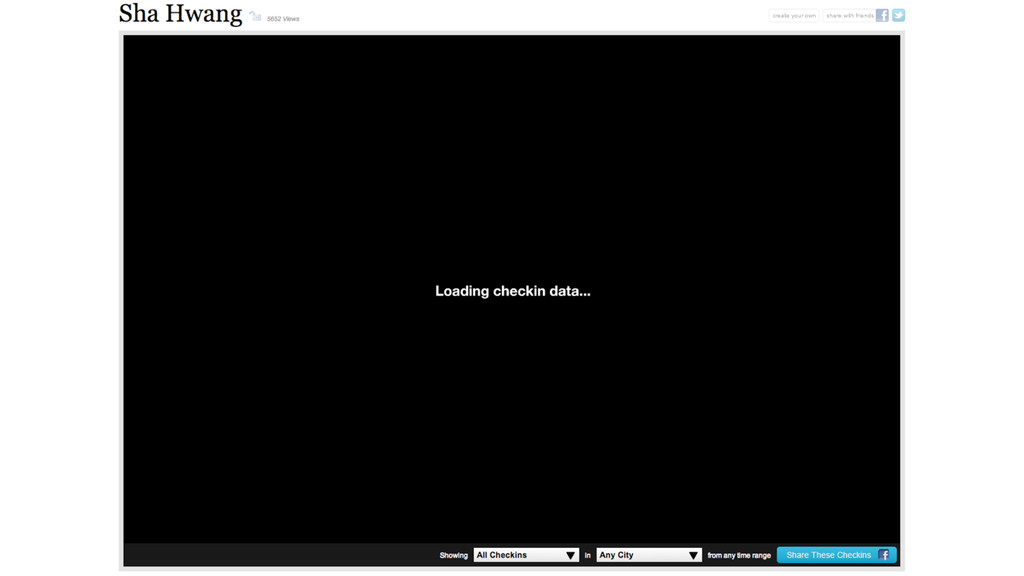
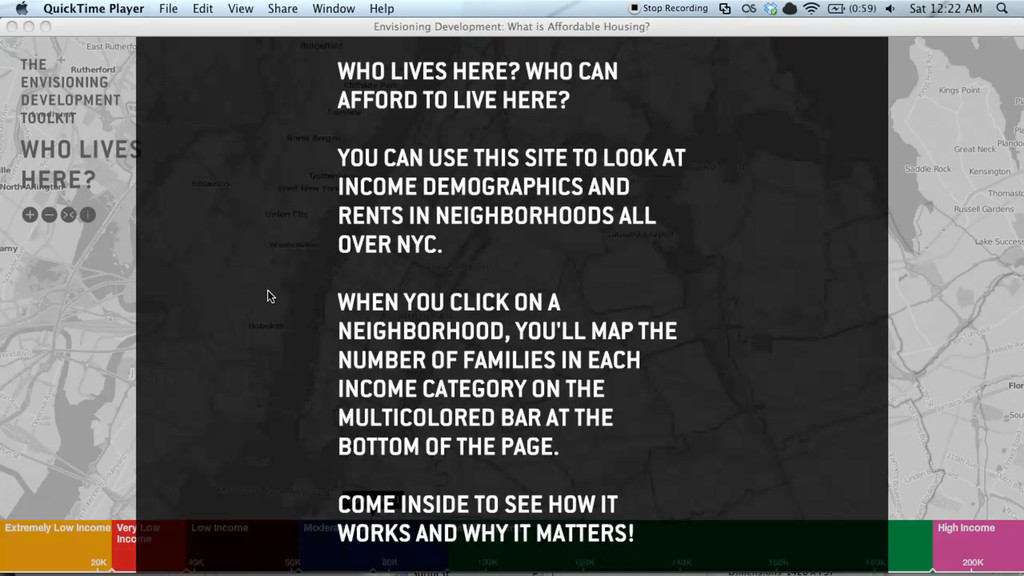
Interactive Visualizations
None
None
So, where do you begin?
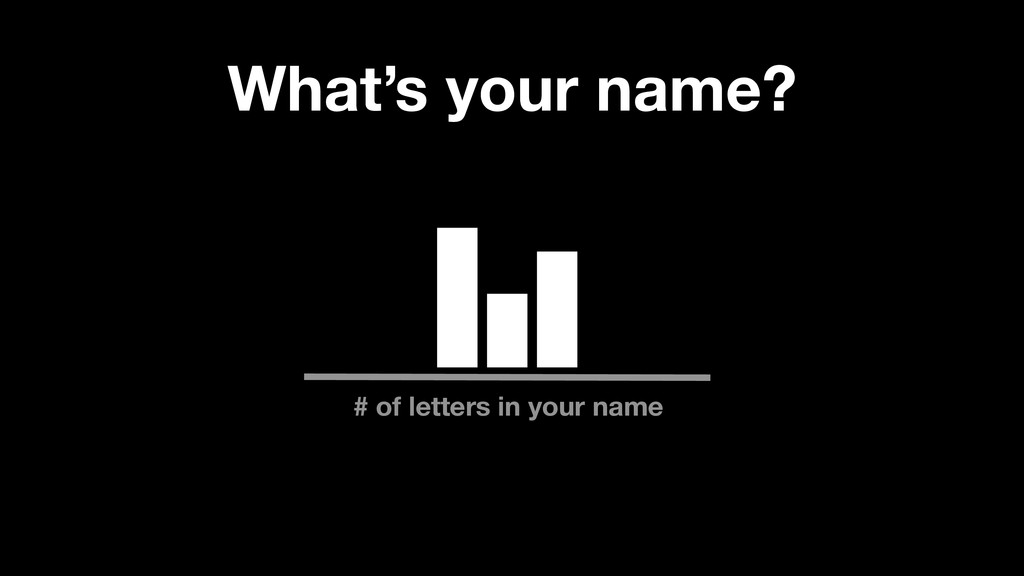
Exercise 1 Fun with markers
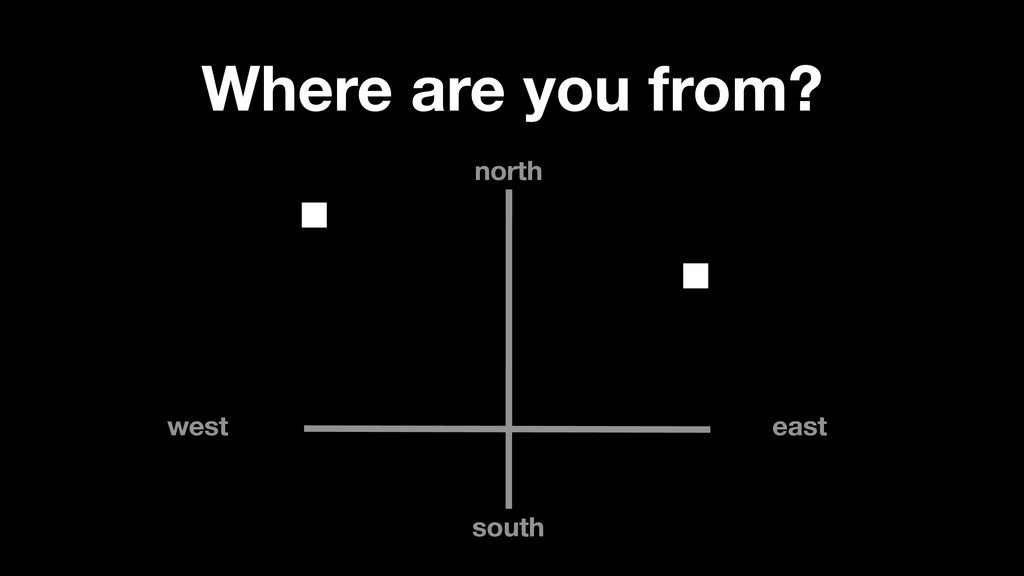
Four Questions: 1. What’s your name? 2. Where are you
coming from? 3. When are you the most productive? 4. What colors are you wearing?
What’s your name? # of letters in your name
Where are you from? east west north south
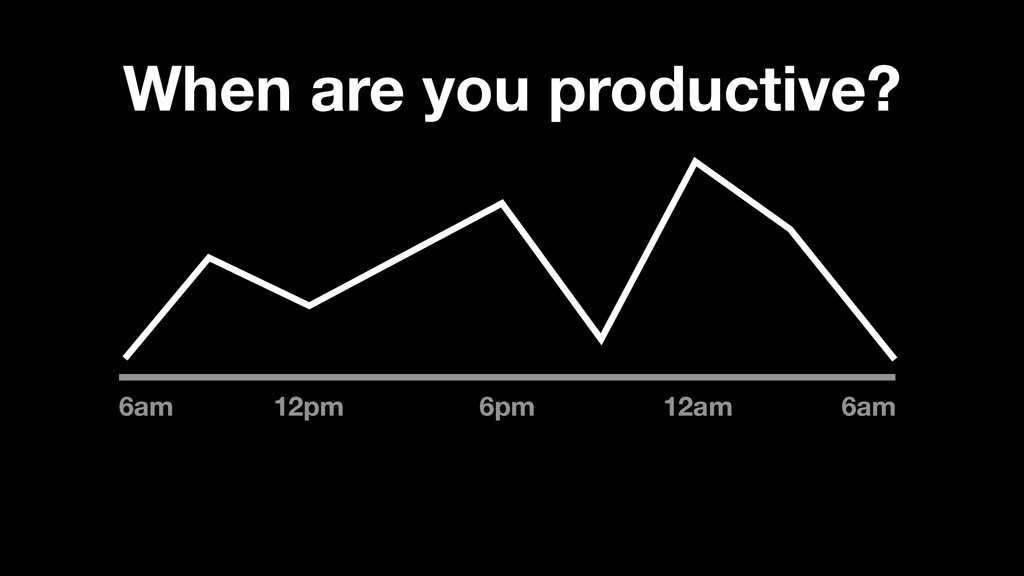
When are you productive? 12pm 6am 6am 6pm 12am
When are you productive? 12pm 6am 6am 6pm 12am
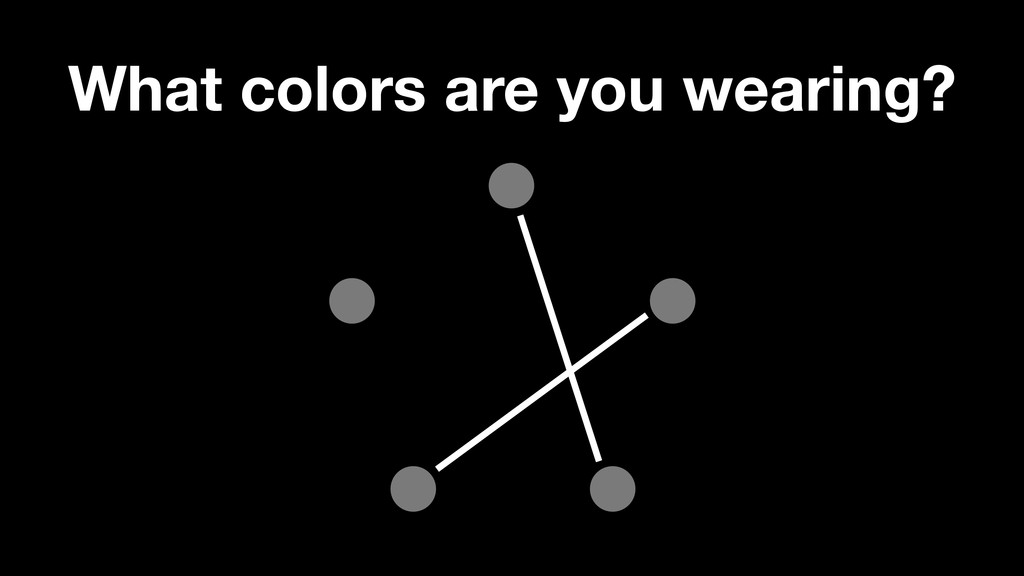
What colors are you wearing?
Let’s see what we’ve made!
Why is data visualization an effective tool?
Preattentive Processing
None
None
None
None
Pretty cool huh?
None
Color& Size& Shape& Position.
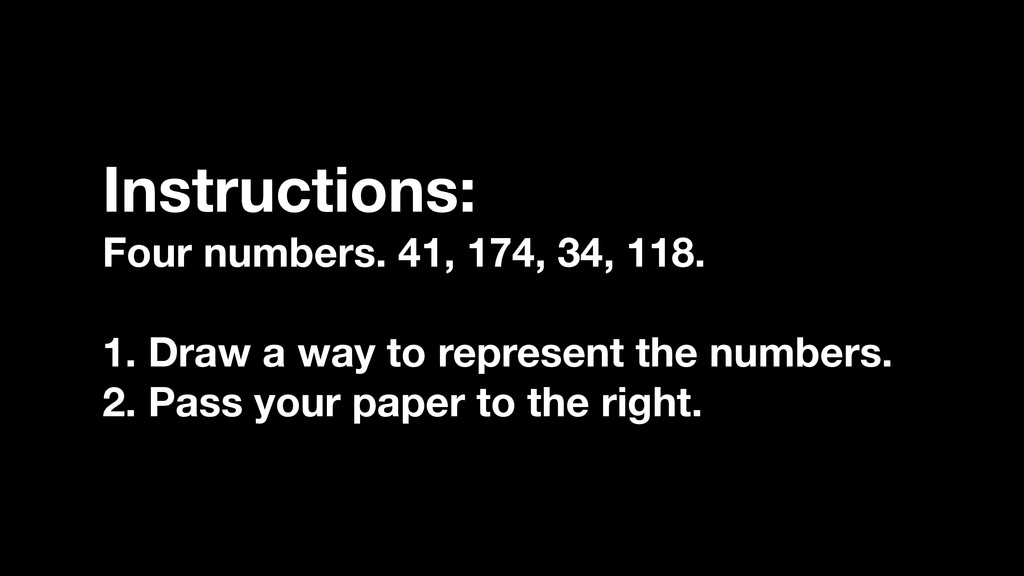
Exercise 2 Encoding numbers
Instructions: Four numbers. 41, 174, 34, 118. 1. Draw a
way to represent the numbers. 2. Pass your paper to the right.
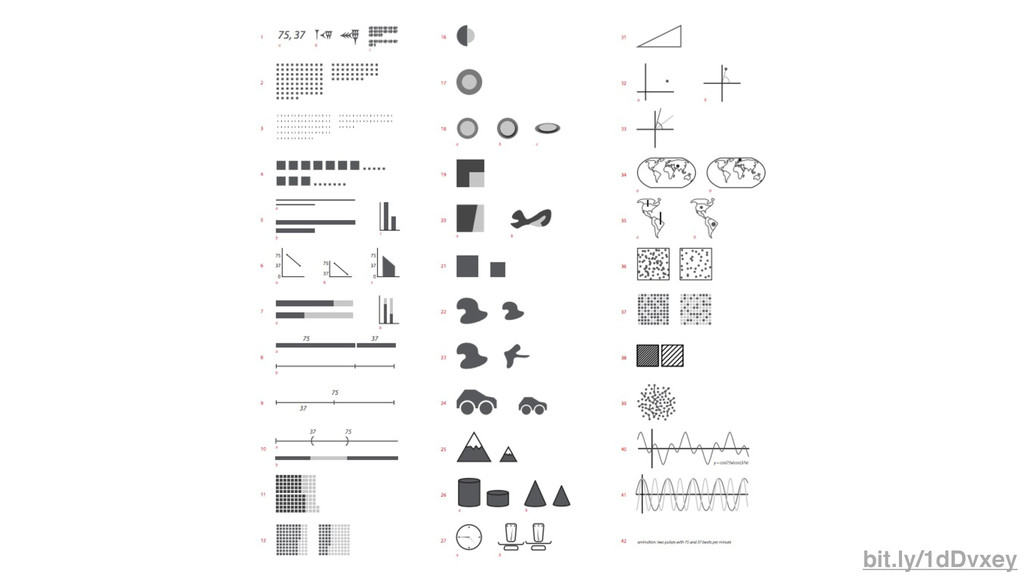
bit.ly/1dDvxey
Information visualization is a language. Santiago Ortiz
Data visualization is a language of scale.
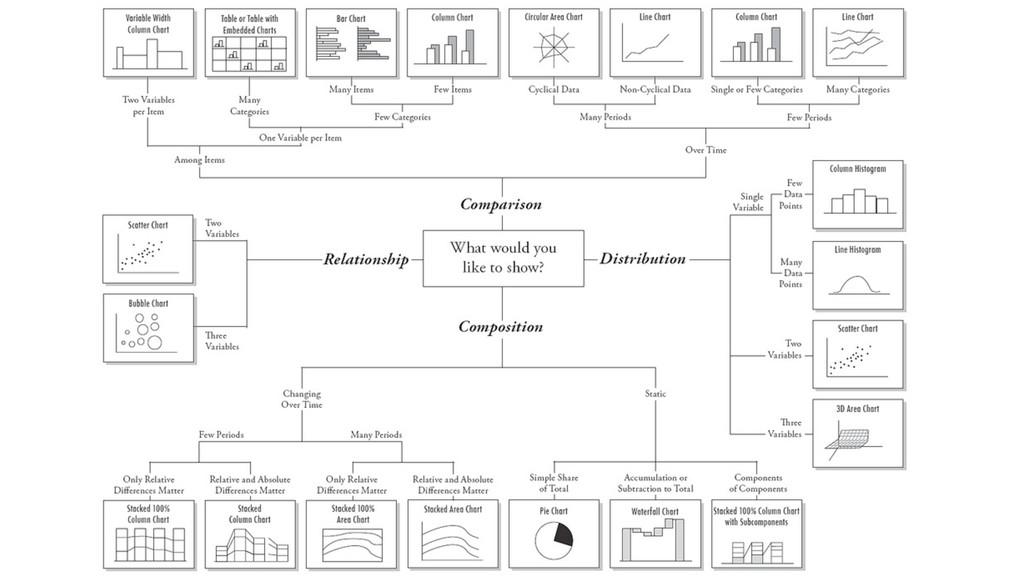
Let’s build up our vocabulary.
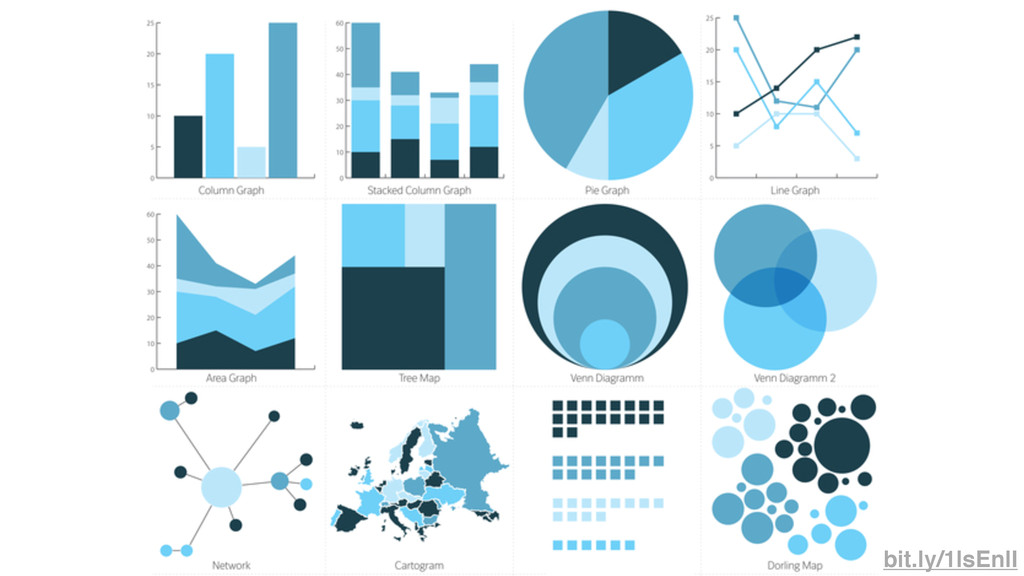
bit.ly/1lsEnlI
None
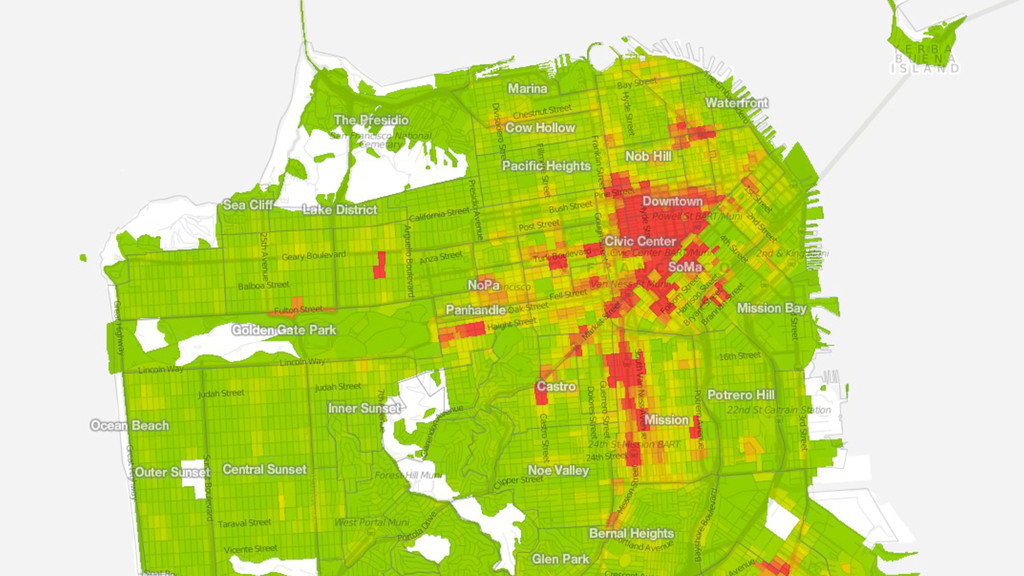
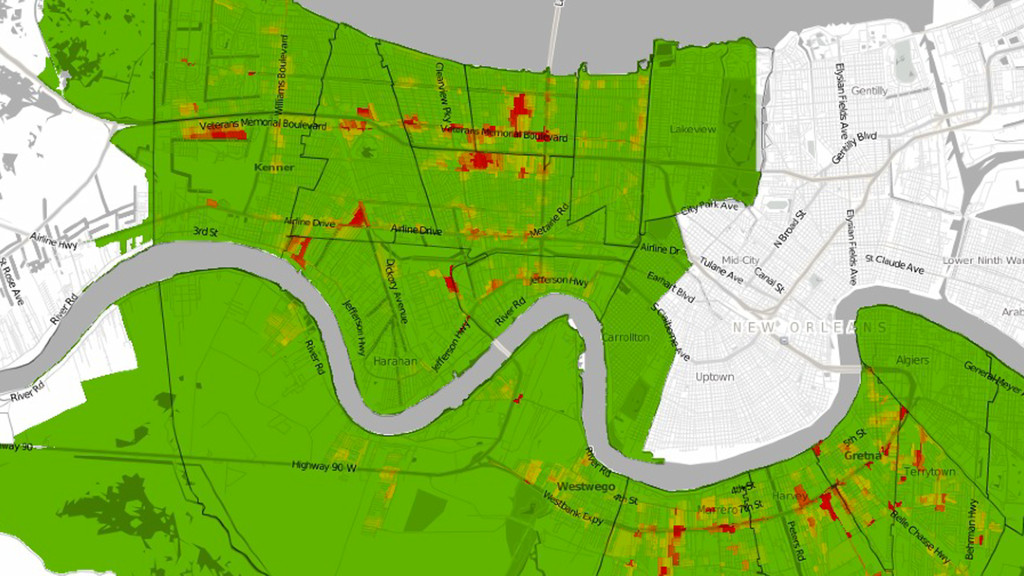
Simple questions. Simple strategies.
Who? What? Where? When?
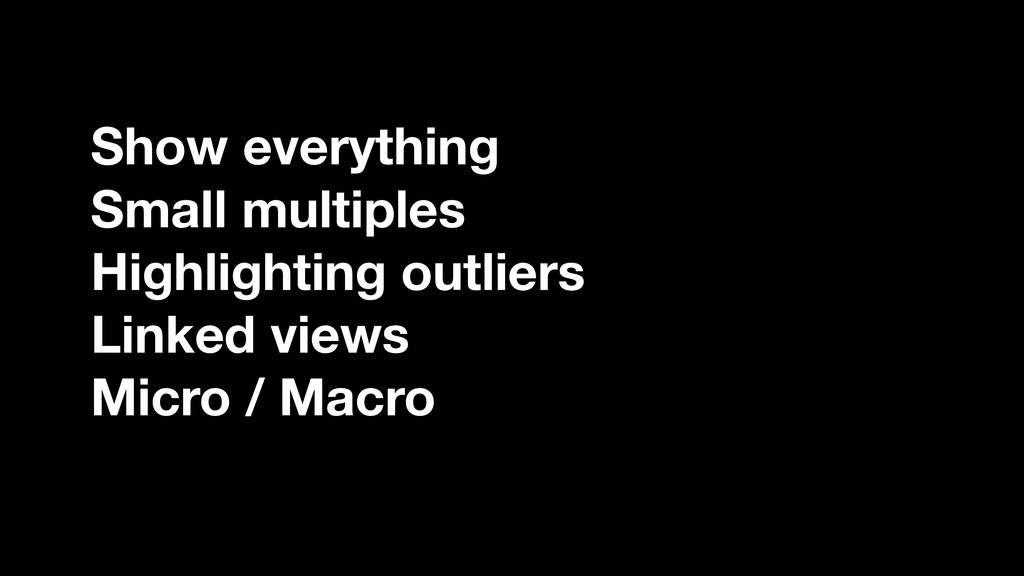
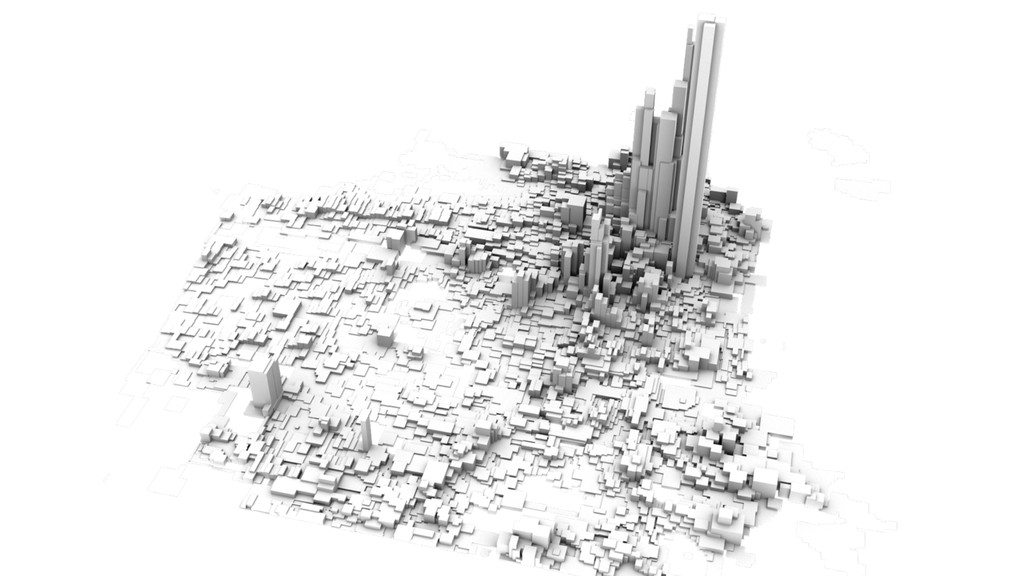
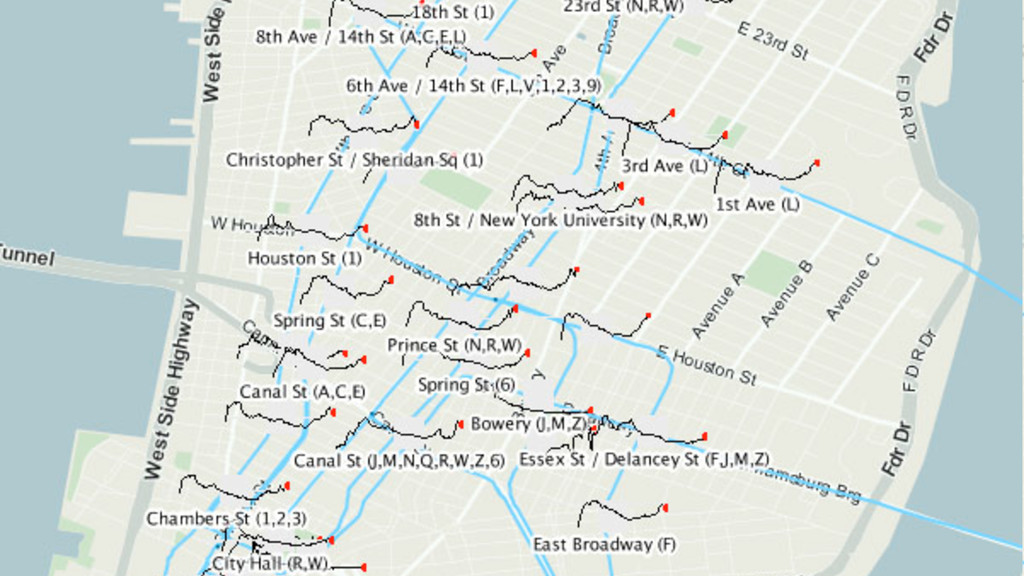
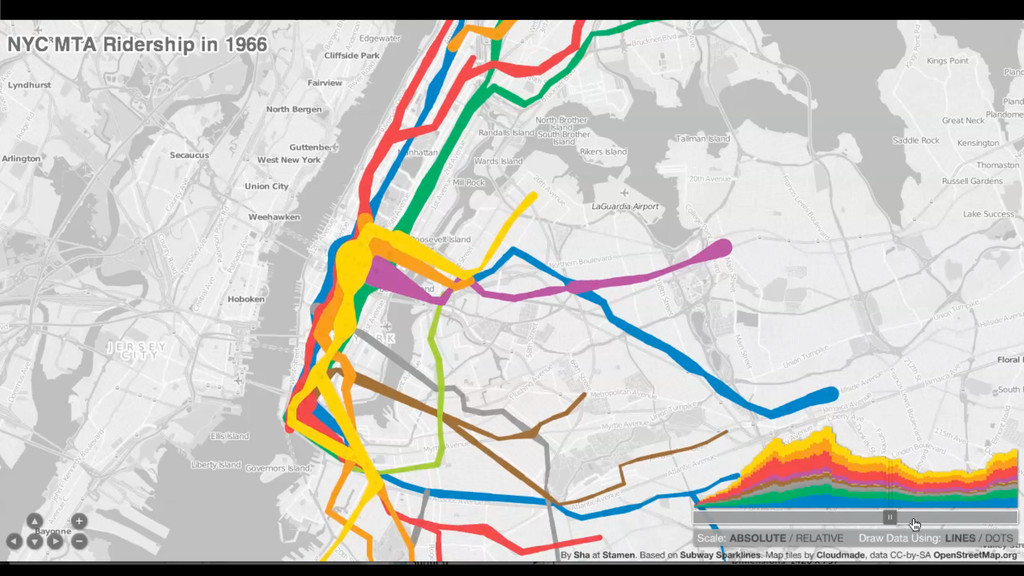
Show everything Small multiples Highlighting outliers Linked views Micro /
Macro
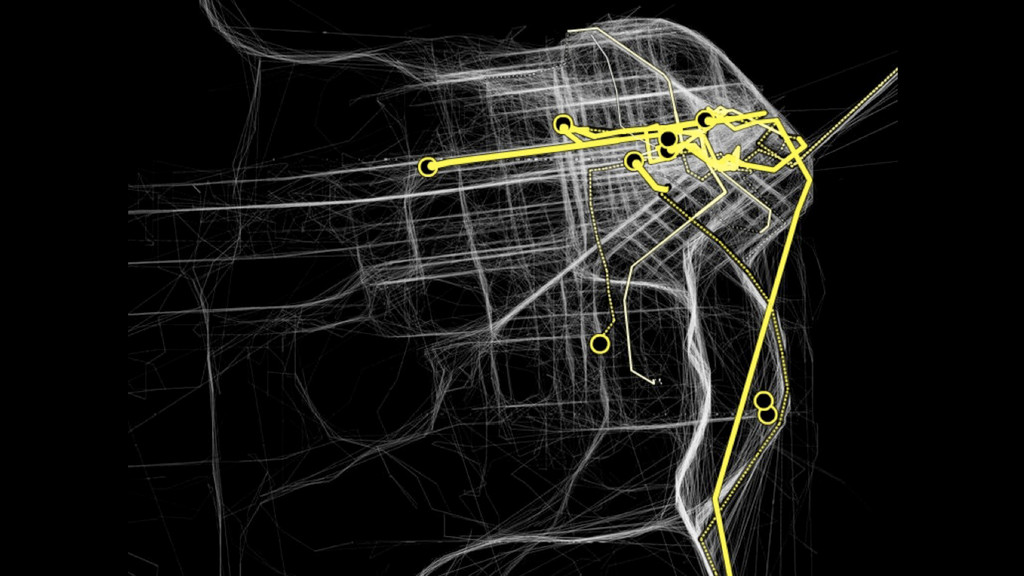
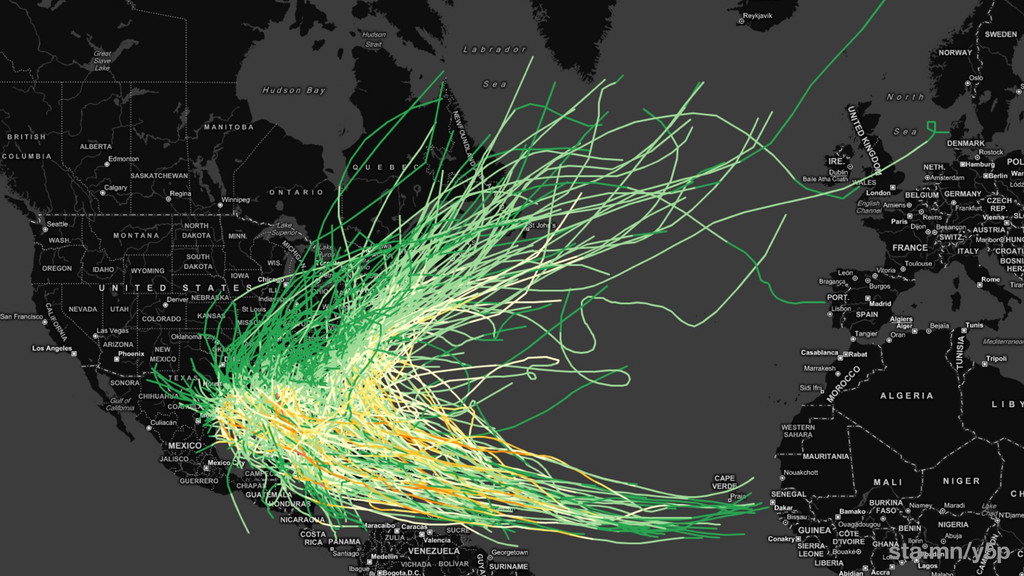
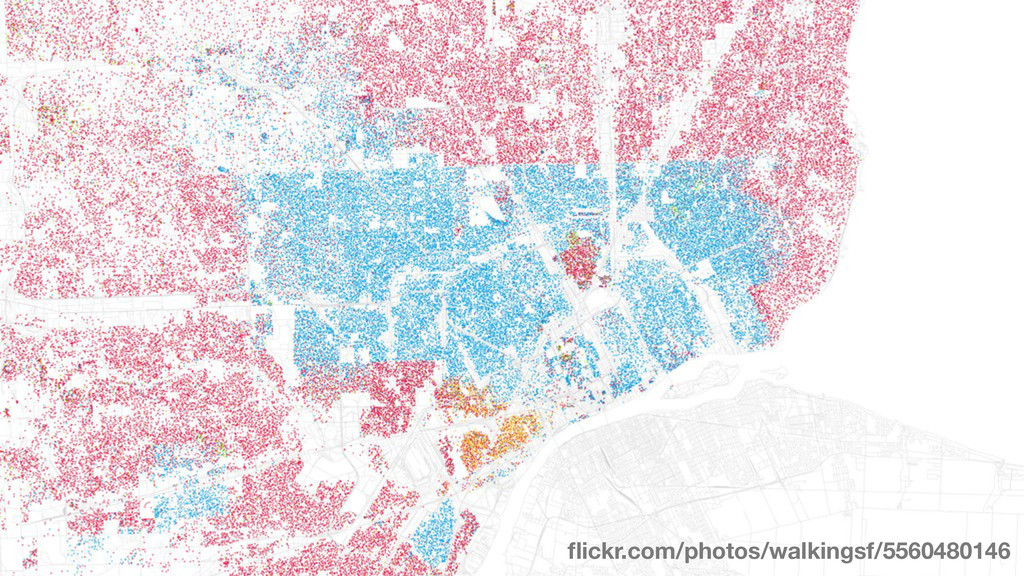
Show everything
None
sta.mn/y5p
flickr.com/photos/walkingsf/5560480146
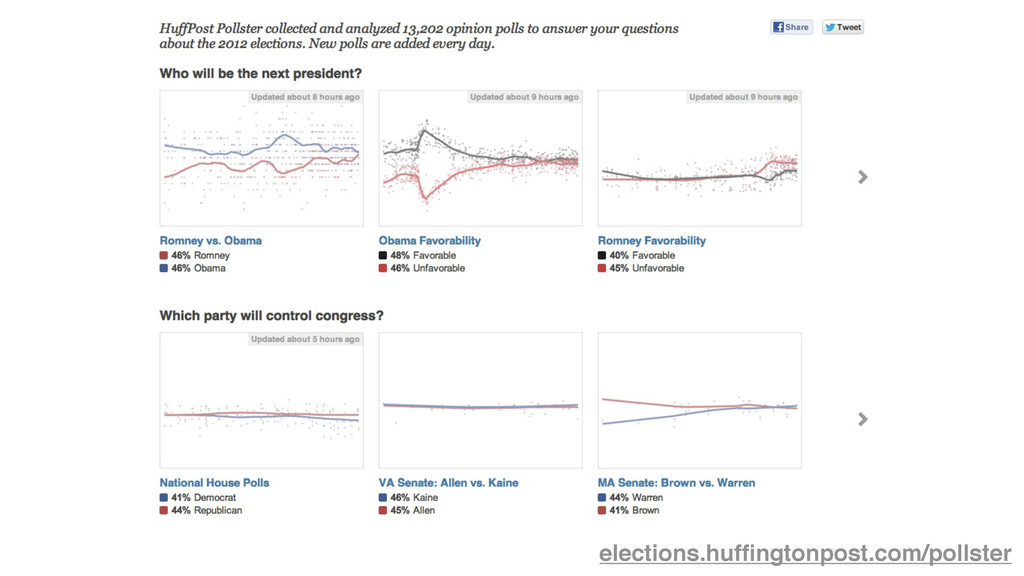
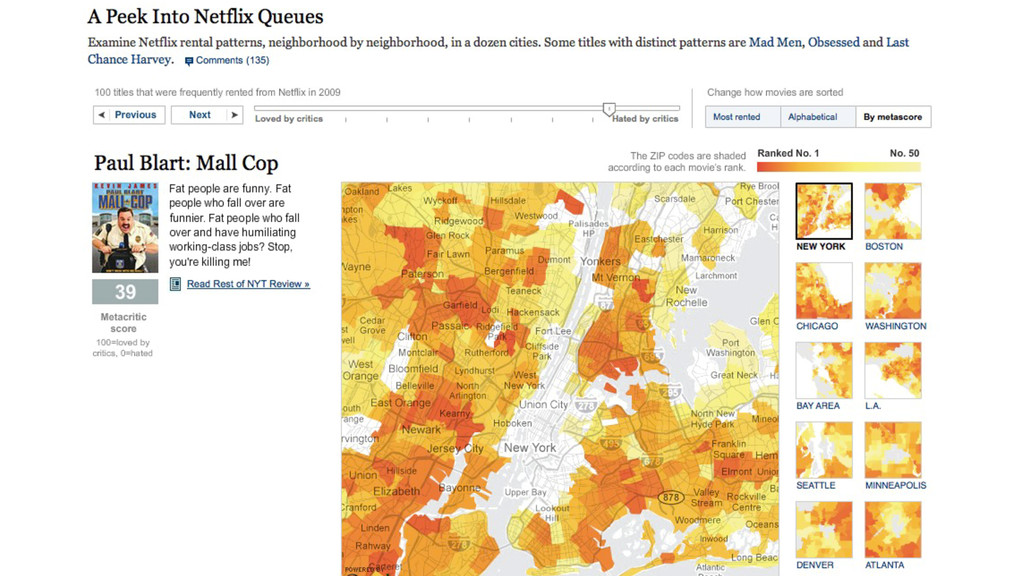
Small multiples
elections.huffingtonpost.com/pollster
None
None
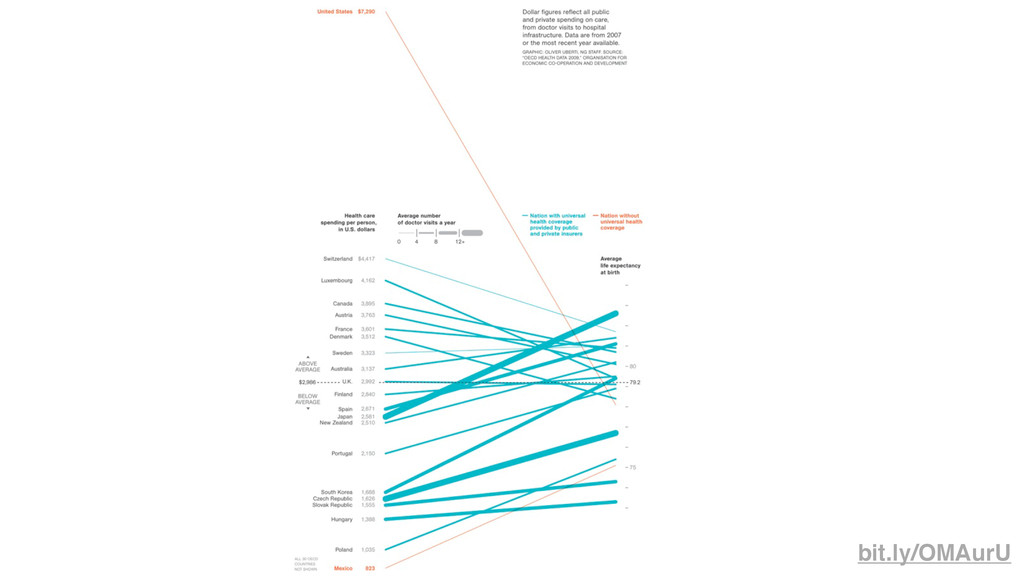
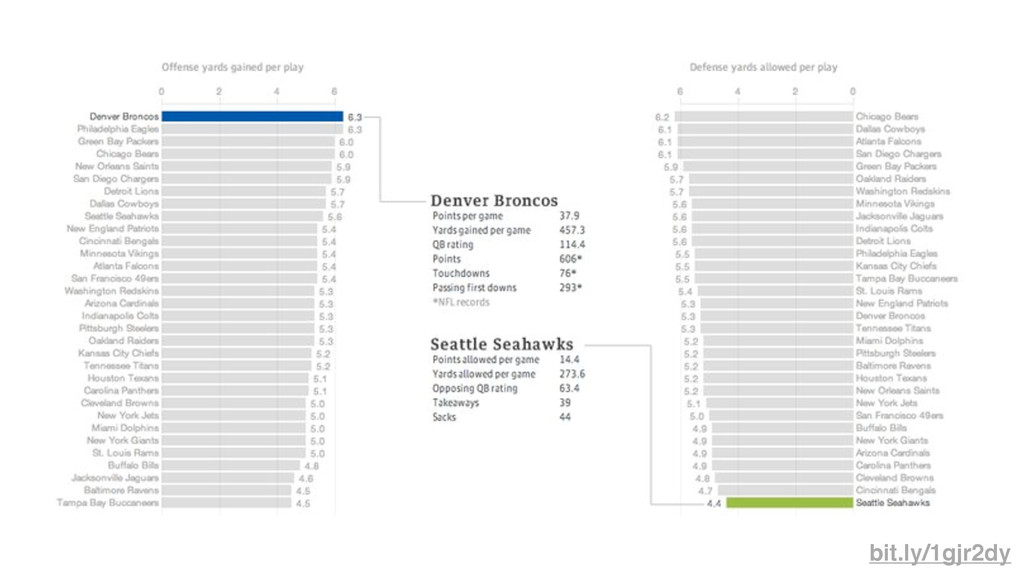
Highlighting outliers
bit.ly/OMAurU
bit.ly/1gjr2dy
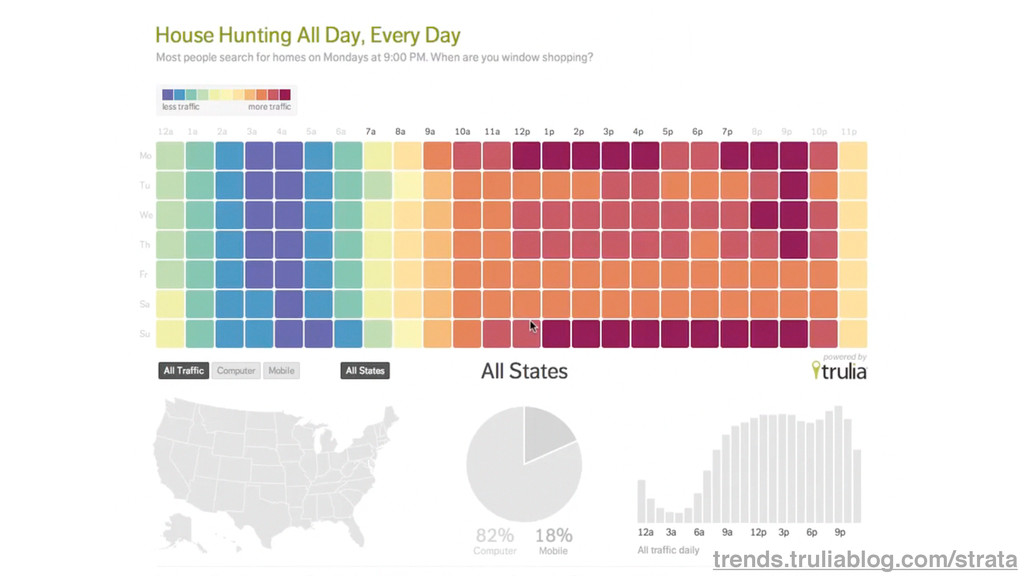
Linked views
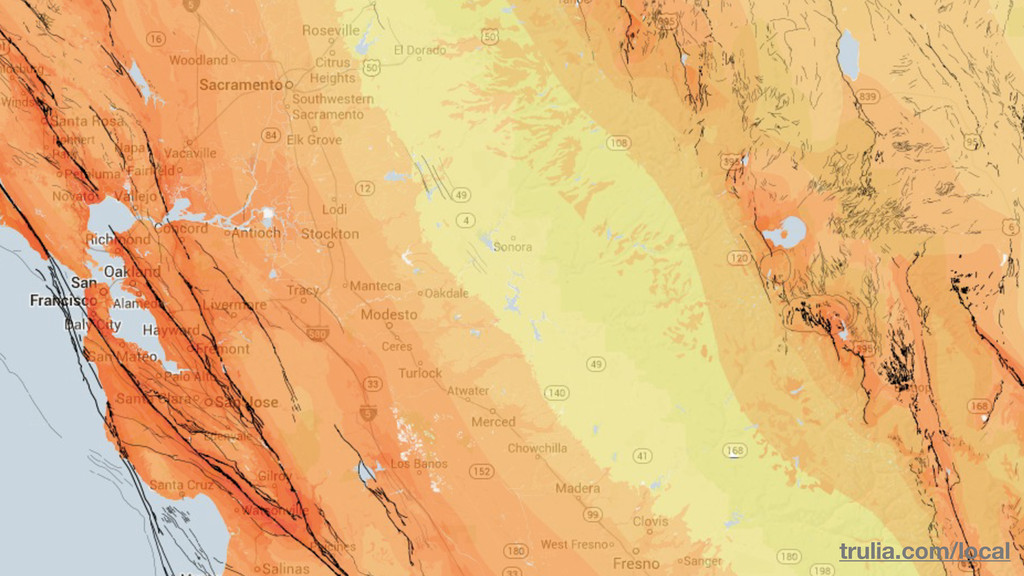
trends.truliablog.com/strata
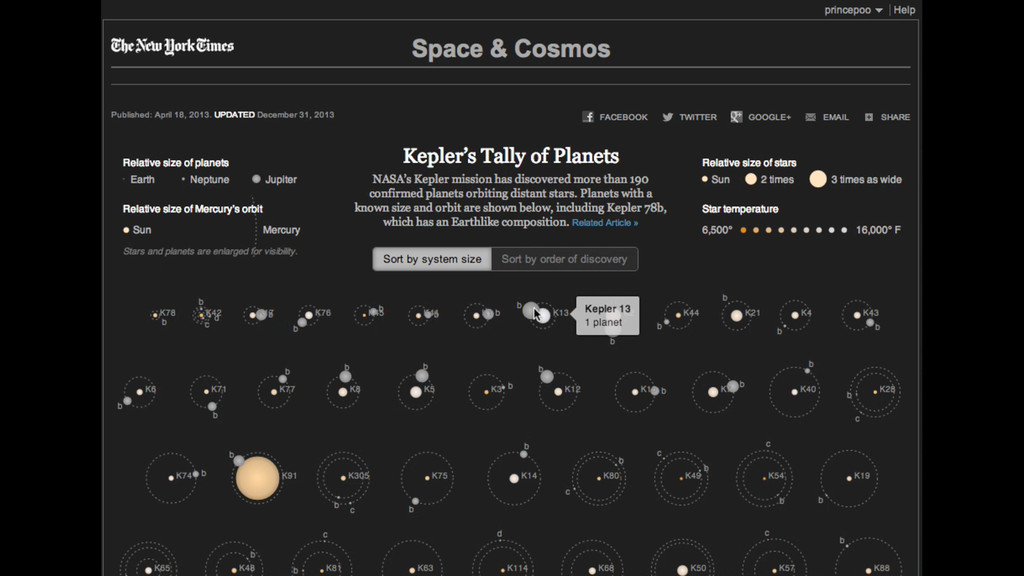
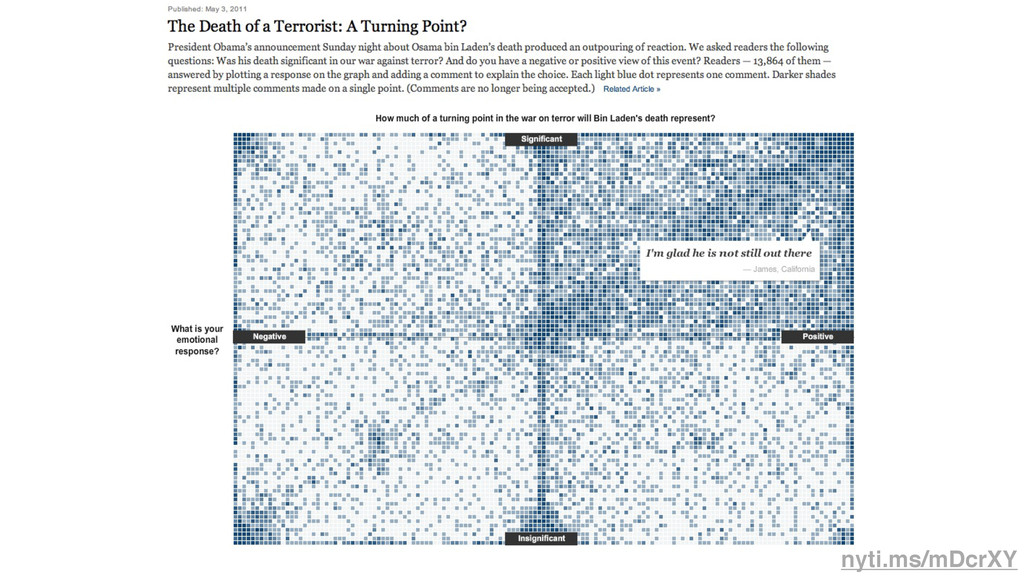
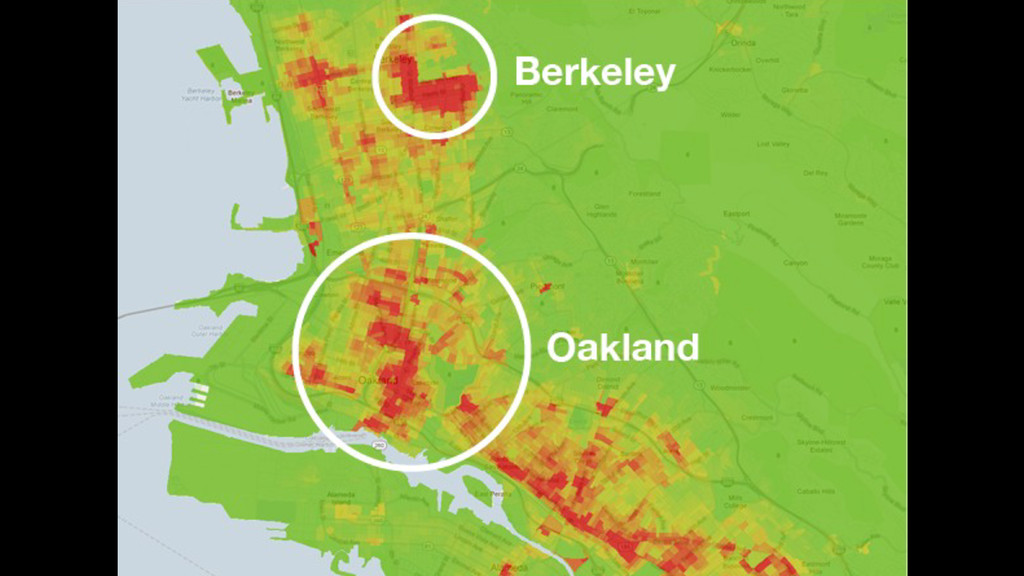
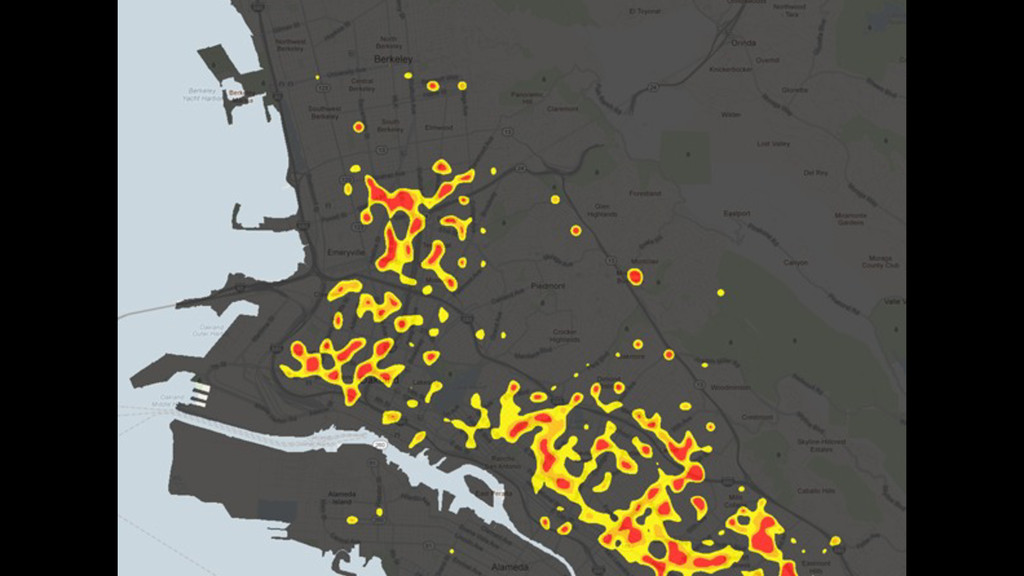
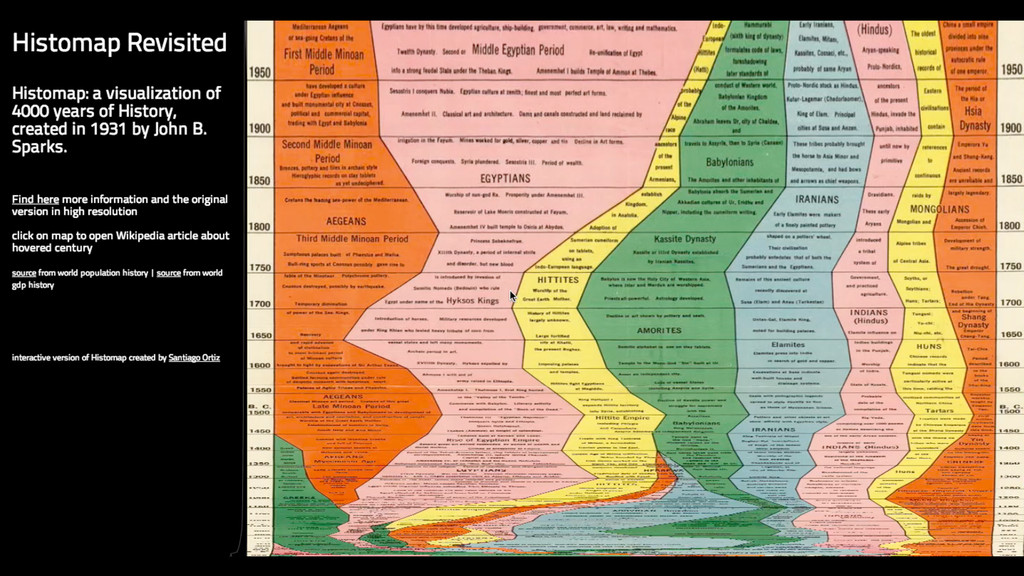
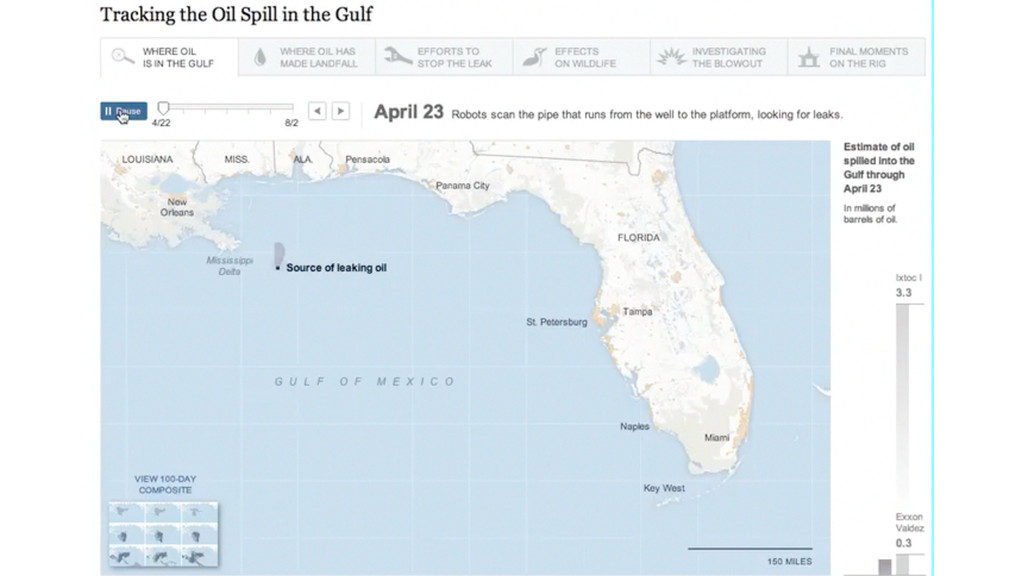
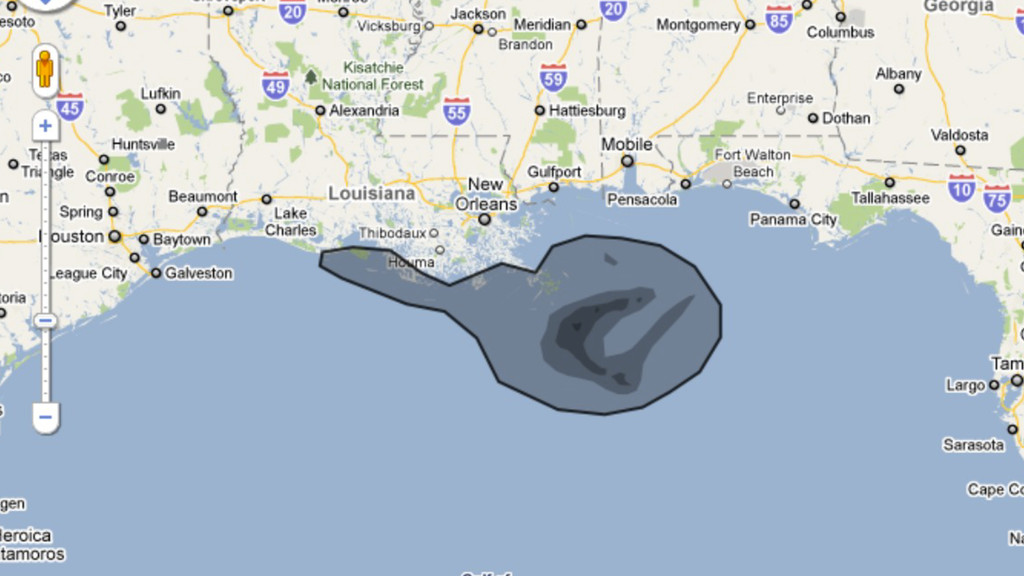
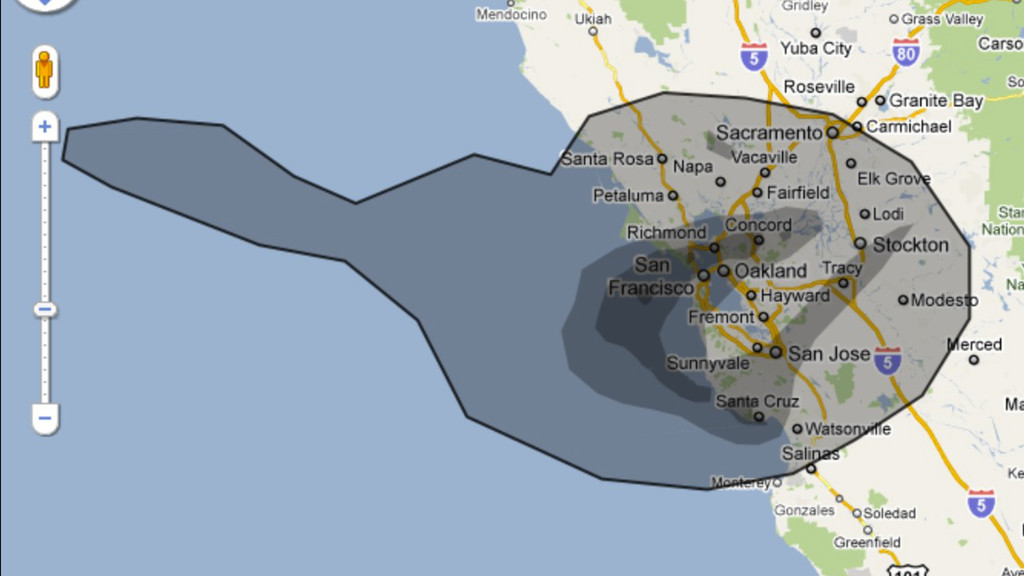
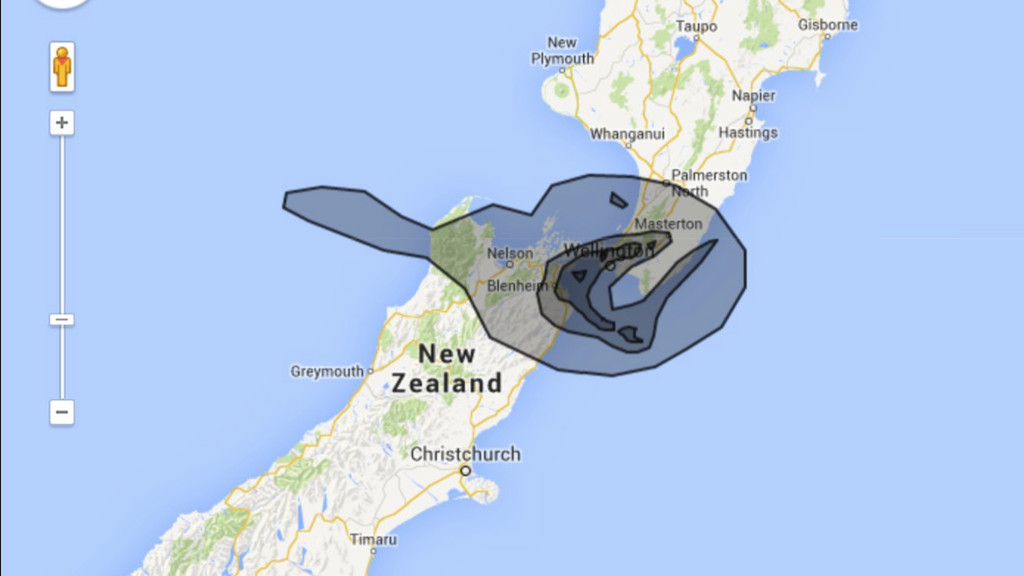
Micro and macro
nyti.ms/mDcrXY
guns.periscopic.com
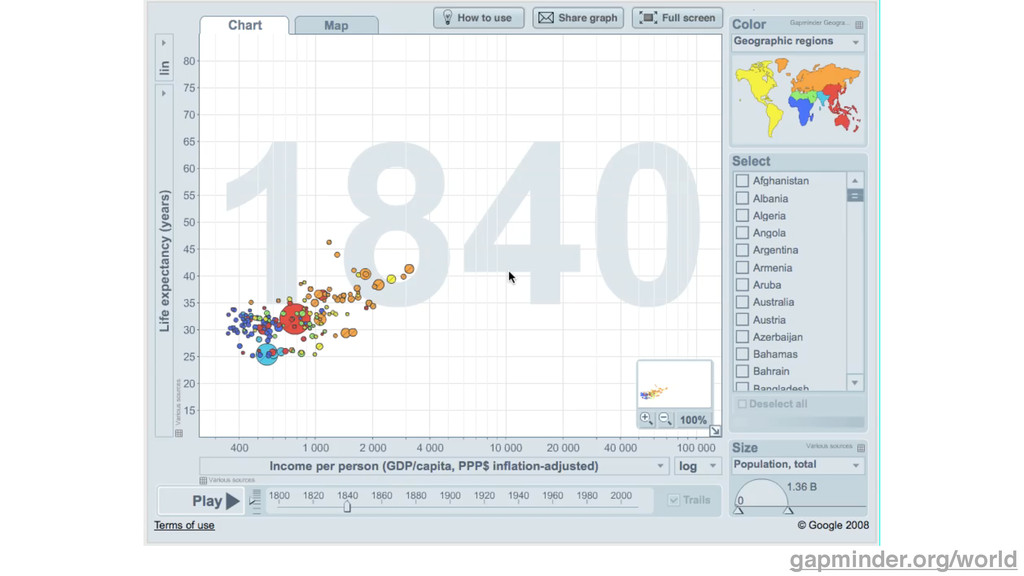
Put a slider on it.
gapminder.org/world
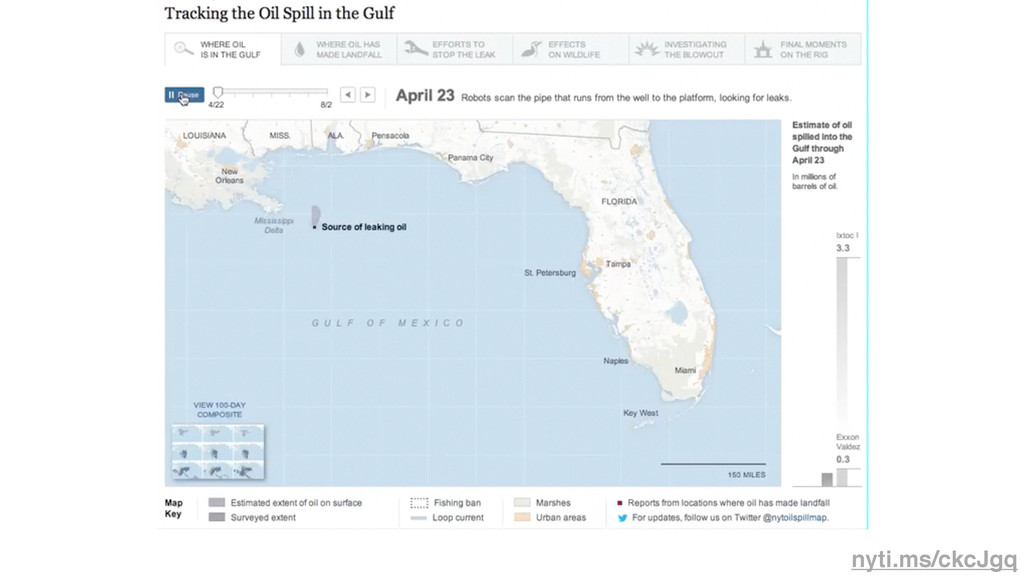
nyti.ms/ckcJgq
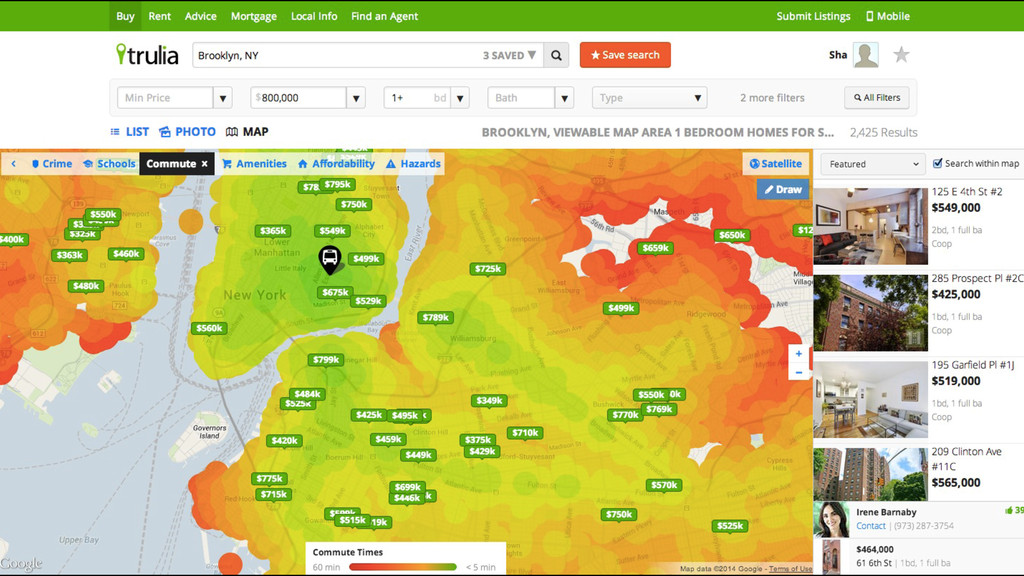
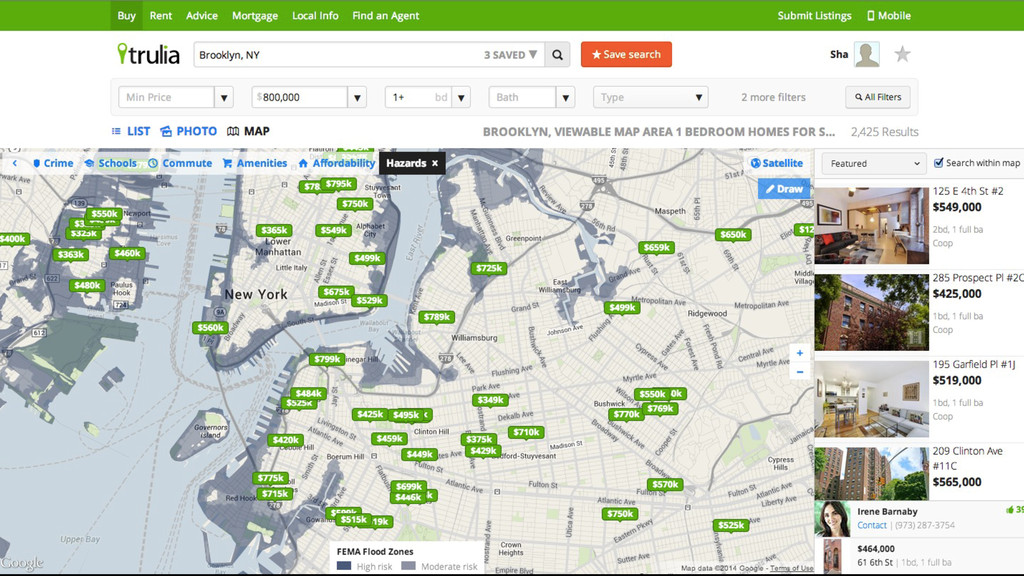
Combine datasets.
None
None
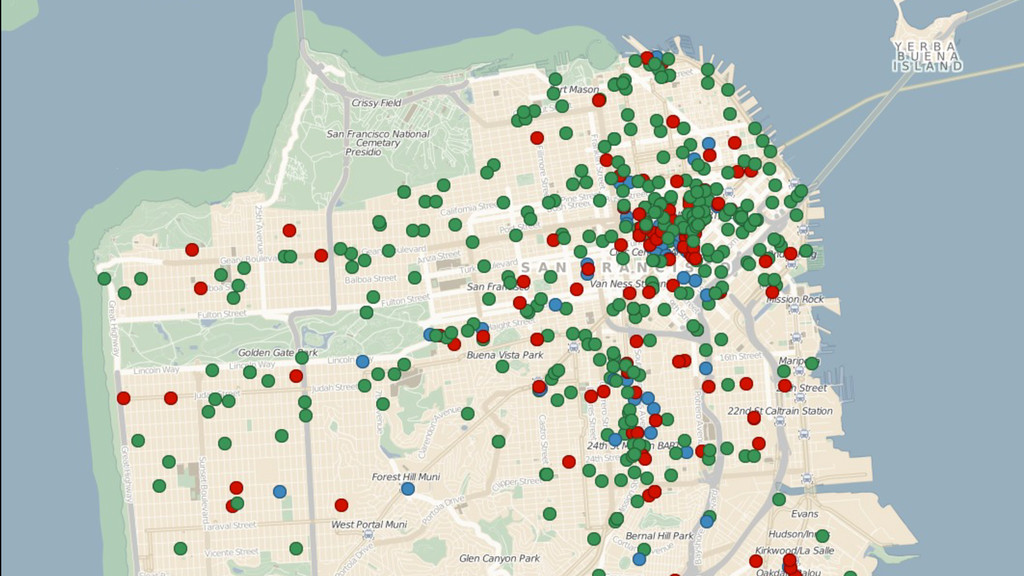
trulia.com/local
Okay, so.
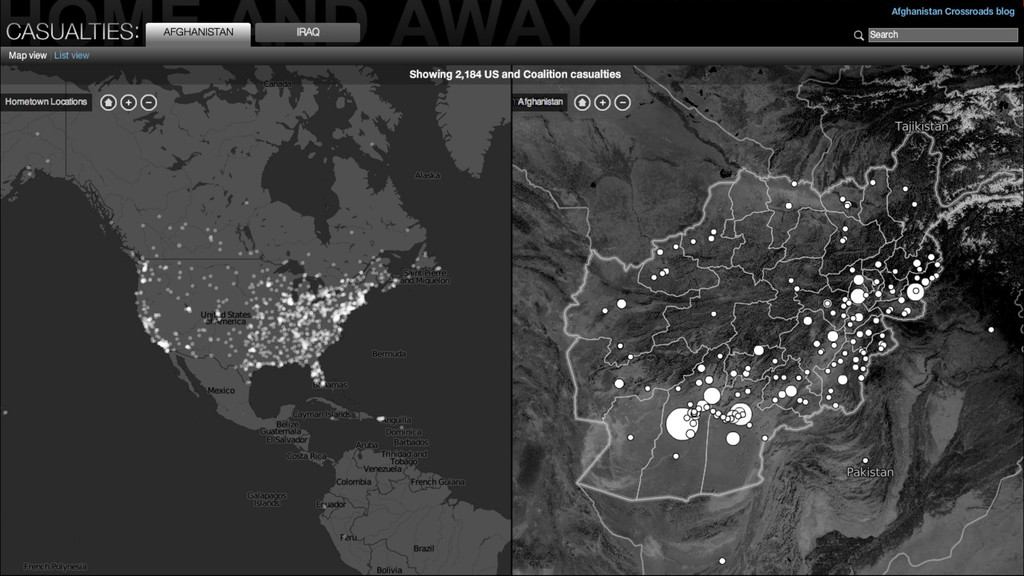
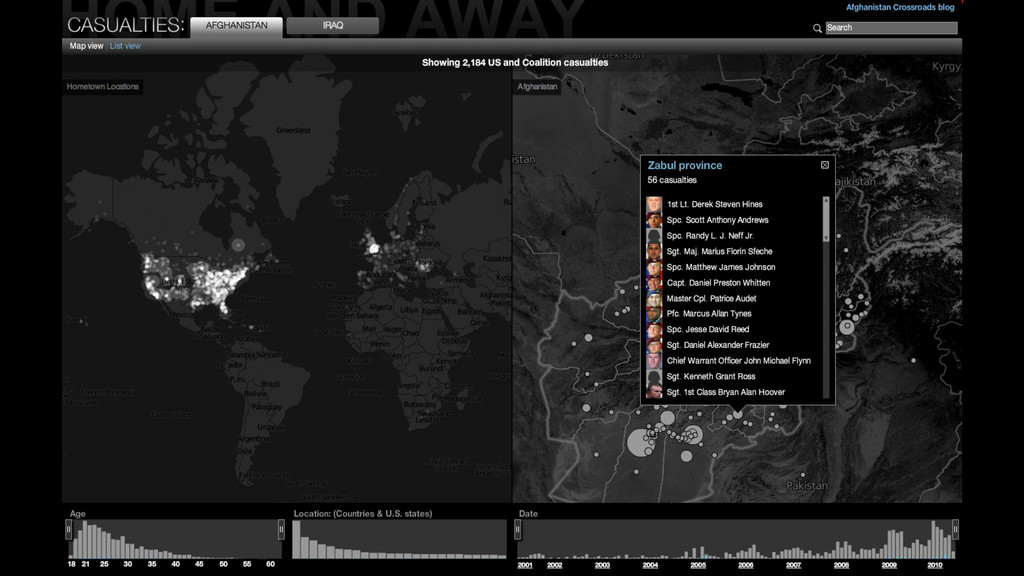
Exercise 3 Asking questions of a dataset
None
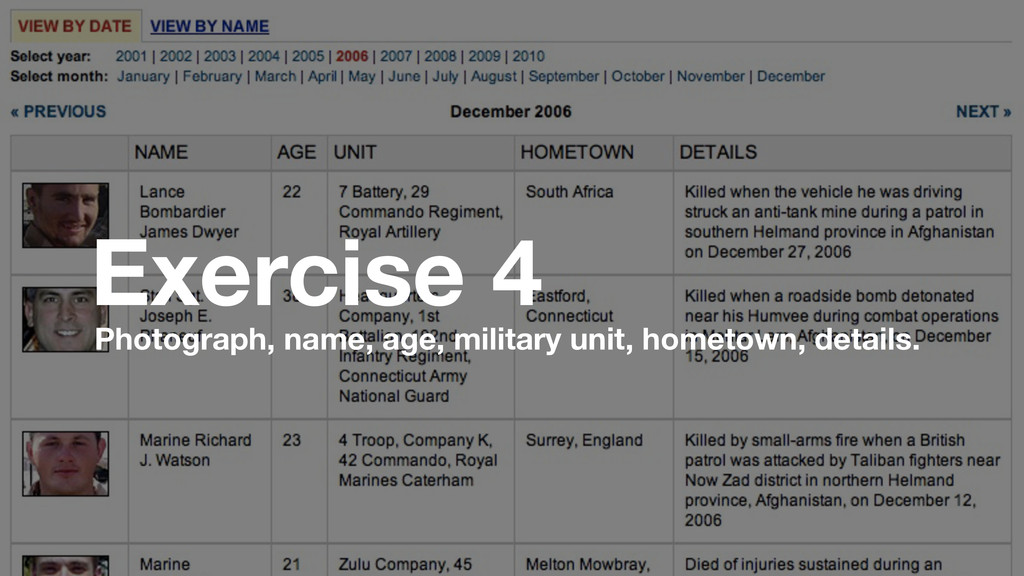
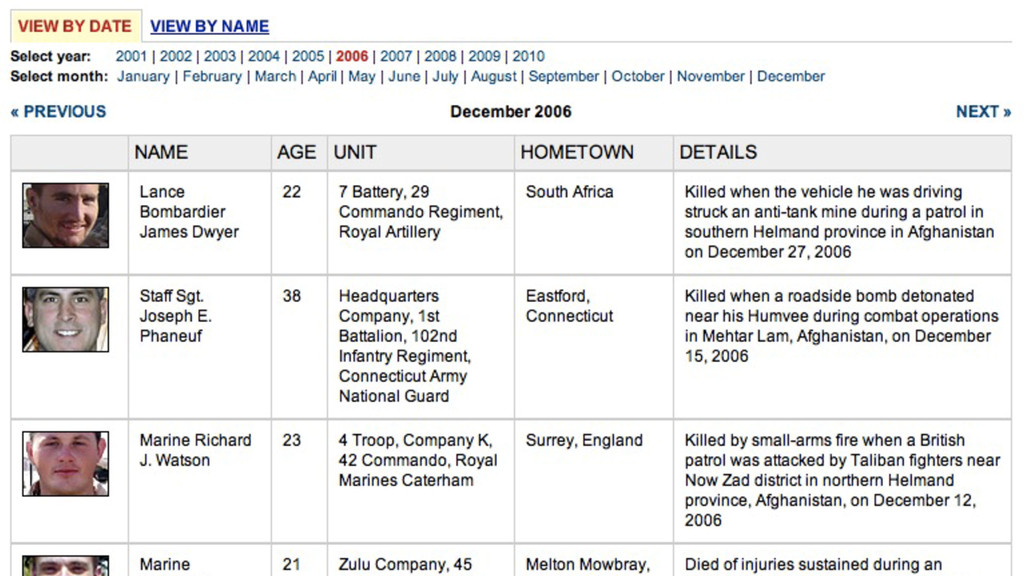
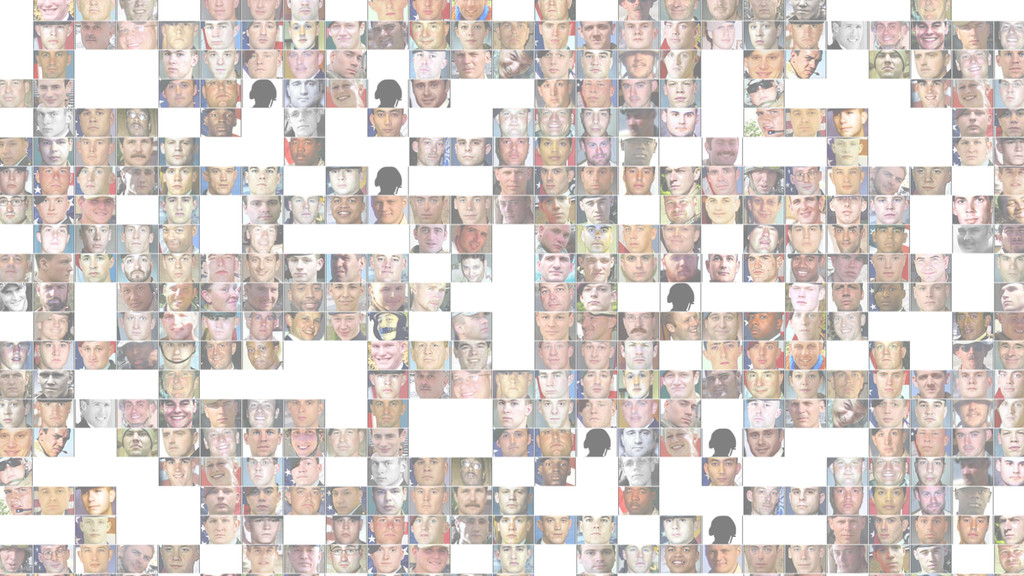
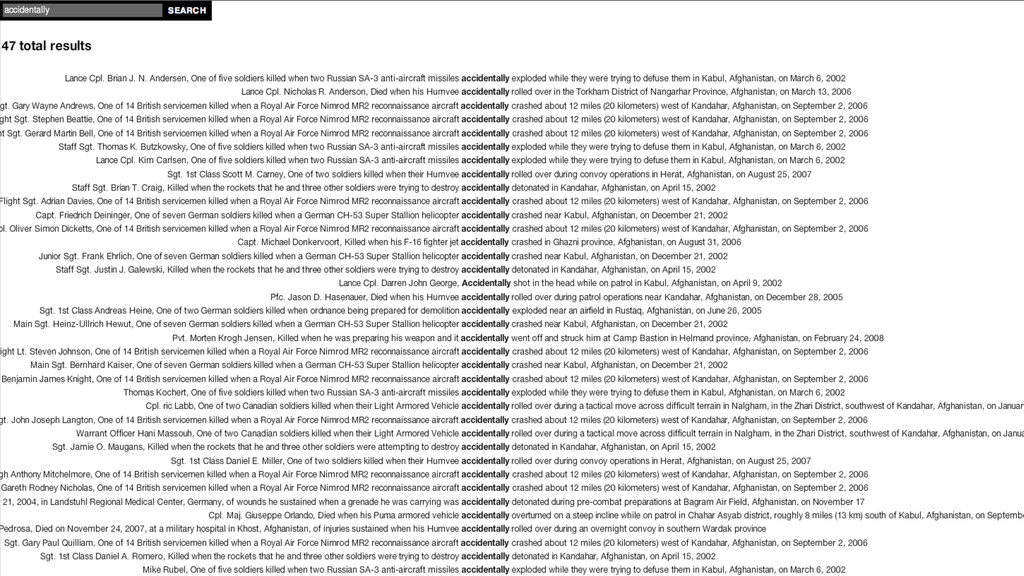
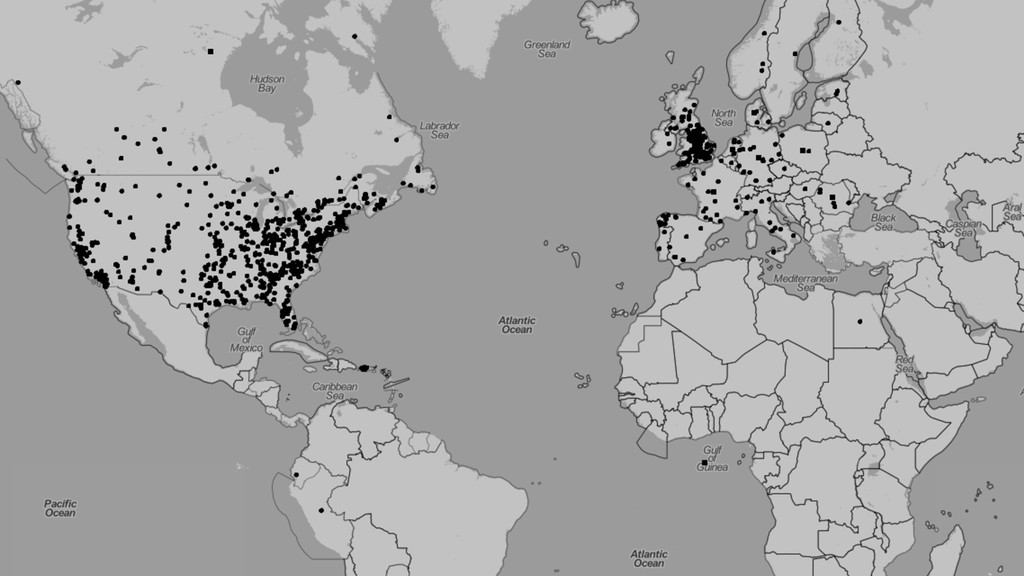
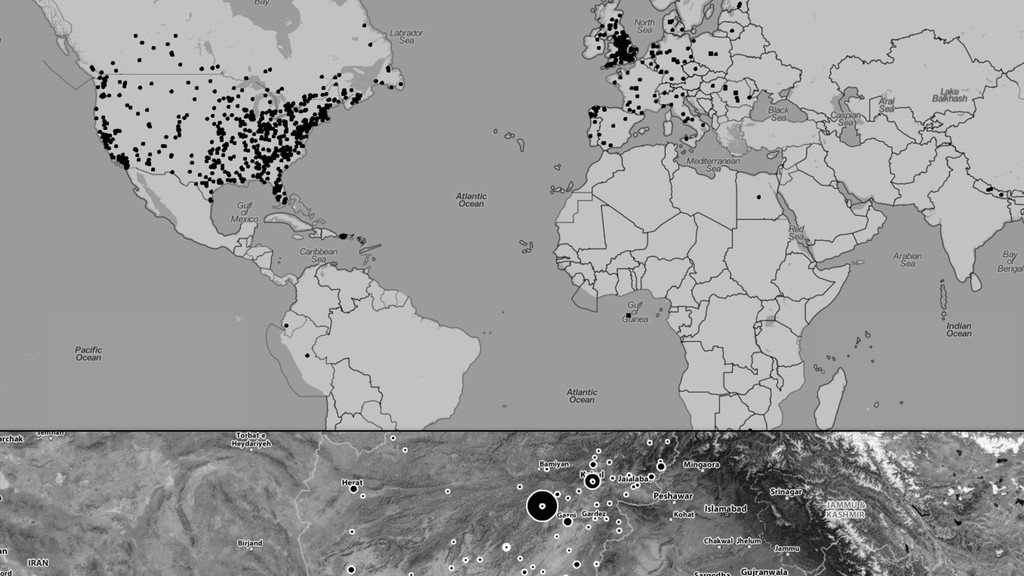
Photograph, name, age, military unit, hometown, details.
Exercise 4 Photograph, name, age, military unit, hometown, details.
None
None
Who were they?
None
How did they die?
None
Where were they from?
None
None
None
None
None
There is no one right answer.
What are you trying to communicate?
None
None
We’re so used to seeing emotionless, blurry images of rockets
exploding that we disconnect the image from the reality. These are images of death. Doug McCune
None
None
None
None
None
None
None
Animation and Interactivity.
None
None
None
None
None
None
None
Some helpful principles to keep in mind.
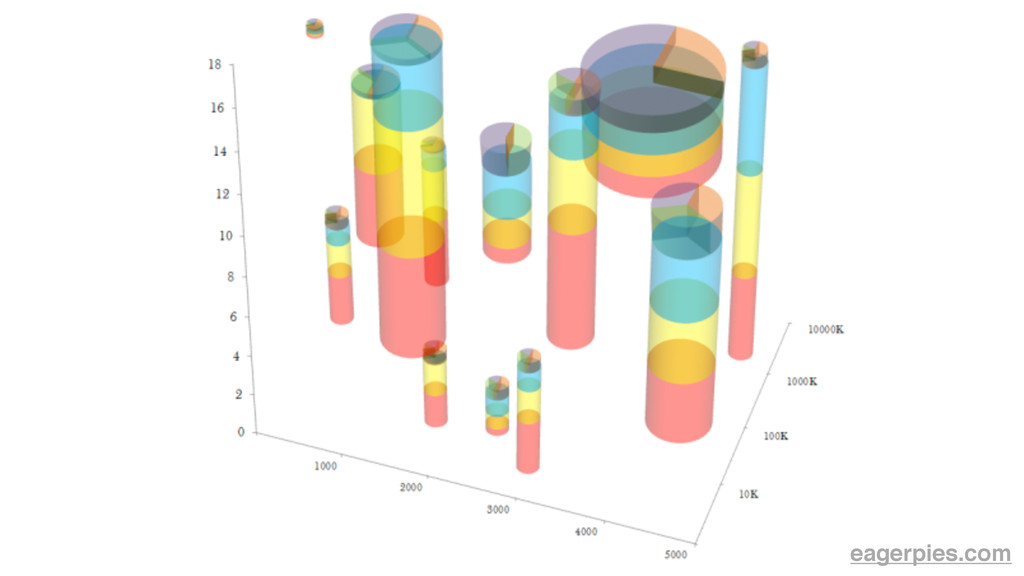
Don’t tackle too much. Complex encodings get confusing fast.
eagerpies.com
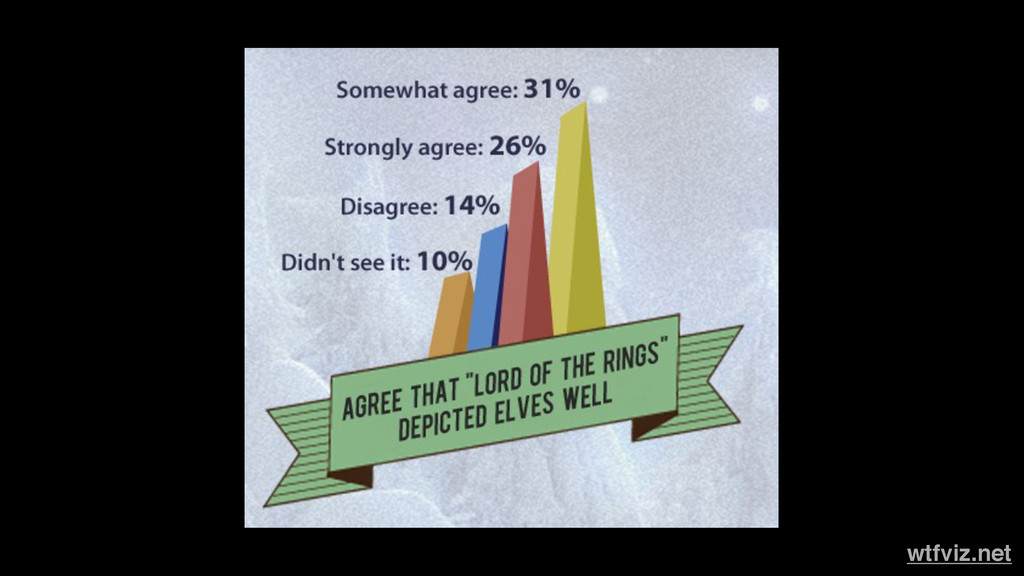
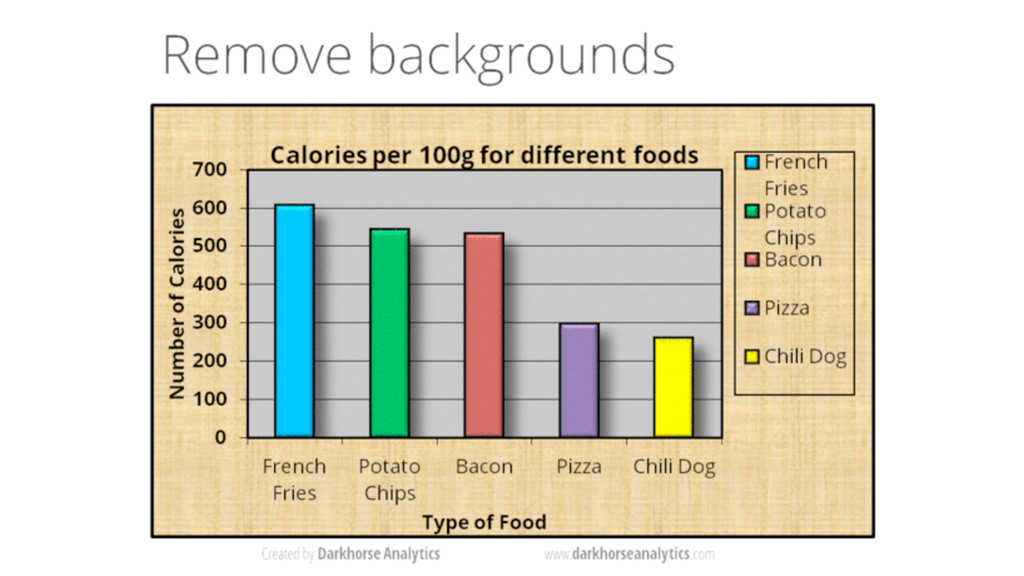
Remove clutter. Visual decoration is fun but distracting!
wtfviz.net
None
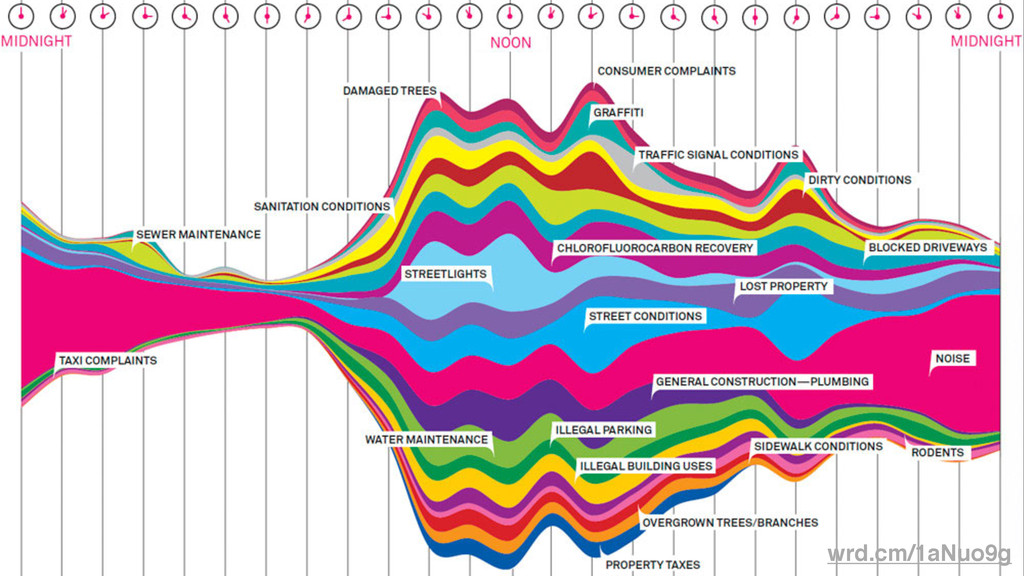
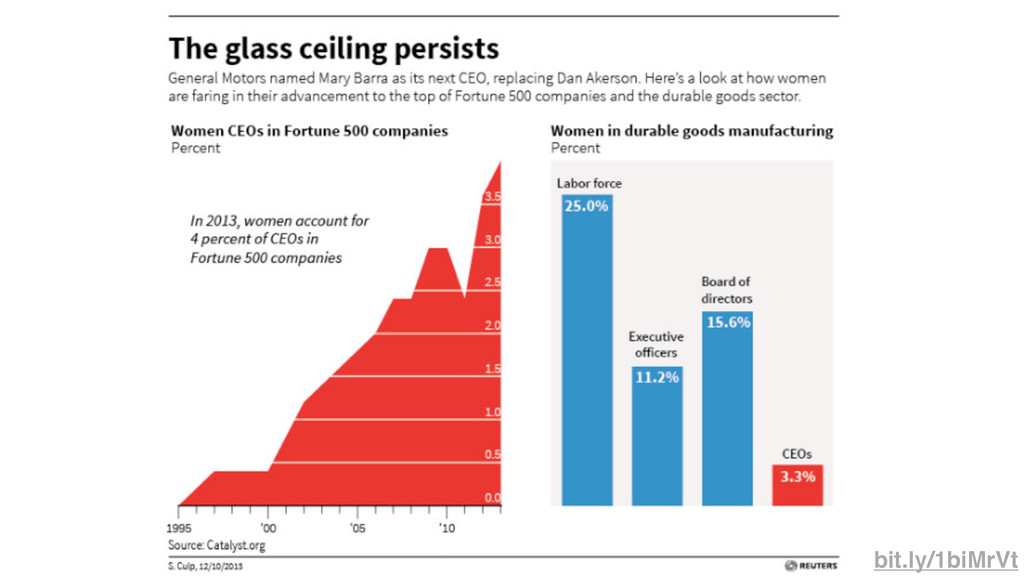
Labels and Axes Getting things right is not a weakness.
wrd.cm/1aNuo9g
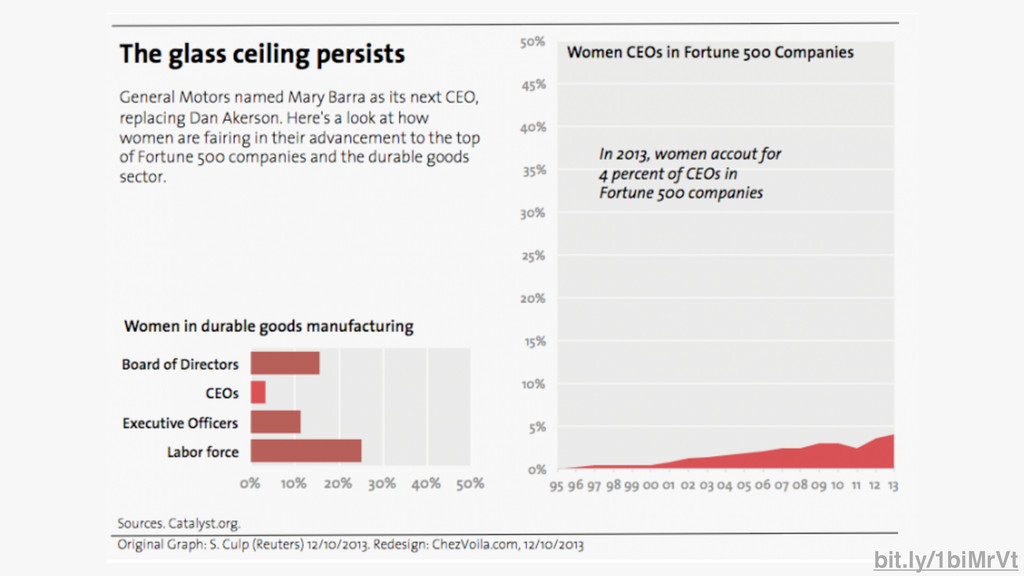
bit.ly/1biMrVt
bit.ly/1biMrVt
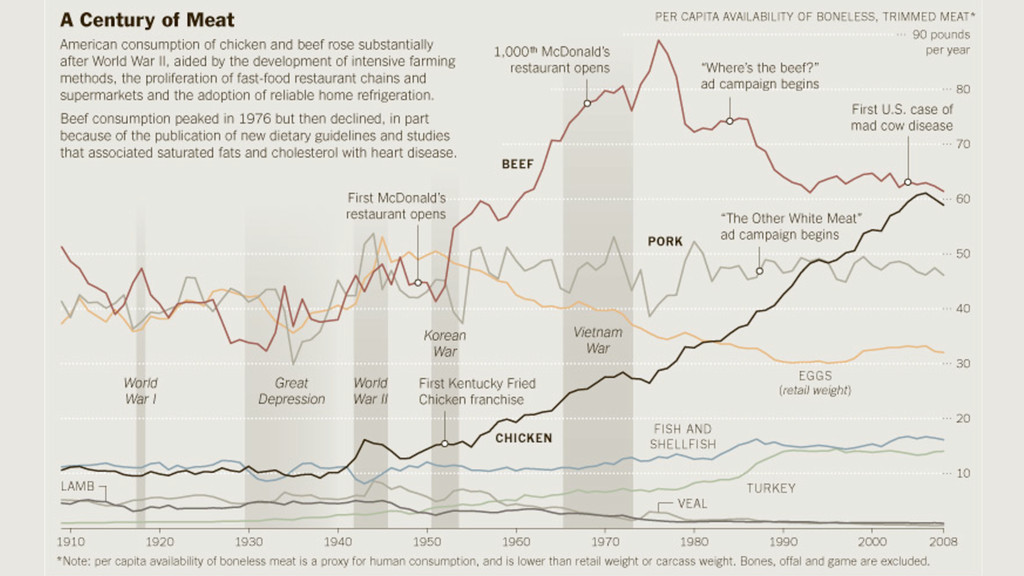
Give your data context. Don’t be afraid to add annotations
or drill down.
None
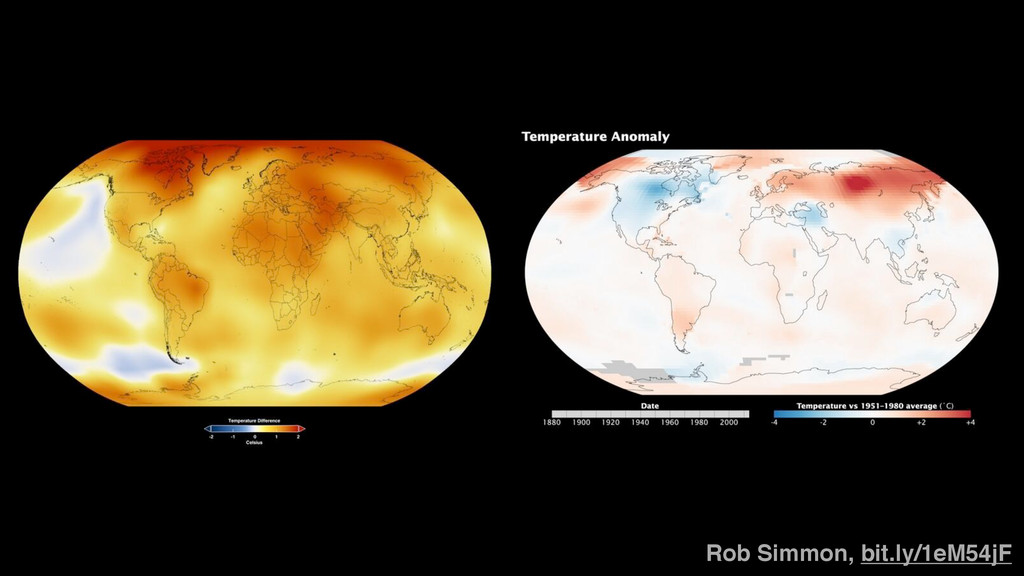
Use color smartly. Color in datavis is not just an
aesthetic decision.
Rob Simmon, bit.ly/1eM54jF
Cynthia Brewer, colorbrewer2.org, bl.ocks.org
Complex needs simple. Simple interfaces provide ways into complex data.
None
None
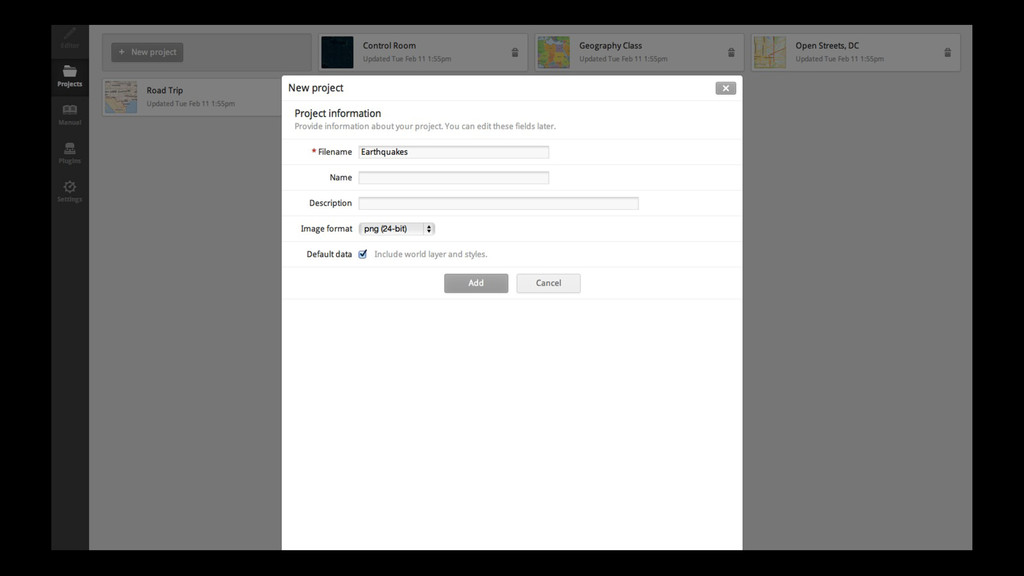
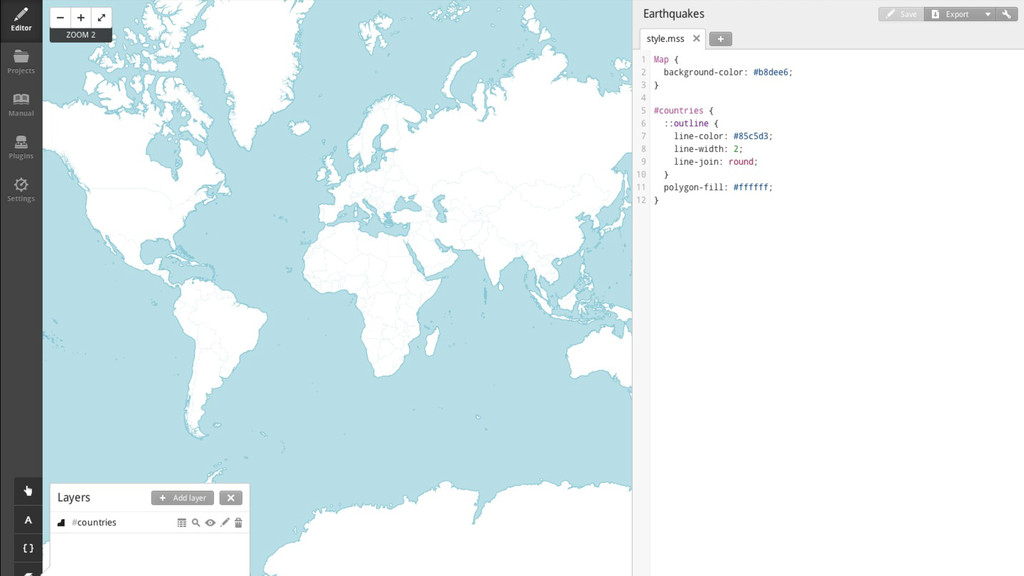
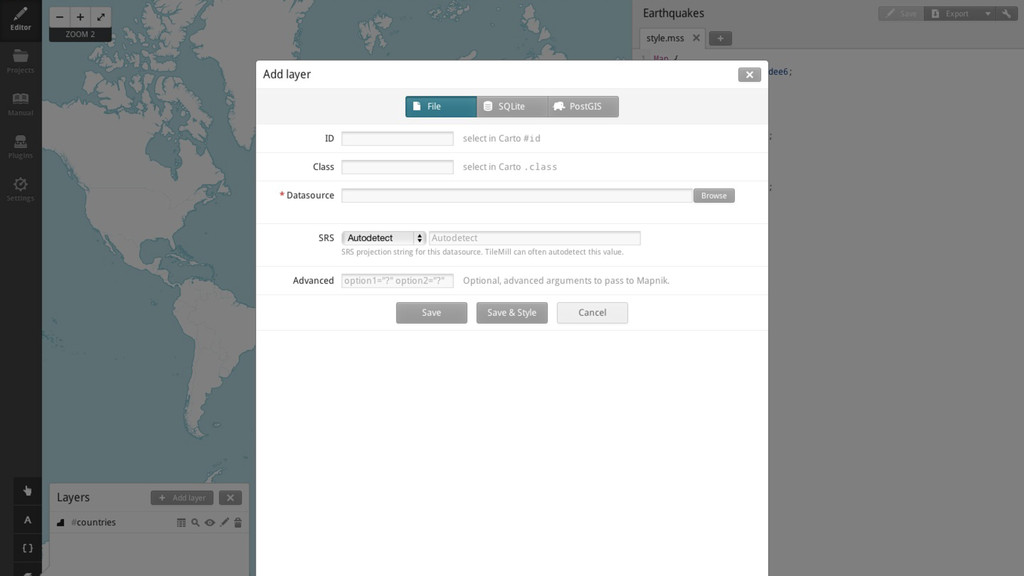
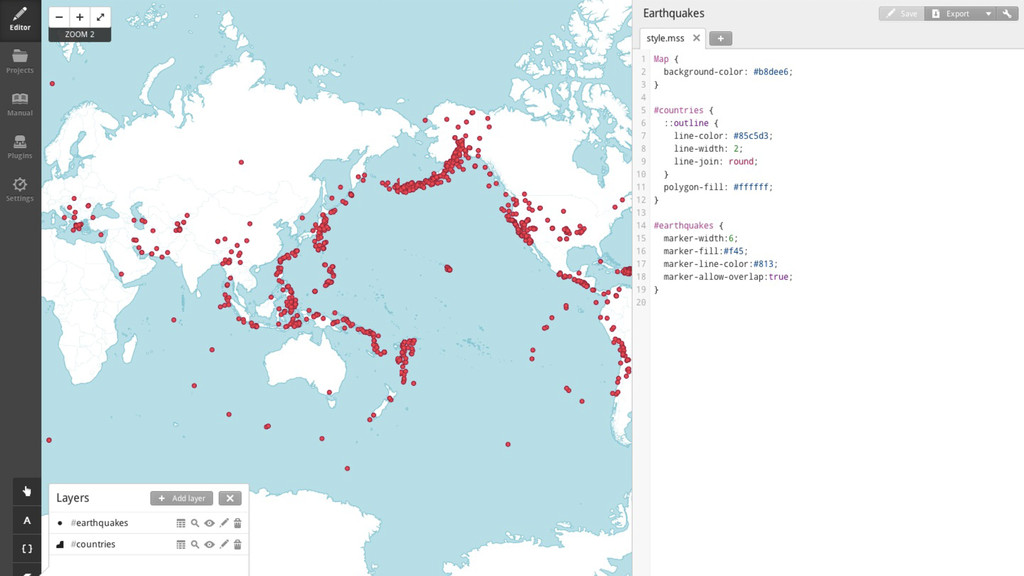
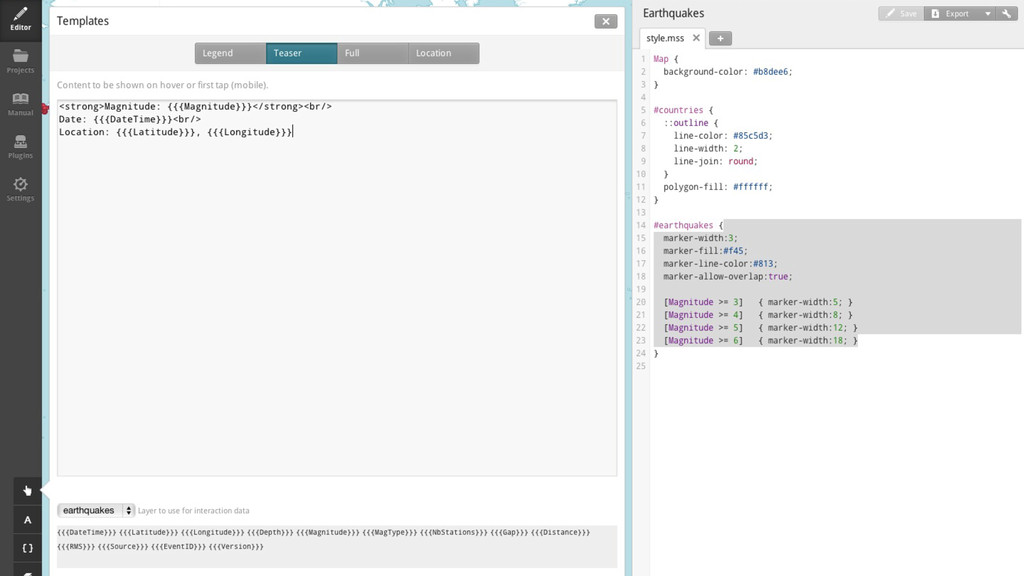
Tilemill demo! mapbox.com/tilemill
None
None
None
None
None
d3.js d3js.org
None
None
Tools and Resources
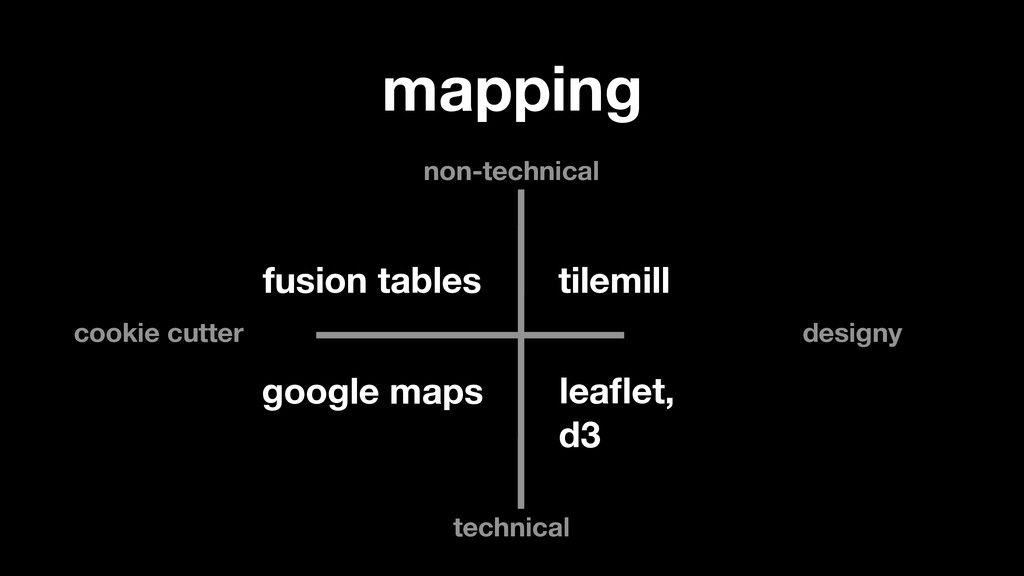
mapping designy cookie cutter non-technical technical tilemill leaflet, d3 fusion
tables google maps
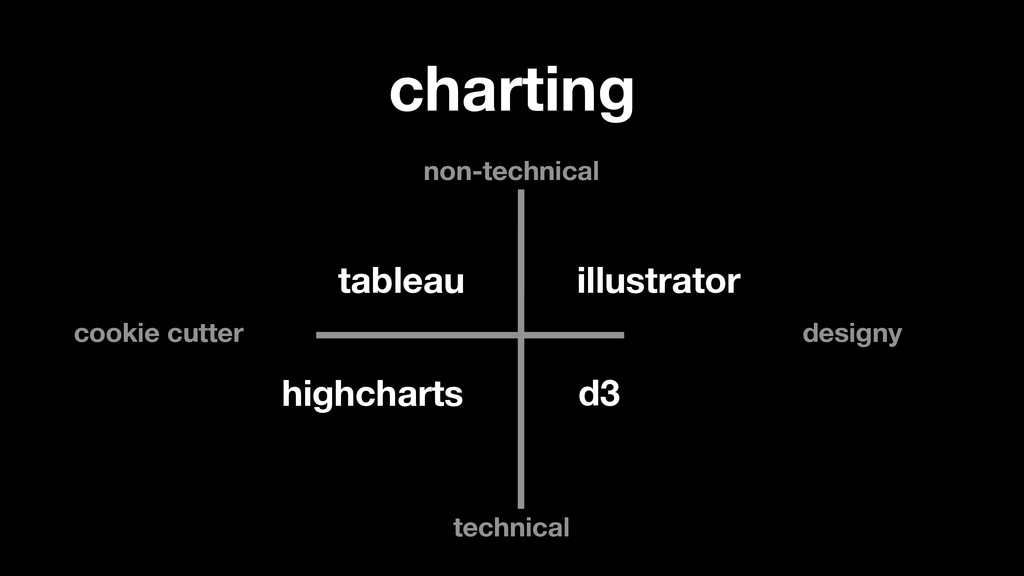
charting highcharts designy cookie cutter non-technical technical illustrator d3 tableau
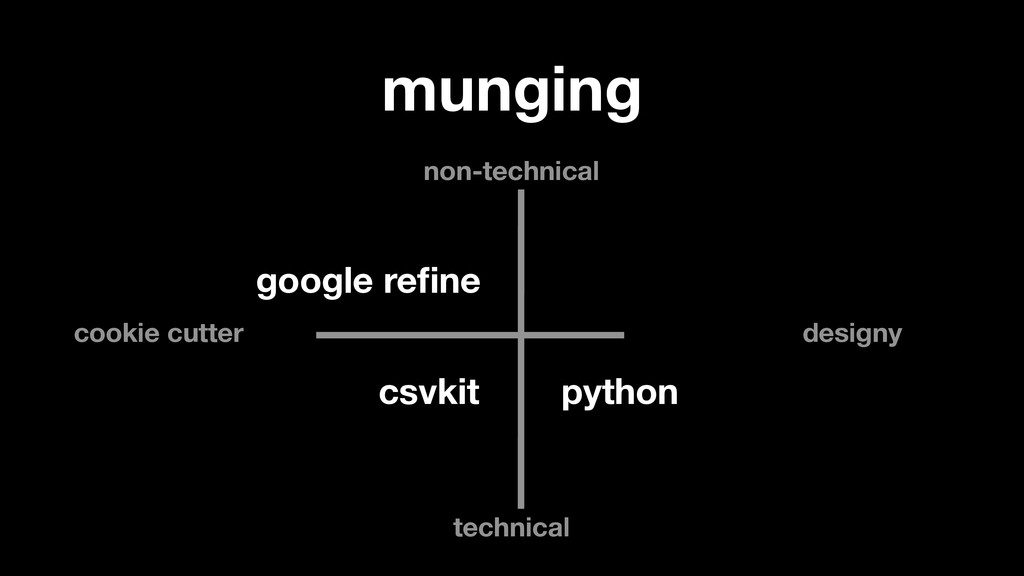
munging python designy cookie cutter non-technical technical google refine csvkit
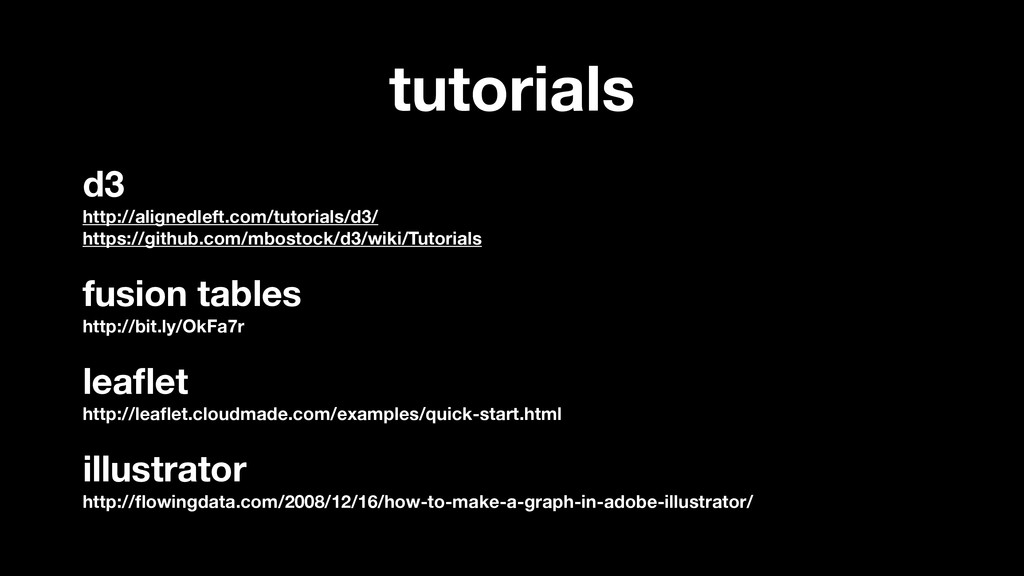
d3 http://alignedleft.com/tutorials/d3/ https://github.com/mbostock/d3/wiki/Tutorials fusion tables http://bit.ly/OkFa7r leaflet http://leaflet.cloudmade.com/examples/quick-start.html illustrator http://flowingdata.com/2008/12/16/how-to-make-a-graph-in-adobe-illustrator/
tutorials
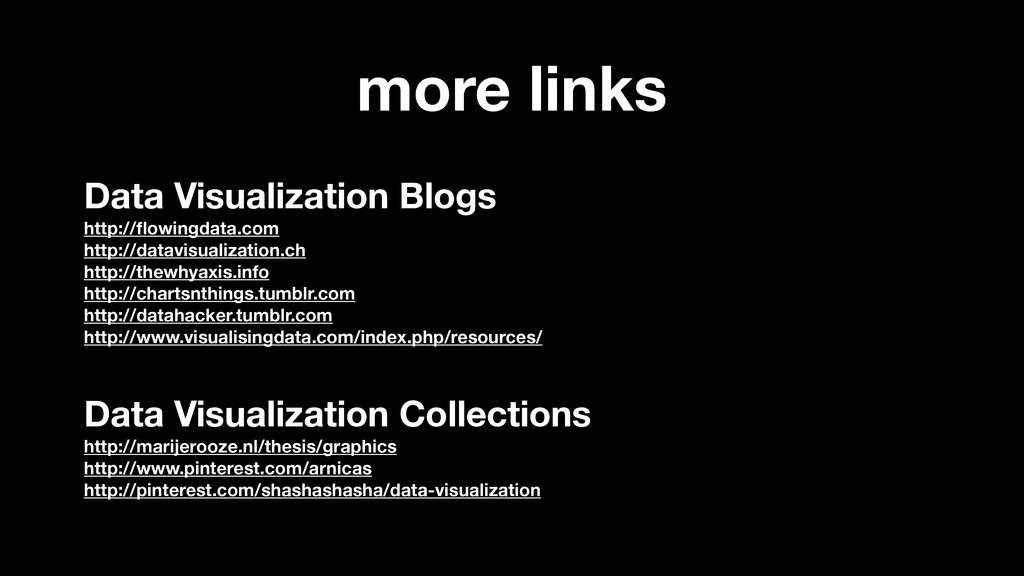
Data Visualization Blogs http://flowingdata.com http://datavisualization.ch http://thewhyaxis.info http://chartsnthings.tumblr.com http://datahacker.tumblr.com http://www.visualisingdata.com/index.php/resources/ Data
Visualization Collections http://marijerooze.nl/thesis/graphics http://www.pinterest.com/arnicas http://pinterest.com/shashashasha/data-visualization more links
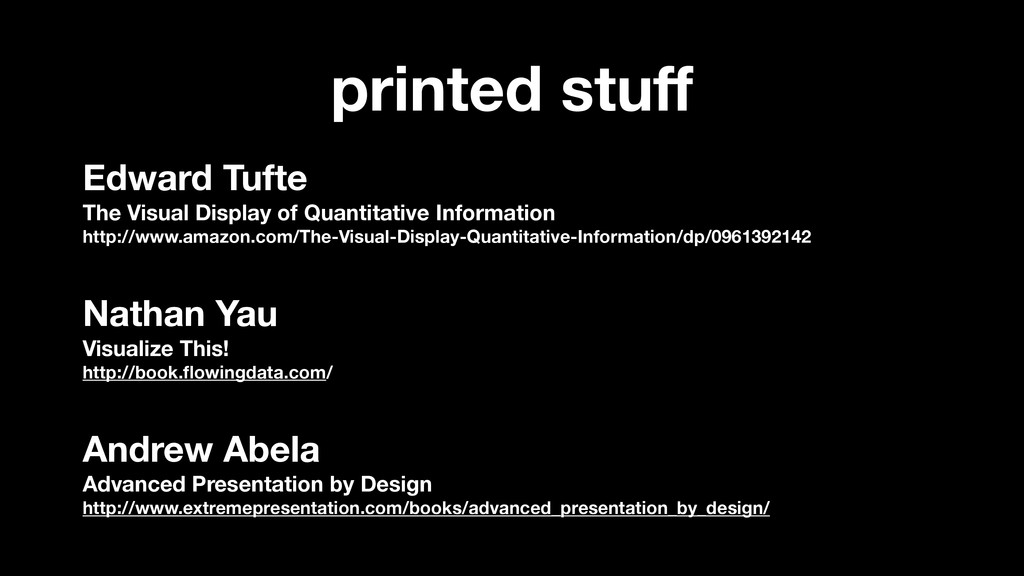
Edward Tufte The Visual Display of Quantitative Information http://www.amazon.com/The-Visual-Display-Quantitative-Information/dp/0961392142 Nathan
Yau Visualize This! http://book.flowingdata.com/ Andrew Abela Advanced Presentation by Design http://www.extremepresentation.com/books/advanced_presentation_by_design/ printed stuff
Sweet as.