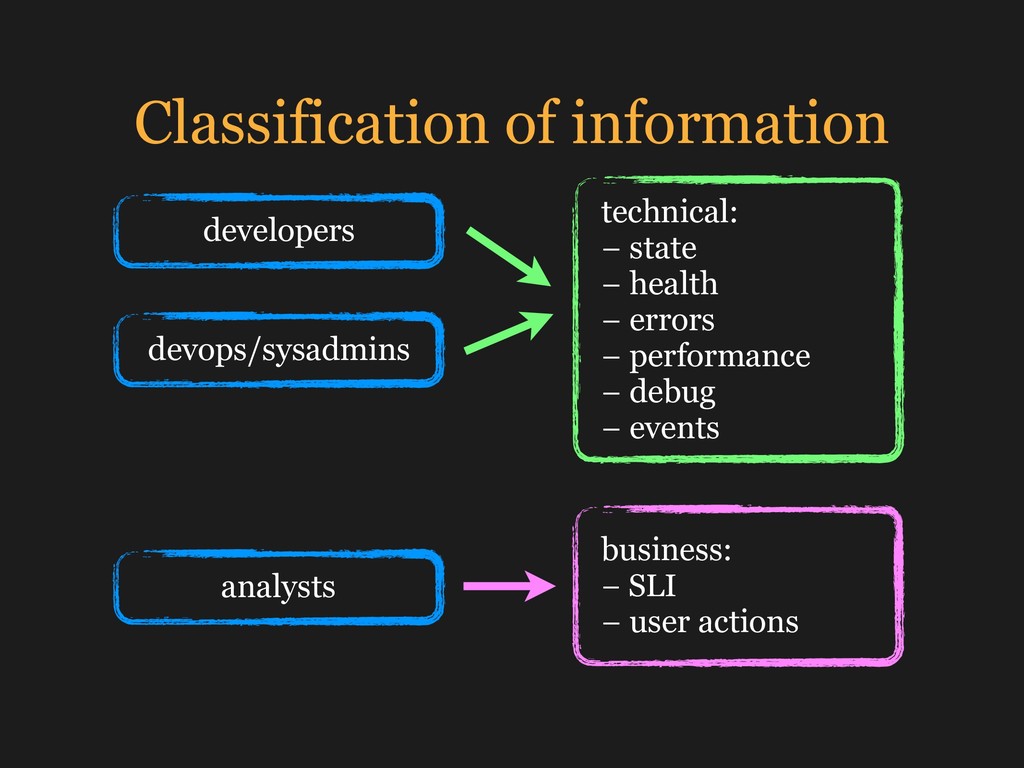
Most modern applications live in a close cooperation with each other. We will talk about the ways to effectively use the modern techniques for monitoring the health of applications and look on tasks and typical implementation mistakes through the eyes of an infrastructure engineer. And we will also consider the Ruby libraries that help to implement all of this.
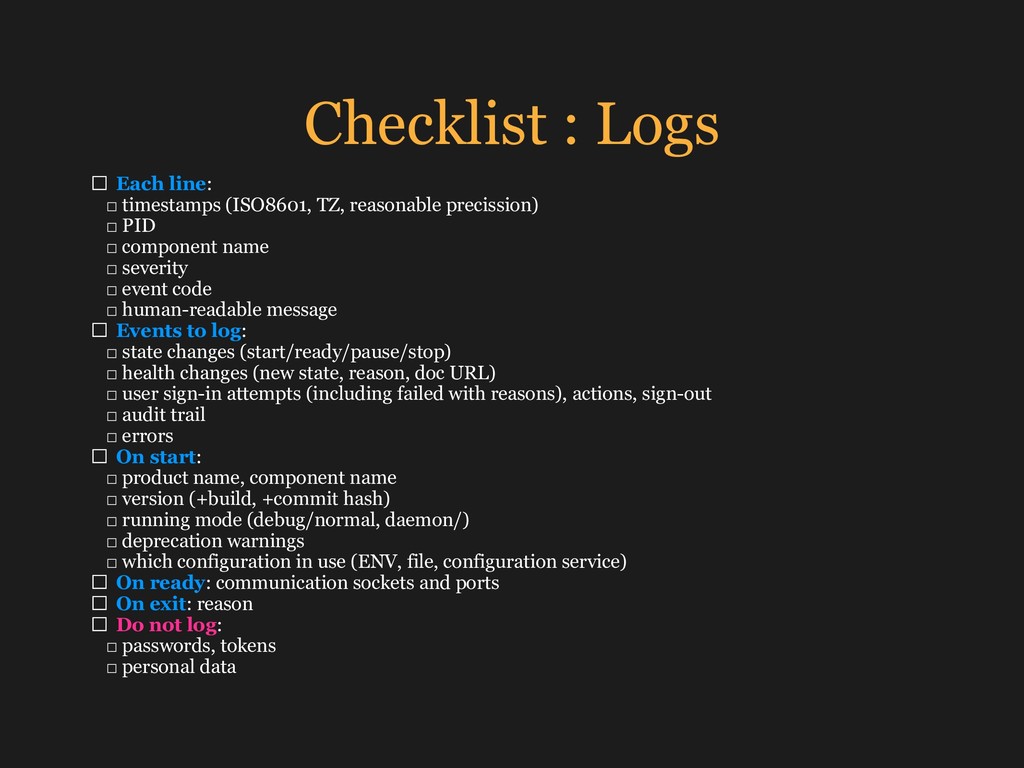
![Logs : bear in mind [1/3] • Logs will be](https://files.speakerdeck.com/presentations/132cc9ed944c4644b34ce38d75766e47/slide_37.jpg)
![Logs : bear in mind [2/3] • Whenever it possible,](https://files.speakerdeck.com/presentations/132cc9ed944c4644b34ce38d75766e47/slide_38.jpg)
![Logs : bear in mind [3/3] • Your application may](https://files.speakerdeck.com/presentations/132cc9ed944c4644b34ce38d75766e47/slide_39.jpg)
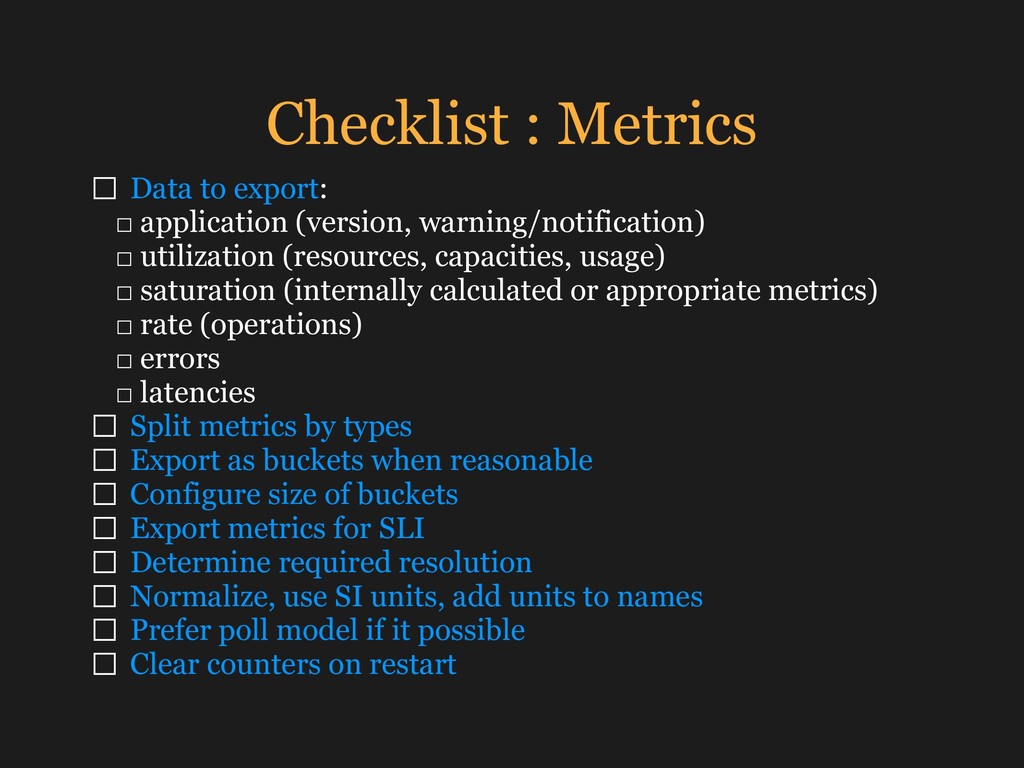
![Metrics : bear in mind [1/2] • Split statistic by](https://files.speakerdeck.com/presentations/132cc9ed944c4644b34ce38d75766e47/slide_60.jpg)
![Metrics : bear in mind [2/2] • Export appropriate metrics](https://files.speakerdeck.com/presentations/132cc9ed944c4644b34ce38d75766e47/slide_61.jpg)
![Links [1/2] • Dapper, a Large-Scale Distributed Systems Tracing Infrastructure](https://files.speakerdeck.com/presentations/132cc9ed944c4644b34ce38d75766e47/slide_75.jpg)
![Links [2/2] • CEF https://kc.mcafee.com/resources/sites/MCAFEE/content/live/ CORP_KNOWLEDGEBASE/78000/KB78712/en_US/ CEF_White_Paper_20100722.pdf • Metrics :](https://files.speakerdeck.com/presentations/132cc9ed944c4644b34ce38d75766e47/slide_76.jpg)