Upgrade to Pro — share decks privately, control downloads, hide ads and more …

Monitoring time in a distributed database: a play in three acts

Monitoring time in a distributed database: a play in three acts

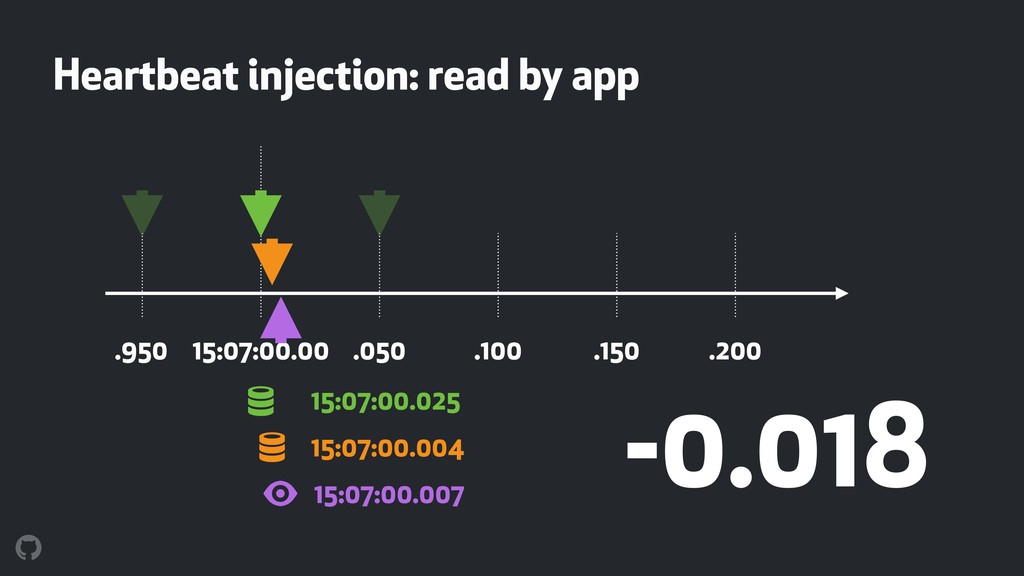
Monitoring time is tricky given its fluid nature. Doing so across distributed database hosts is trickier. Latency, probe intervals, clock synchronization, all affect the metrics, and taking actions based on those metrics makes matters even more complex. How does one measure time? What is the baseline? What accuracy and tradeoffs can we expect? Can we use time itself to affect the outcome? At GitHub, we monitor time in our database topologies for throttling and consistent reads purposes. We present our use case and our findings.

Shlomi Noach

May 14, 2019
Tweet

More Decks by Shlomi Noach

Other Decks in Technology

Transcript

  1. About me @github/database-infrastructure Author of orchestrator, gh-ost, freno, ccql and

    other open source tools. Blog at http://openark.org 
 github.com/shlomi-noach
 @ShlomiNoach
  2. GitHub
 Built for developers Largest open source hosting 100M+ repositories


    36M+ developers
 1B+ contributions Largest supplier of octocat T-Shirts and stickers
  3. Replication lag Desired behavior: smallest possible lag • Consistent reads

    (aka read your own writes) • Faster/lossless/less lossy failovers ! ! ! ! ! !
  4. Measuring lag via heartbeat Inject heartbeat on master Read replicated

    value on replica, compare with time now() ! ! ! ! ! !
  5. Inject and read Heartbeat generated locally on writer node !

    ! ! ! ! ! Inject Read & compare " Read & compare " Read & compare "
  6. create table heartbeat (
 anchor int unsigned not null,
 ts

    timestamp(6),
 primary key (anchor)
 ); Heartbeat ! ! ! ! ! !
  7. create table heartbeat (
 anchor int unsigned not null,
 ts

    timestamp(6),
 primary key (anchor)
 ); replace into heartbeat values (
 1, now(6)
 ); Heartbeat: inject on master ! ! ! ! ! !
  8. create table heartbeat (
 anchor int unsigned not null,
 ts

    timestamp(6),
 primary key (anchor)
 ); select 
 unix_timestamp(now(6)) - 
 unix_timestamp(ts) as lag 
 from 
 heartbeat
 where
 anchor = 1 Heartbeat: read on replica ! ! ! ! ! !
  9. Throttling Break large writes into small tasks Allow writes to

    take place if lag is low Hold off writes when lag is high Threshold: 1sec
  10. ! Heartbeat injection: read by app 15:07:00.00 .050 .100 .150

    .200 .950 ! 15:07:00.000 15:07:00.004 # 15:07:00.007 0.007
  11. ! Heartbeat injection: delayed app read 15:07:00.00 .050 .100 .150

    .200 .950 ! 15:07:00.000 15:07:00.004 # 15:07:00.047 0.047
  12. ! Heartbeat injection: delayed apply 15:07:00.00 .050 .100 .150 .200

    .950 ! 15:07:00.000 15:07:00.044 # 15:07:00.047 0.047
  13. Lag monitor service ! ! ! ! ! ! freno

    to monitor replication lag: • Polls all replicas at 50ms interval • Aggregates data per cluster at 25ms interval • https://githubengineering.com/mitigating-replication-lag-and-reducing-read-load-with-freno/ • https://github.com/github/freno
  14. ! Heartbeat injection: read by freno 15:07:00.00 .050 .100 .150

    .200 .950 ! 15:07:00.000 15:07:00.004 15:07:00.007 0.007
  15. ! Heartbeat injection: read by app 15:07:00.00 .050 .100 .150

    .200 .950 ! 15:07:00.000 15:07:00.004 15:07:00.007 0.007 # 15:07:00.009
  16. ! Heartbeat injection: delayed app read 15:07:00.00 .050 .100 .150

    .200 .950 ! 15:07:00.000 15:07:00.004 15:07:00.007 0.007 # 15:07:00.048
  17. ! Delayed app read, broken replica 15:07:00.00 .050 .100 .150

    .200 .950 ! 15:07:00.000 15:07:00.004 15:07:00.007 0.007 # 15:07:00.048 xx
  18. Actual safety margins: 50ms freno sampling interval 25ms freno aggregation

    interval Allow additional 25ms for “extra complications” Total 100ms
  19. Consistent read checks ! ! ! ! ! ! App

    asks freno: “I made a write 350ms ago. Are all replicas up to date?” Client auto-requires 100ms error margin We compare replication lag with 250ms write read " check
  20. Everything is terrible ! ! ! ! ! ! 100ms

    is where interesting stuff happens, and it’s within our error margin. write read " check
  21. Latency: consistent reads App close to writer node, far from

    replica ! ! ! ! ! ! write check lag "
  22. Latency: consistent reads App close to writer node, far from

    replica ! ! ! ! ! ! write check lag "
  23. ! Heartbeat injection: applied on skewed replica 15:07:00.00 .050 .100

    .150 .200 .950 ! 15:07:00.000 15:07:00.004 -> 15:06:59.994
  24. ! Heartbeat injection: read by app 15:07:00.00 .050 .100 .150

    .200 .950 ! 15:07:00.000 15:07:00.004 -> 15:06:59.994 # 15:07:00.007 -0.003
  25. ! Heartbeat injection: read by app 15:07:00.00 .050 .100 .150

    .200 .950 ! 15:07:00.025 15:07:00.004 # 15:07:00.007 -0.018
  26. GC

  27. VM

  28. MySQL: GTID Each transaction generates a GTID:
 00020192-1111-1111-1111-111111111111:830541 Each server

    keeps track of gtid_executed: all transactions ever executed:
 00020192-1111-1111-1111-111111111111:1-830541 SELECT GTID_SEUBSET(
 ‘00020192-1111-1111-1111-111111111111:830541’,
 @@gtid_executed
 );