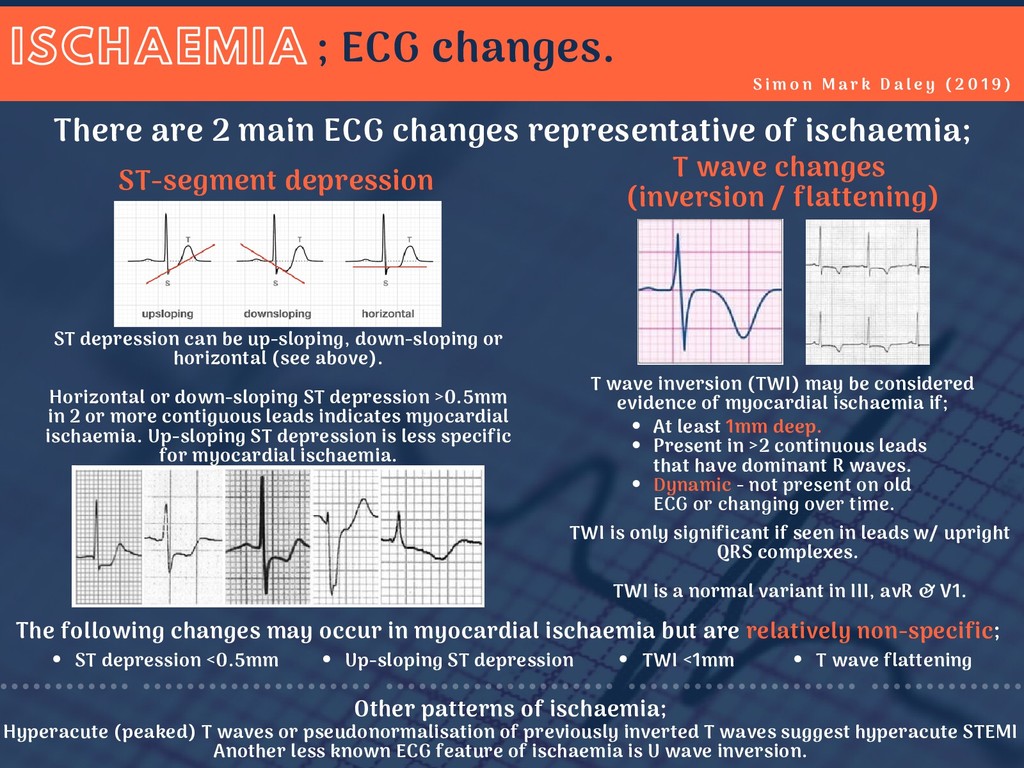
a l e y ( 2 0 1 9 ) ISCHAEMIA ; ECG changes. There are 2 main ECG changes representative of ischaemia; ST-segment depression T wave changes (inversion / flattening) ST depression can be up-sloping, down-sloping or horizontal (see above). Horizontal or down-sloping ST depression >0.5mm in 2 or more contiguous leads indicates myocardial ischaemia. Up-sloping ST depression is less specific for myocardial ischaemia. T wave inversion (TWI) may be considered evidence of myocardial ischaemia if; At least 1mm deep. Present in >2 continuous leads that have dominant R waves. Dynamic - not present on old ECG or changing over time. TWI is only significant if seen in leads w/ upright QRS complexes. TWI is a normal variant in III, avR & V1. The following changes may occur in myocardial ischaemia but are relatively non-specific; ST depression <0.5mm TWI <1mm T wave flattening Up-sloping ST depression Other patterns of ischaemia; Hyperacute (peaked) T waves or pseudonormalisation of previously inverted T waves suggest hyperacute STEMI Another less known ECG feature of ischaemia is U wave inversion.