Upgrade to Pro — share decks privately, control downloads, hide ads and more …

Vue and D3: A Chart Waiting To Happen

Vue and D3: A Chart Waiting To Happen

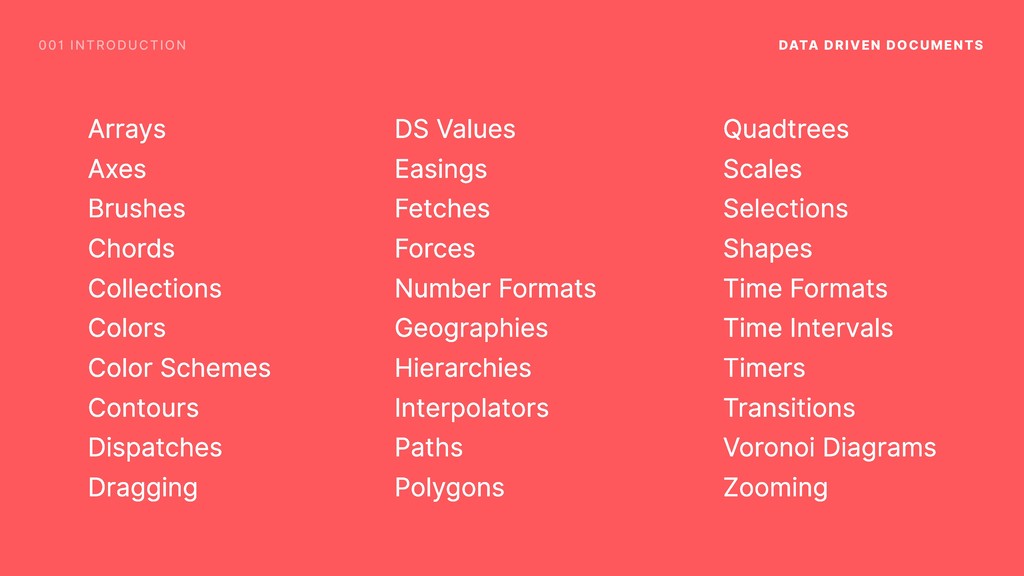
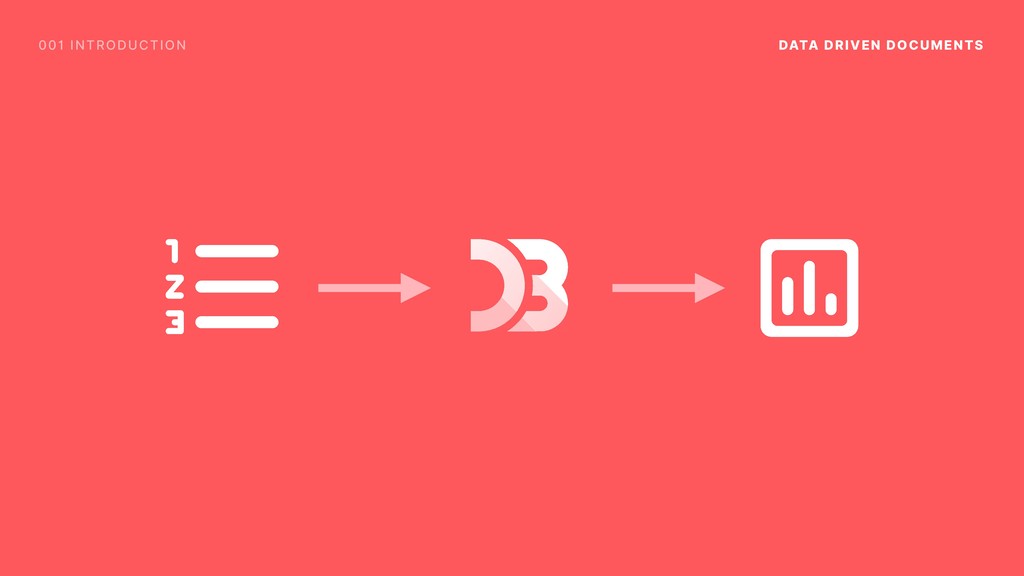
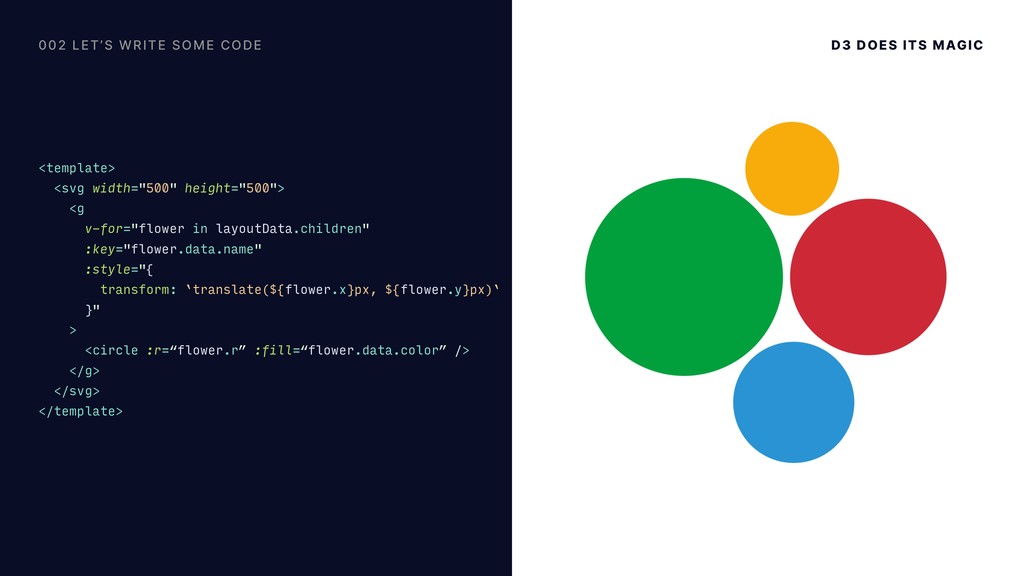
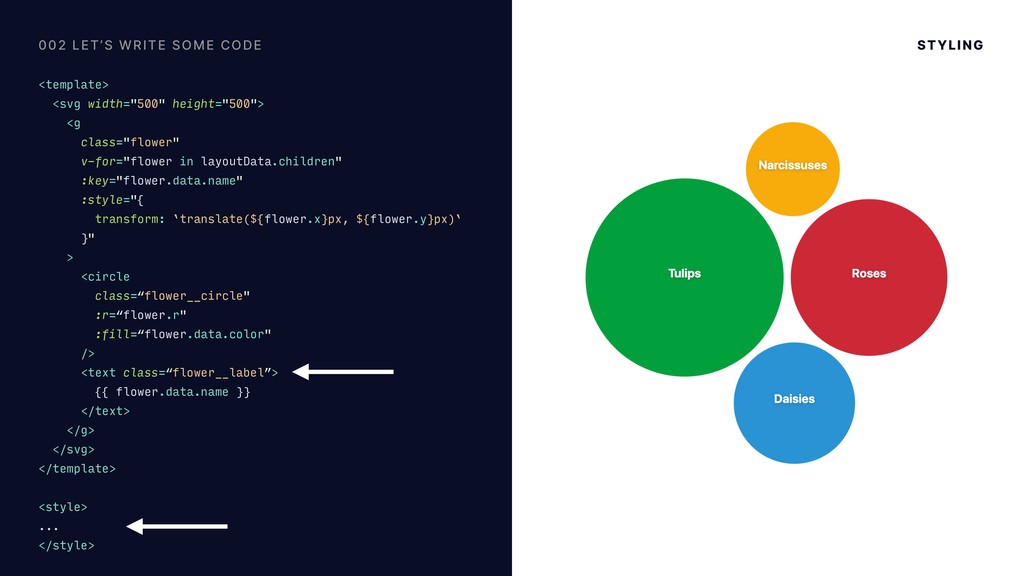
For a while now, D3.js has been the go-to JavaScript library for creating custom data visualizations. However, it's sometimes perceived as difficult to get started with or unsuitable for small projects. In this talk I will show you how combining D3 and Vue can make your quest for the perfect data visualization a whole lot easier.

Avatar for Simon Wuyts

Simon Wuyts

March 28, 2019
Tweet

Other Decks in Programming

Transcript

  1. 002 LET’S WRITE SOME CODE D3’S SYNTAX // Add a

    <g> element for every data point
 const leaf = svg.selectAll('g').data(circles) // Append a styled <circle> to every <g> element
 leaf
 .append('circle')
 .attr('id', d => d.data.id)
 .attr('r', d => d.r)
 .attr('fill-opacity', 0.7)
 .attr('fill', d => d.data.color)
  2. 002 LET’S WRITE SOME CODE BASE DATA const flowers =

    [ { name: 'Roses', amount: 25, color: '#cc2936' }, { name: 'Tulips', amount: 40, color: '#f2c640' }, { name: 'Daisies', amount: 15, color: '#2a93d4' }, { name: 'Narcissuses', amount: 9, color: '#F7AD0A' } ]
  3. 002 LET’S WRITE SOME CODE VUE COMPONENT <template>
 <svg width="500"

    height="500">
 We want those circles here.
 </svg>
 </template> <script>
 export default {
 data() {
 return {
 flowers: [
 ...
 ]
 }
 }
 }
 </script>
  4. 002 LET’S WRITE SOME CODE WORKFLOW 1. Render a circle

    for every flower 2. Size the circles 3. Give each circle the right color 4. Find the best position for each circle
  5. 002 LET’S WRITE SOME CODE WHAT D3 EXPECTS const formattedData

    = { name: 'Top Level', children: [ { name: 'Flower name', amount: amount, color: 'color', parent: 'Top Level' }, ... ] }
  6. 002 LET’S WRITE SOME CODE WHAT D3 EXPECTS transformedFlowerData() {

    return { name: 'Top Level', children: this.flowers.map(flower => ({ ...flower, parent: 'Top Level' })) } } const flowers = [ { name: 'Roses', amount: 25, color: '#cc2936' }, { name: 'Tulips', amount: 40, color: '#f2c640' }, { name: 'Daisies', amount: 15, color: '#2a93d4' }, { name: 'Narcissuses', amount: 9, color: '#F7AD0A' } ]
  7. 002 LET’S WRITE SOME CODE D3 DOES ITS MAGIC import

    { hierarchy, pack } from 'd3-hierarchy' layoutData() { // Generate a D3 hierarchy const rootHierarchy = hierarchy(this.transformedFlowerData) .sum(d => d.size) .sort((a, b) => { return b.value - a.value }) // Pack the circles inside the viewbox return pack() .size([500, 500]) .padding(10)(rootHierarchy) }
  8. 002 LET’S WRITE SOME CODE D3 DOES ITS MAGIC <template>

    <svg width="500" height="500"> <g v-for="flower in layoutData.children" :key="flower.data.name" :style="{ transform: `translate(${flower.x}px, ${flower.y}px)` }" > <circle :r=“flower.r” :fill=“flower.data.color” /> </g> </svg> </template>
  9. 002 LET’S WRITE SOME CODE STYLING <template> <svg width="500" height="500">

    <g class="flower" v-for="flower in layoutData.children" :key="flower.data.name" :style="{ transform: `translate(${flower.x}px, ${flower.y}px)` }" > <circle class=“flower__circle" :r=“flower.r" :fill=“flower.data.color" /> <text class=“flower__label”> {{ flower.data.name }} </text> </g> </svg> </template> <style> ... </style>
  10. 002 LET’S WRITE SOME CODE SMOOTH TRANSITIONS .flower { transition:

    transform 0.1s ease-in-out; } .flower__circle { transition: r 0.1s ease-in-out; }
  11. 003 CONCLUSION CAVEATS 1. Performance with big data sets 2.

    Not better for every kind of chart 3. Some features of D3 are 
 harder to integrate
  12. 003 CONCLUSION QUICK WINS 1. Your code stays close to

    the result 2. Experimenting is easy and fast 3. Your code blends nicely with Vue.js code 4. Your code is approachable 5. The web is just the start