Upgrade to Pro — share decks privately, control downloads, hide ads and more …

BSDMIZER: a framework to improve FreeBSD continuously

Skymizer
August 06, 2017

BSDMIZER: a framework to improve FreeBSD continuously

How to improve your FreeBSD? Let Luba share with you. You may also attend BSDTW 17 to learn more.

Skymizer

August 06, 2017
Tweet

More Decks by Skymizer

Other Decks in Programming

Transcript

  1. GCC nGCC Compiler Collection ⎼ Supports more than 30+ targets

    ⎼ Supports 8 languages ⎼ There are more then 250+ optimization passes ⎼ Maintain by three different groups - GCC, binutil and glibc Source code Executable binary gcc ld ld.bfd ld.gold libraries C runtime Linking script external files cpp Preprocessor cc1 Compiler as Assembler collect2 GCC binutils glibc
  2. Compiler optimization 是被低估的 nGCC has more than 300+ general optimization

    passes ⎼ 280+ target independent optimization passes ⎼ About 20+ target dependent optimization pass nPeople use only half of these optimization passes ⎼ ~40 optimization passes are enable in O1 ⎼ ~40 optimization passes are enable in O2 ⎼ ~10 optimization passes are enable in O3 3
  3. 即使是有名的優化其實都很罕⽤ n你以為每個 Open source project 都知道要下 O3 嗎? ⎼ 更別說是

    LTO 或 PGO 了 n約有半數的 Open source project 的 Makefile 存在問題 ⎼ CMake 不會將上一次的設定清空,而 ubuntu/CentOS porter 不見得會發現 這件事 ⎼ 沒有正確傳遞參數的 Makefile 非常常見 n為了加一個參數,而修改 Makefile ⎼ 你⼀定時間很多
  4. replayer Evaluate - 幫你啟動各種優化 n偷偷攔截所有傳遞給工具的參數,並且修改他 ⎼ replayer (burglar) - intercept

    the control to original tool. Modify the options to the original tool ⎼ evaluate (hobbit) - controller of replayer original tool evaluate control revised command intercept original tool command
  5. Enable LTO and PGO nLTO - link-time optimization $ sudo

    evaluate -tool `which ar` -mark \ --plugin=$(gcc --print-file-name=liblto_plugin.so) $ sudo evaluate -tool `which gcc` -mark -flto nPGO - Performance Guide Optimization $ sudo evaluate -tool `which gcc` -mark -fprofile-generate=./data $ sudo evaluate -tool `which gcc` -mark -fprofile-use=./data \ -fprofile-correction build your project then run it once
  6. Shxt! 我的 MySQL 噴出來了! nWe only enable PGO and LTO

    then get ~10% improvement ⎼ Both InnoDB and MyISAM get improvement ⎼ Not only read, but also write ⎼ resolve Bug #67790 read-9999-50 mixed-499-50 InnoDB 112.62% 113.46% MyISAM 112.72% 100.62% 0.94 0.96 0.98 1 1.02 1.04 1.06 1.08 1.1 1.12 1.14 1.16 InnoDB MyISAM
  7. Iterative Compiler n尋找最佳的編譯器參數 n平均優化程度為 35% Source code Compiler Static Analysis

    Final Binary Temp. Binary Profiling/Simulation Characterization Deep Learning Signature Analysis Feedback Testing Quality Analysis
  8. BSDMizer n針對 FreeBSD,進行優化 ⎼ 目前已經優化了 msun (數學函式庫) 與 bzip2 n世界最先進的

    Iterative Compiler,整合了下列大招 ⎼ 高速運算 (high performance computing), ⎼ Iterative Compiler, ⎼ 機器學習, and ⎼Github
  9. 為什麼 BSDMizer 有用 n說真的,我也不知道。從結果論,我只知道效能就噴出來 了 n我們發展了一系列方式來研究為什麼 BSDMizer 有用 1.Profile the

    optimal application and baseline application 2.Re-compile the optimal application and baseline application to find the optimization statistics 3.Remove compiler flags one-by-one to ensure the effect of each compiler optimization
  10. 其實課本教的 80/20 是騙人的 17 libGLESv2_adreno.s o 23.39% key component run-time

    GPU drivers 23.39% 3rd party libraries 27.28% [kernel.kallsyms] 17.45% Bionic C 7.85% Frameworks 24.23%
  11. `perf/gprof/valgrind` 很不幸的,沒什麼用途 n6000 functions occupy 80% computations nOnly few functions

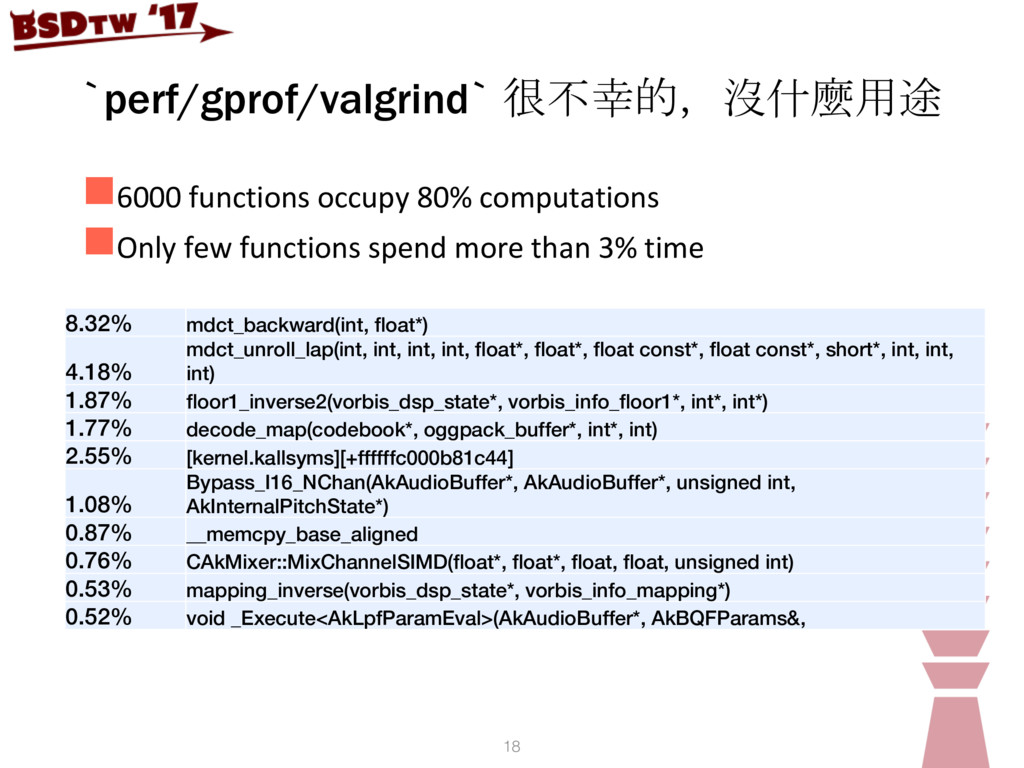
    spend more than 3% time 18 8.32% mdct_backward(int, float*) 4.18% mdct_unroll_lap(int, int, int, int, float*, float*, float const*, float const*, short*, int, int, int) 1.87% floor1_inverse2(vorbis_dsp_state*, vorbis_info_floor1*, int*, int*) 1.77% decode_map(codebook*, oggpack_buffer*, int*, int) 2.55% [kernel.kallsyms][+ffffffc000b81c44] 1.08% Bypass_I16_NChan(AkAudioBuffer*, AkAudioBuffer*, unsigned int, AkInternalPitchState*) 0.87% __memcpy_base_aligned 0.76% CAkMixer::MixChannelSIMD(float*, float*, float, float, unsigned int) 0.53% mapping_inverse(vorbis_dsp_state*, vorbis_info_mapping*) 0.52% void _Execute<AkLpfParamEval>(AkAudioBuffer*, AkBQFParams&,
  12. 其實是因為 Architecture 課本沒讀通 ninstruction-per-cycles 可以表達出一個系統的真實狀況 ⎼ perf 有給你 instruction,也有給你 cycles

    ⎼ 你只是要自己算出 IPC 19 IPC Energy DL1 IL1 L2 bpred source: Timothy Sherwood et al., “Automatically Characterizing Large Scale Program Behavior”, 2002
  13. 其他課本沒教,但是有用的訊息 n平均的 basic block size ⎼ instructions / branches ⎼

    正常來說,此數值約為 13 ⎼ 通常出問題的程式,此數值會低到 5 以下 ⎼ 這可以用來判斷是否是 jump table 的問題 ncache reference : Instruction ⎼ 每多少個指令會撞到一次記憶體 ⎼ 正常來說,應該是 1:20 ⎼ 這可以用來判斷是否卡在 pipeline 的 ROB flush
  14. 其他課本沒教,但是有用的訊息 n平均的 basic block size ⎼ instructions / branches ⎼

    正常來說,此數值約為 13 ⎼ 通常出問題的程式,此數值會低到 5 以下 ⎼ 這可以用來判斷是否是 jump table 的問題 ncache reference : Instruction ⎼ 每多少個指令會撞到一次記憶體 ⎼ 正常來說,應該是 1:20 ⎼ 這可以用來判斷是否卡在 pipeline 的 ROB flush
  15. 利用 Valgrind 大幅減少需要研究的 function nValgrind 不是只能拿來看 memory leakage,他還可以拿來算 BBV (basic

    block vector) nBBV 可以用來 grouping IPC 相似的 function n如果你的平台沒有 Valgrind,那就只好單看 IPC 變化
  16. 為什麼 Redis 可以噴出 25% 快? n表面上是因為啟動 Profile-guide-optimization ++ LTO n但中間過程是因為

    ⎼ 因為 LTO,所以少部分程式碼在 front-end 被搬移 ⎼ 導致於 jump-threaded 的結果多了眾多的分支 ⎼ 眾多的分支導致於 variable range propagation 可以針對不 同的分支進行常數傳遞 ⎼ interprocedural optimization 發現了有些分支可以獨立出 來建立 clone function ⎼ clone function 做了 inline 之後又多了一些無用的指令 ⎼ 指令被砍砍砍 ⎼ 效能就噴出來了
  17. 為什麼 Redis 可以噴出 25% 快? n表面上是因為啟動 Profile-guide-optimization ++ LTO n但中間過程是因為

    ⎼ 因為 LTO,所以少部分程式碼在 front-end 被搬移 ⎼ 導致於 jump-threaded 的結果多了眾多的分支 ⎼ 眾多的分支導致於 variable range propagation 可以針對不 同的分支進行常數傳遞 ⎼ interprocedural optimization 發現了有些分支可以獨立出 來建立 clone function ⎼ clone function 做了 inline 之後又多了一些無用的指令 ⎼ 指令被砍砍砍 ⎼ 效能就噴出來了