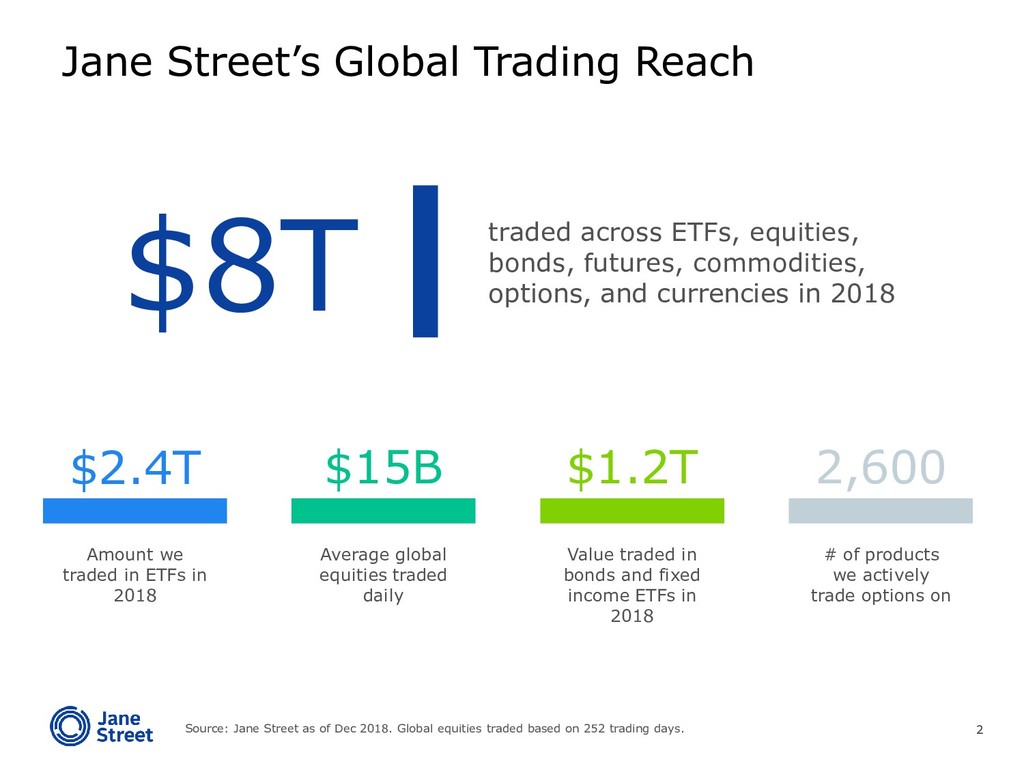
2,600 Amount we traded in ETFs in 2018 Average global equities traded daily Value traded in bonds and fixed income ETFs in 2018 # of products we actively trade options on $8T traded across ETFs, equities, bonds, futures, commodities, options, and currencies in 2018 Source: Jane Street as of Dec 2018. Global equities traded based on 252 trading days.
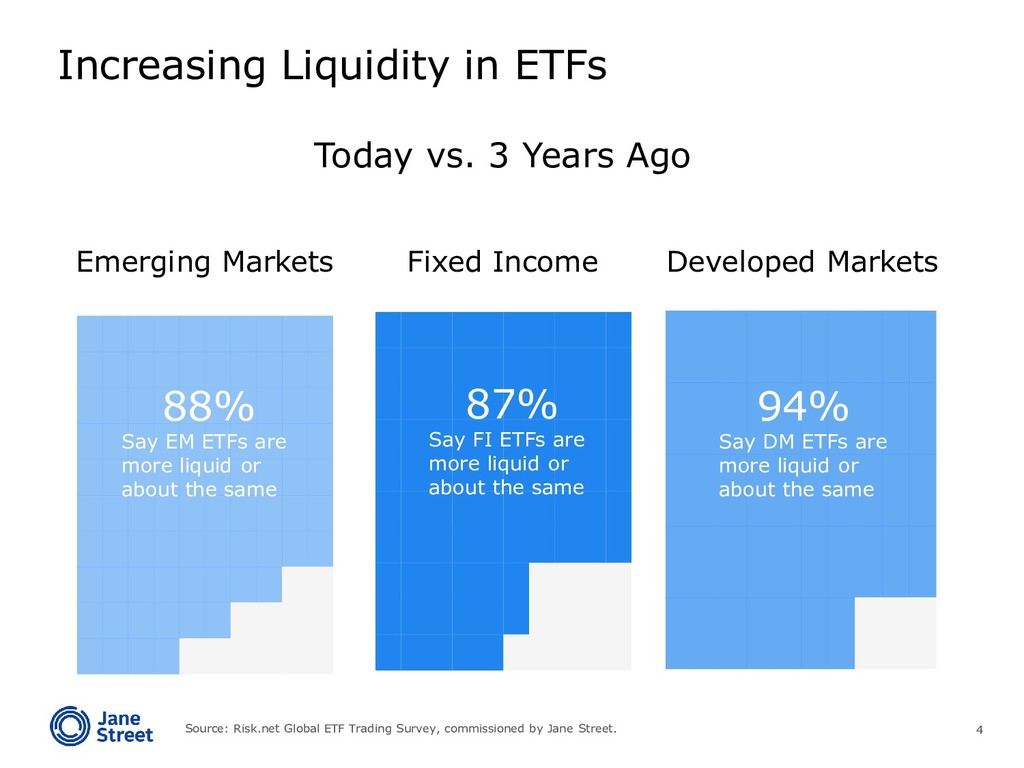
ETFs are more liquid or about the same 87% Say FI ETFs are more liquid or about the same 94% Say DM ETFs are more liquid or about the same Source: Risk.net Global ETF Trading Survey, commissioned by Jane Street. Increasing Liquidity in ETFs Today vs. 3 Years Ago
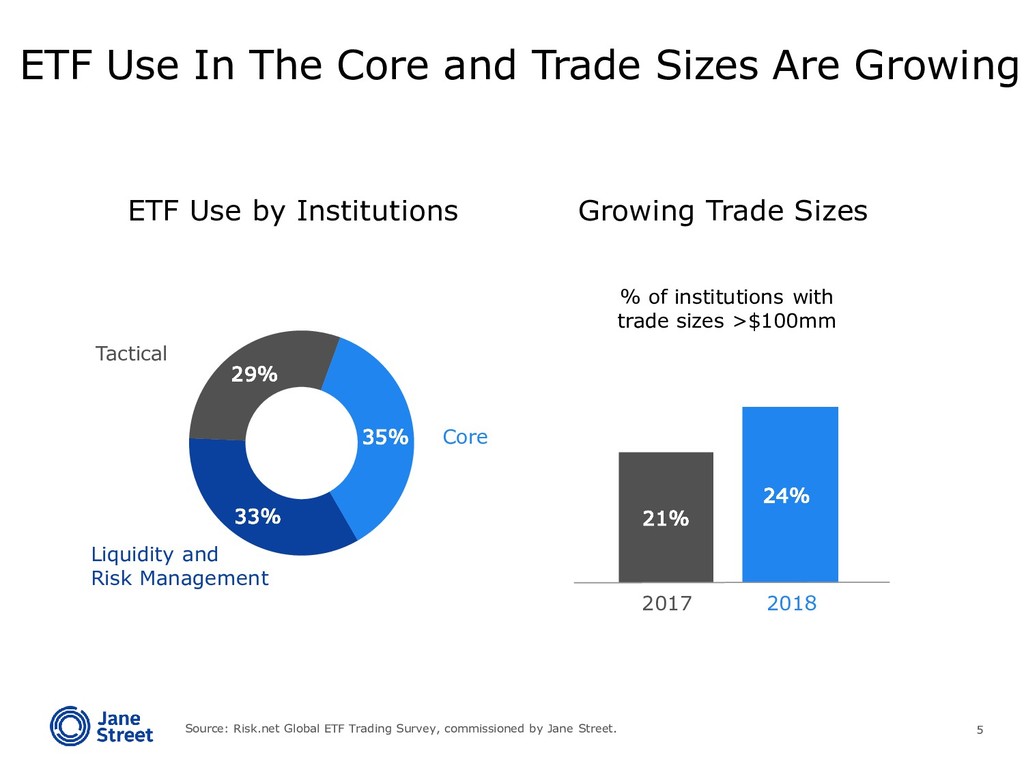
ETF Use by Institutions 21% 24% % of institutions with trade sizes >$100mm 2017 2018 Growing Trade Sizes Source: Risk.net Global ETF Trading Survey, commissioned by Jane Street. ETF Use In The Core and Trade Sizes Are Growing
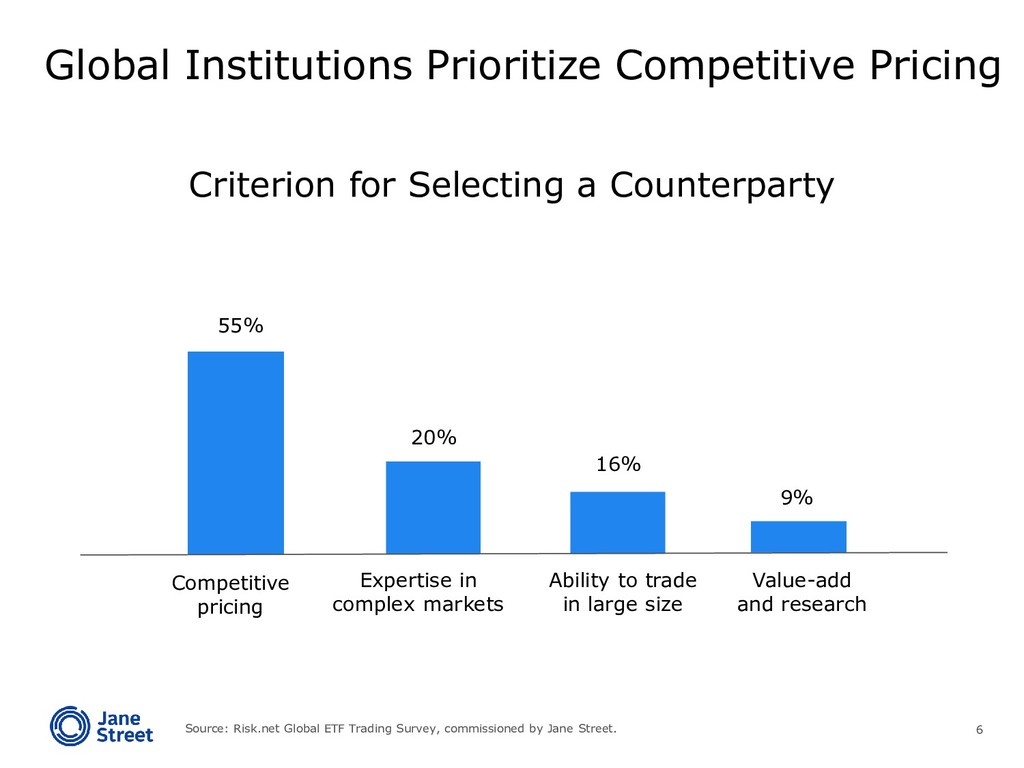
in large size Value-add and research 55% 16% 20% 9% Criterion for Selecting a Counterparty Global Institutions Prioritize Competitive Pricing Source: Risk.net Global ETF Trading Survey, commissioned by Jane Street.
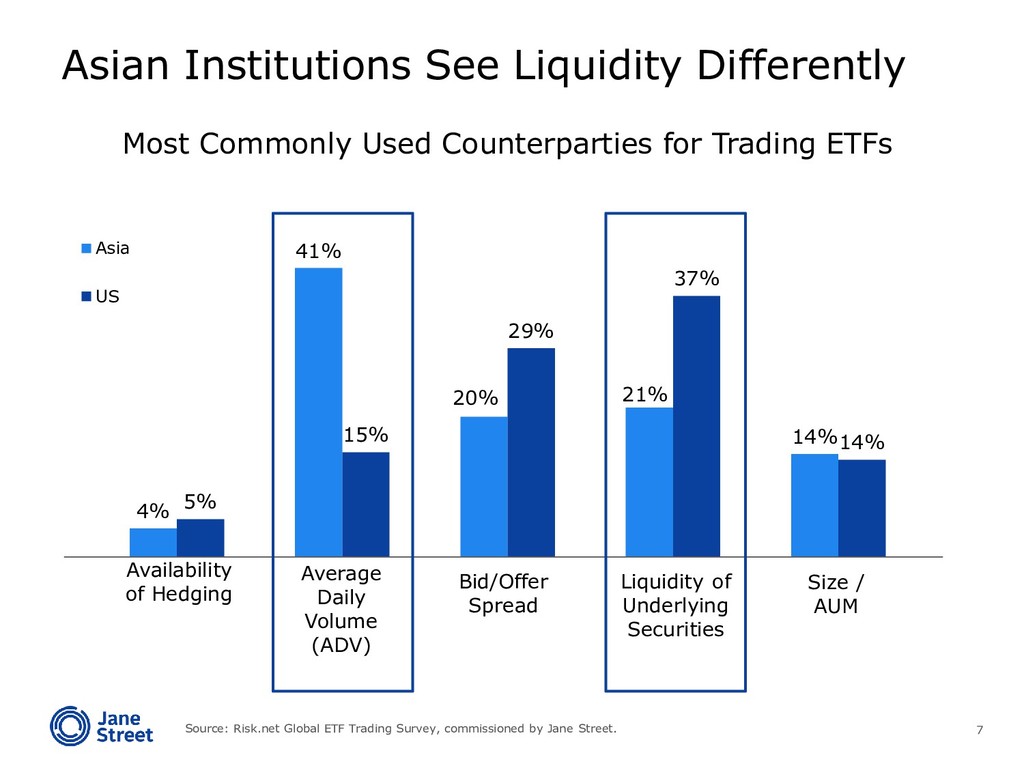
14% Asia US Availability of Hedging Average Daily Volume (ADV) Bid/Offer Spread Size / AUM Liquidity of Underlying Securities Most Commonly Used Counterparties for Trading ETFs Asian Institutions See Liquidity Differently Source: Risk.net Global ETF Trading Survey, commissioned by Jane Street.
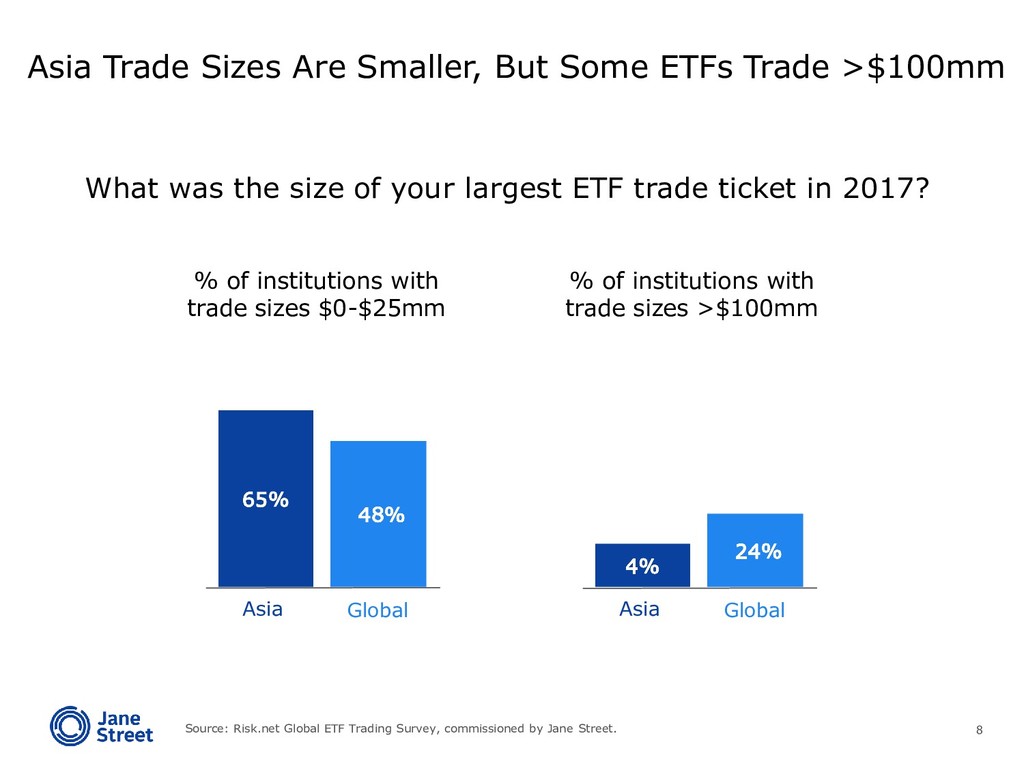
Asia Global % of institutions with trade sizes >$100mm 4% 24% Asia Global What was the size of your largest ETF trade ticket in 2017? Asia Trade Sizes Are Smaller, But Some ETFs Trade >$100mm Source: Risk.net Global ETF Trading Survey, commissioned by Jane Street.
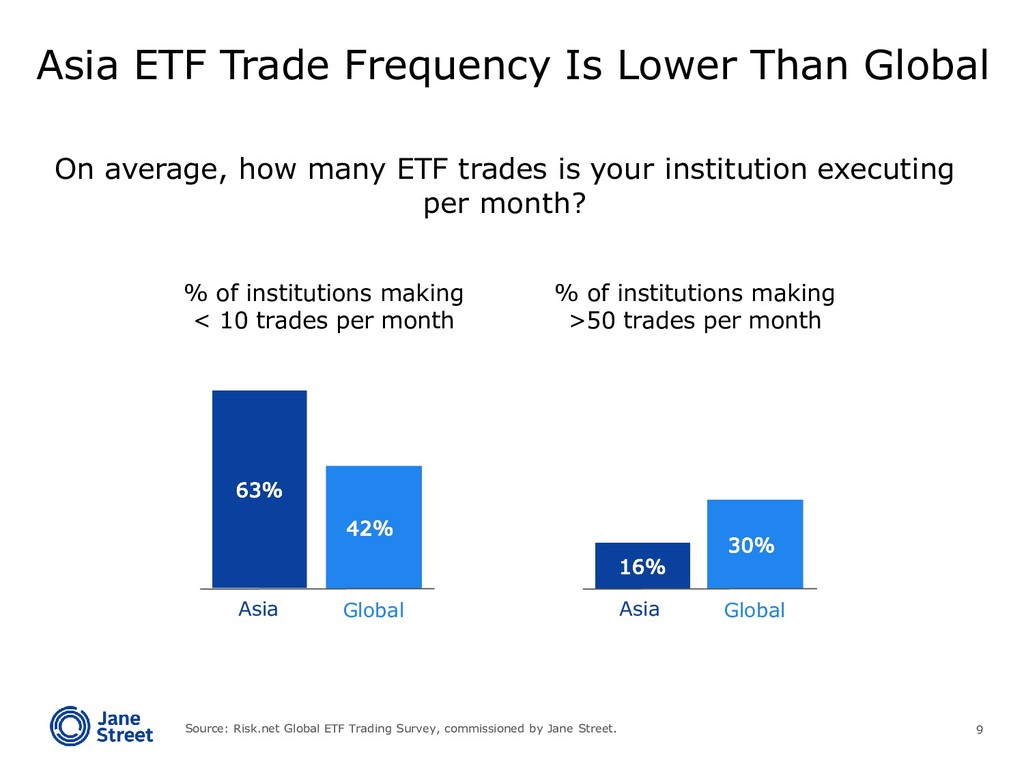
63% 42% Asia Global % of institutions making >50 trades per month 16% 30% Asia Global On average, how many ETF trades is your institution executing per month? Asia ETF Trade Frequency Is Lower Than Global Source: Risk.net Global ETF Trading Survey, commissioned by Jane Street.
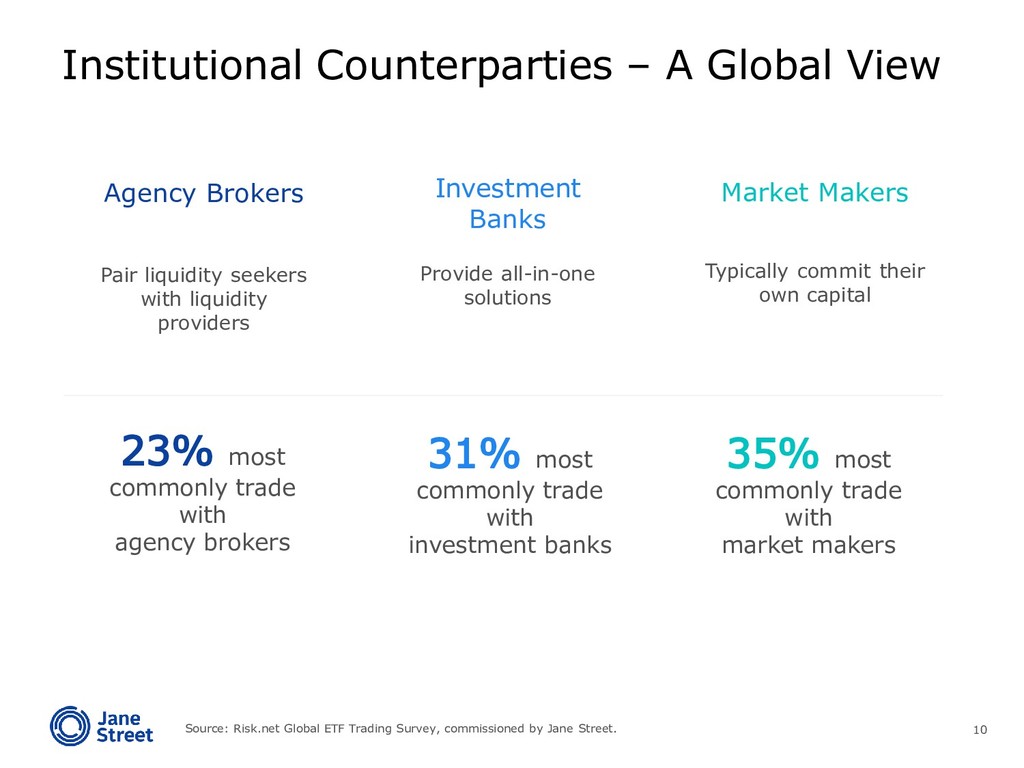
Makers Typically commit their own capital Investment Banks Provide all-in-one solutions 23% most commonly trade with agency brokers 31% most commonly trade with investment banks 35% most commonly trade with market makers Institutional Counterparties – A Global View Source: Risk.net Global ETF Trading Survey, commissioned by Jane Street.
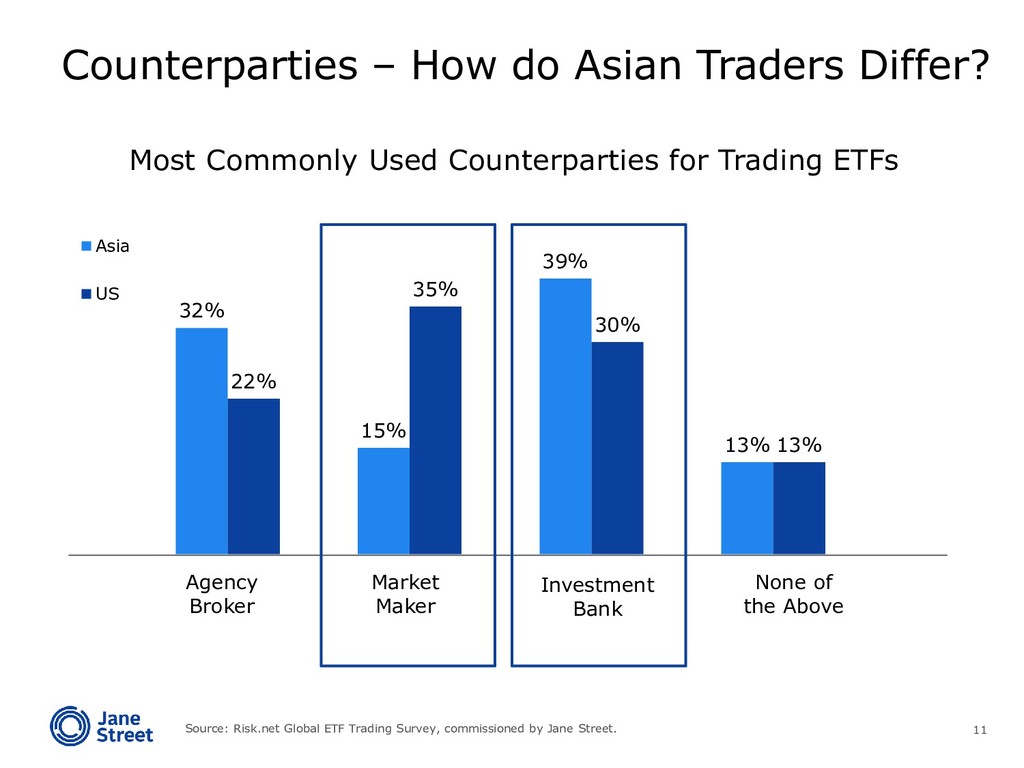
US Agency Broker Market Maker Investment Bank None of the Above Counterparties – How do Asian Traders Differ? Most Commonly Used Counterparties for Trading ETFs Source: Risk.net Global ETF Trading Survey, commissioned by Jane Street.
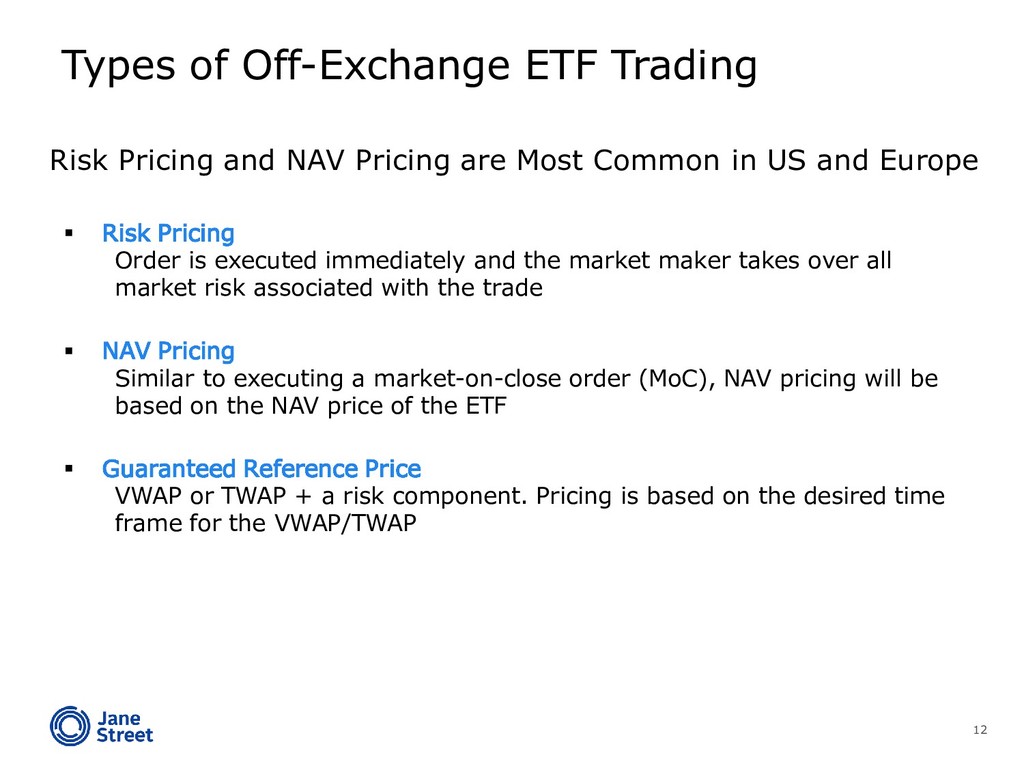
market maker takes over all market risk associated with the trade NAV Pricing Similar to executing a market-on-close order (MoC), NAV pricing will be based on the NAV price of the ETF Guaranteed Reference Price VWAP or TWAP + a risk component. Pricing is based on the desired time frame for the VWAP/TWAP Types of Off-Exchange ETF Trading Risk Pricing and NAV Pricing are Most Common in US and Europe
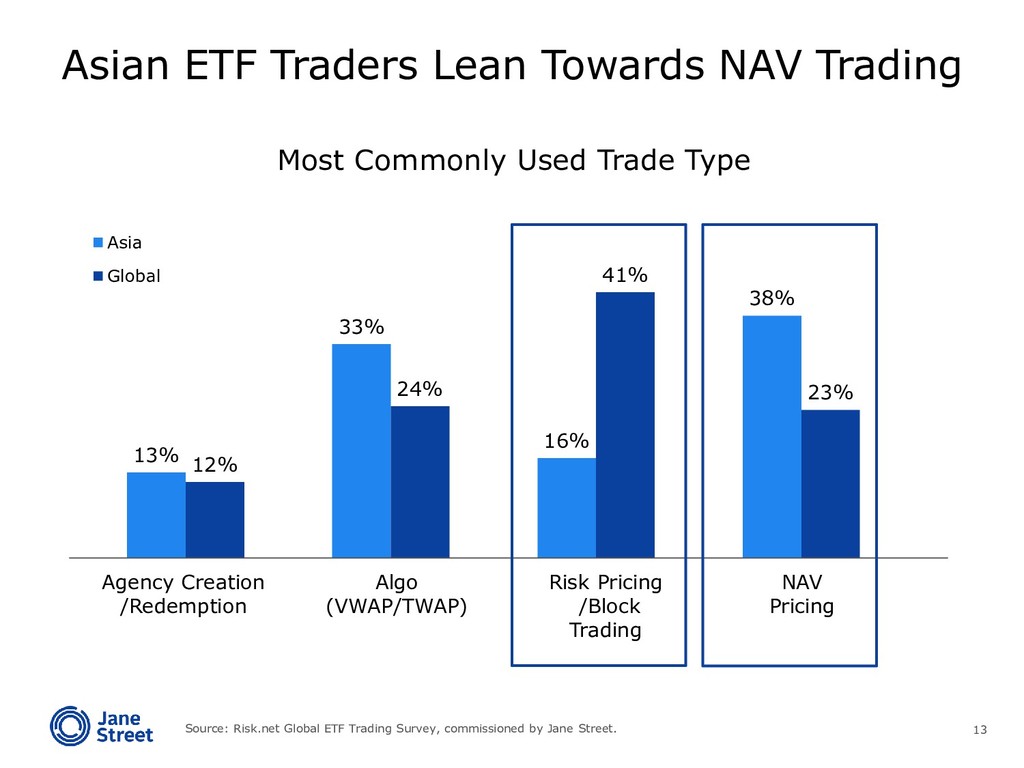
Global Agency Creation /Redemption Algo (VWAP/TWAP) Risk Pricing /Block Trading NAV Pricing Asian ETF Traders Lean Towards NAV Trading Most Commonly Used Trade Type Source: Risk.net Global ETF Trading Survey, commissioned by Jane Street.
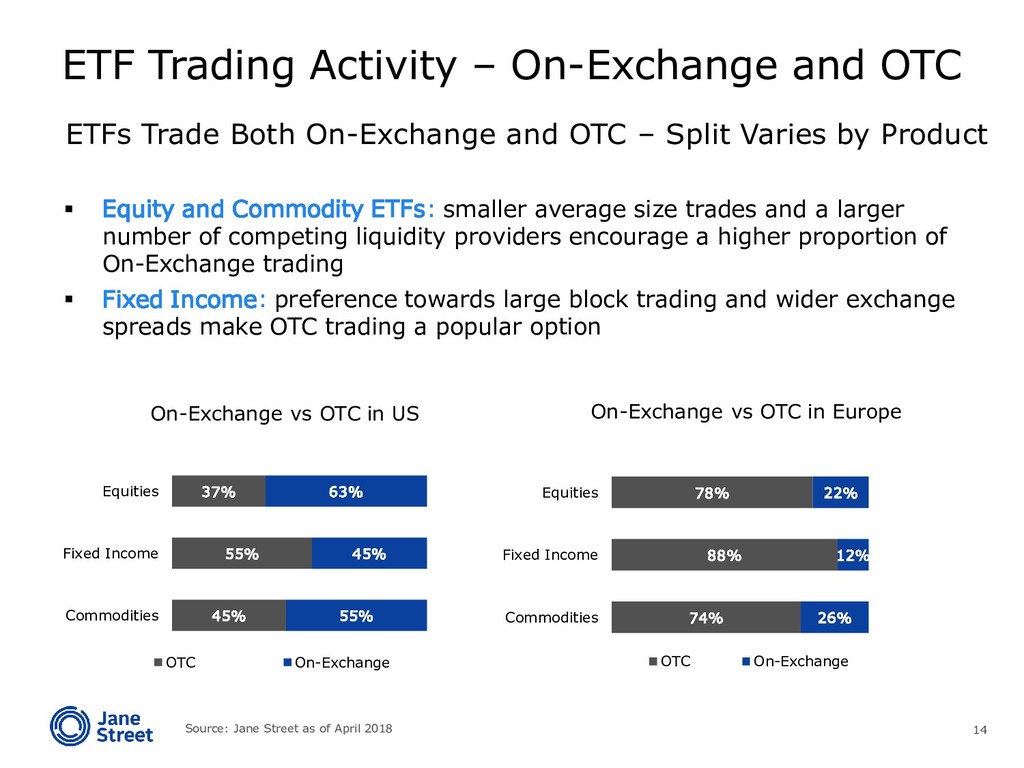
Equities OTC On-Exchange Equity and Commodity ETFs: smaller average size trades and a larger number of competing liquidity providers encourage a higher proportion of On-Exchange trading Fixed Income: preference towards large block trading and wider exchange spreads make OTC trading a popular option On-Exchange vs OTC in US On-Exchange vs OTC in Europe 74% 88% 78% 26% 12% 22% Commodities Fixed Income Equities OTC On-Exchange ETF Trading Activity – On-Exchange and OTC ETFs Trade Both On-Exchange and OTC – Split Varies by Product Source: Jane Street as of April 2018
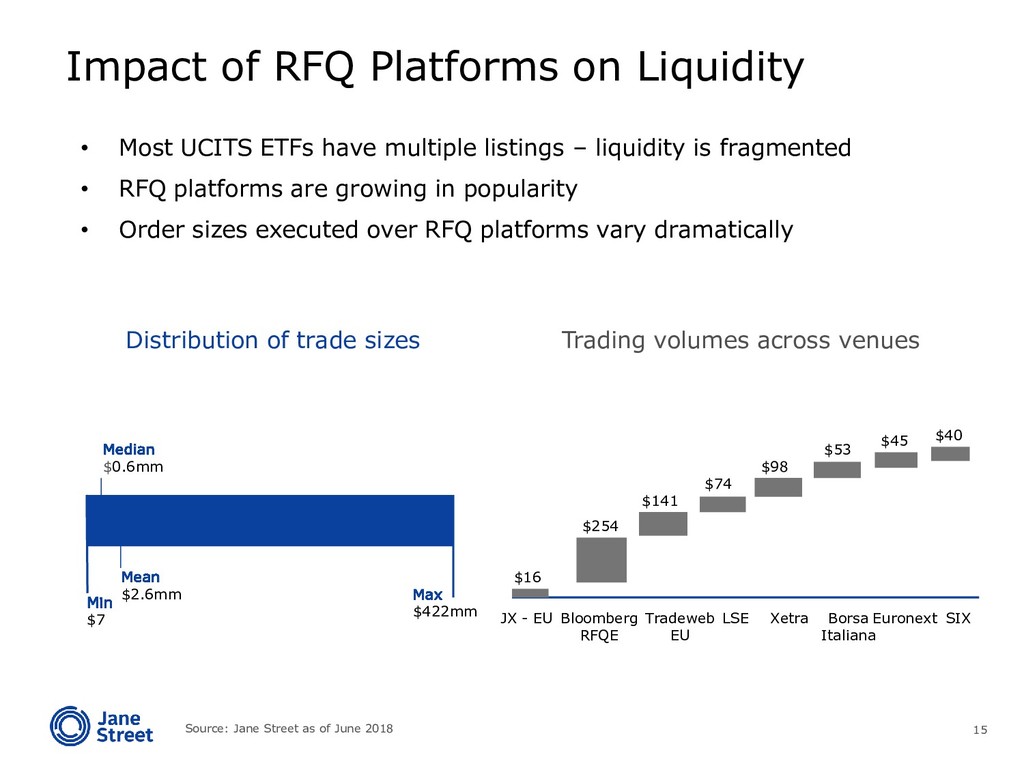
Most UCITS ETFs have multiple listings – liquidity is fragmented • RFQ platforms are growing in popularity • Order sizes executed over RFQ platforms vary dramatically Impact of RFQ Platforms on Liquidity Distribution of trade sizes Trading volumes across venues Median $0.6mm Mean $2.6mm Max $422mm Bloomberg RFQE Tradeweb EU LSE Xetra Borsa Italiana Euronext SIX JX - EU $254 $141 $74 $98 $53 $45 $40 $16 Min $7 Source: Jane Street as of June 2018
reserved. Issued in the United States by Jane Street Execution Services, LLC (JSES), a U.S. registered broker‐dealer and member of FINRA (www.finra.org) and SIPC (www.SIPC.com), in Europe by Jane Street Financial Limited, a registered dealer authorized and regulated by the U.K. Financial Conduct Authority, and in Hong Kong by Jane Street Hong Kong Limited, a licensed company under the Hong Kong Securities and Futures Commission (CE No. BAL548). This material is provided for informational purposes only and is not for distribution to retail clients or where prohibited by applicable law or regulation. This material does not constitute an offer or solicitation for the purchase or sale of any security or other financial instrument. This presentation is for your information only and contains certain sensitive information concerning Jane Street. Accordingly, this presentation, and its contents, may not be provided or otherwise shared with any third‐party without the prior written consent of Jane Street. Disclaimers
![17 24 Hour Client Service Janestreet.com/institutional E: [email protected] T: +(852)](https://files.speakerdeck.com/presentations/eff19b9479214554a40b86af30672311/slide_16.jpg)