Improving Rust Performance Through Profiling and Benchmarking
This talk will compare and contrast common industry tool support for profiling and debugging Rust applications. We'll discuss our experiences finding and fixing performance problems in a production Rust application.
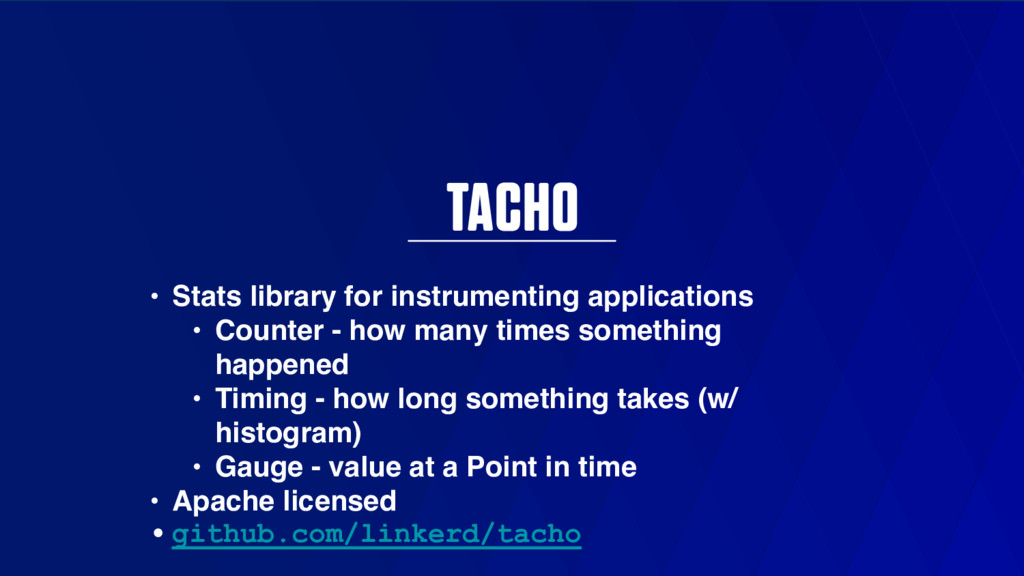
how many times something happened • Timing - how long something takes (w/ histogram) • Gauge - value at a Point in time • Apache licensed • github.com/linkerd/tacho
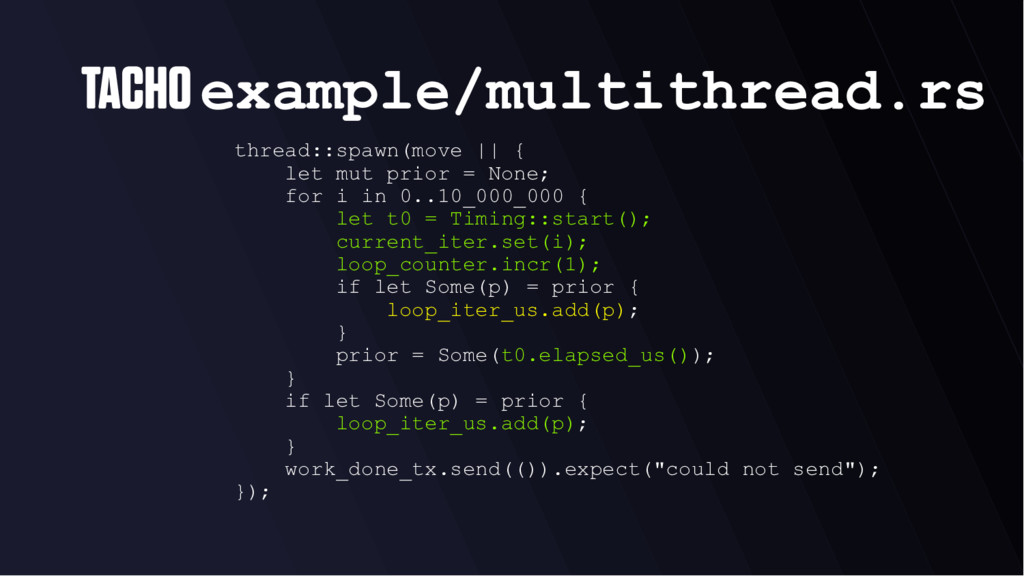
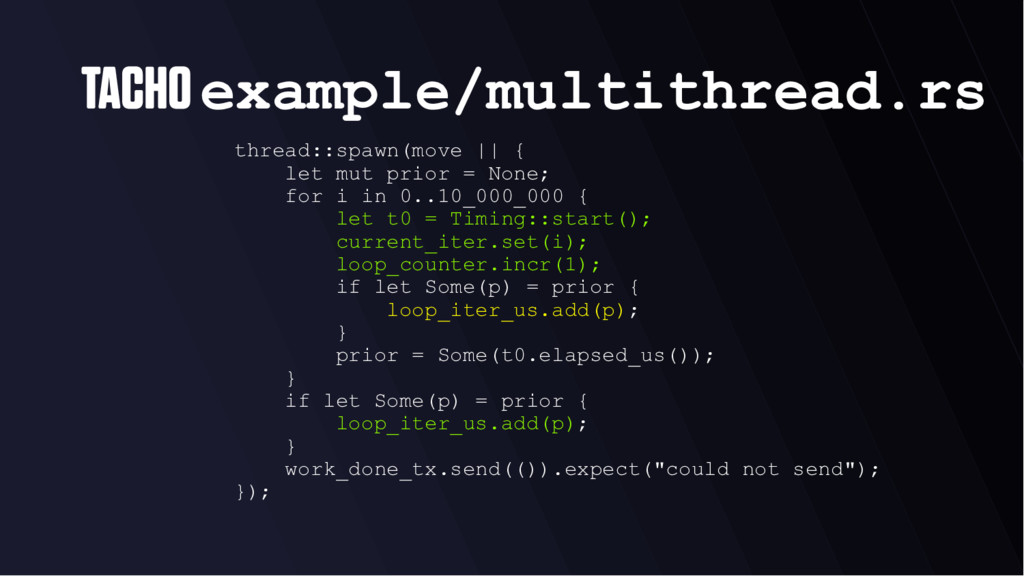
for i in 0..10_000_000 { let t0 = Timing::start(); current_iter.set(i); loop_counter.incr(1); if let Some(p) = prior { loop_iter_us.add(p); } prior = Some(t0.elapsed_us()); } if let Some(p) = prior { loop_iter_us.add(p); } work_done_tx.send(()).expect("could not send"); });
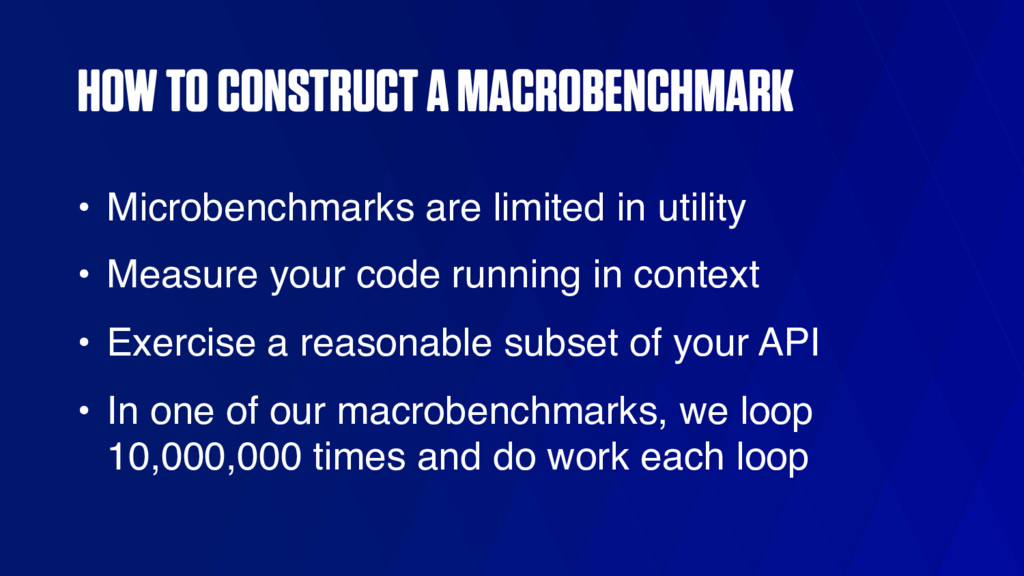
utility • Measure your code running in context • Exercise a reasonable subset of your API • In one of our macrobenchmarks, we loop 10,000,000 times and do work each loop
for i in 0..10_000_000 { let t0 = Timing::start(); current_iter.set(i); loop_counter.incr(1); if let Some(p) = prior { loop_iter_us.add(p); } prior = Some(t0.elapsed_us()); } if let Some(p) = prior { loop_iter_us.add(p); } work_done_tx.send(()).expect("could not send"); });
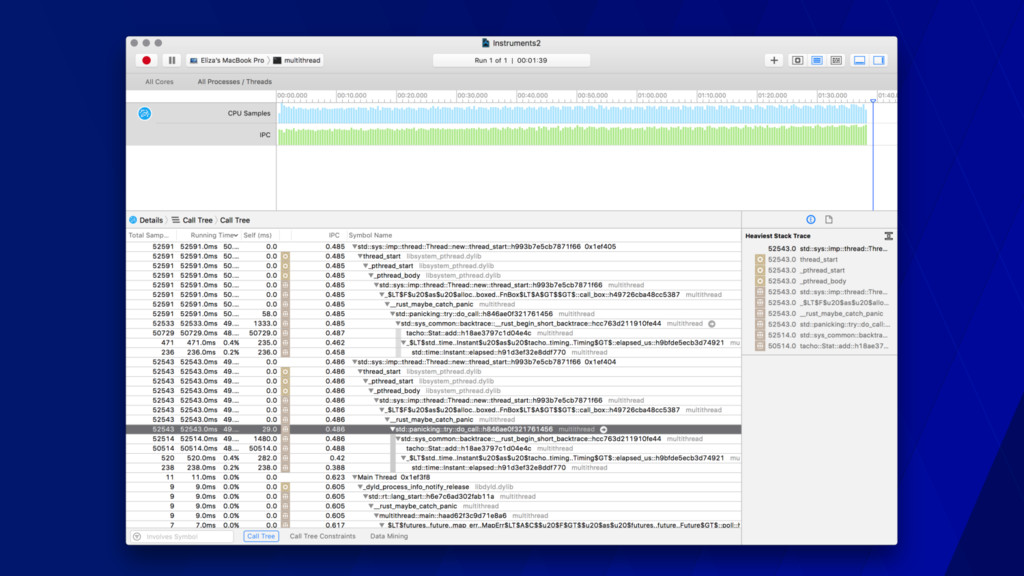
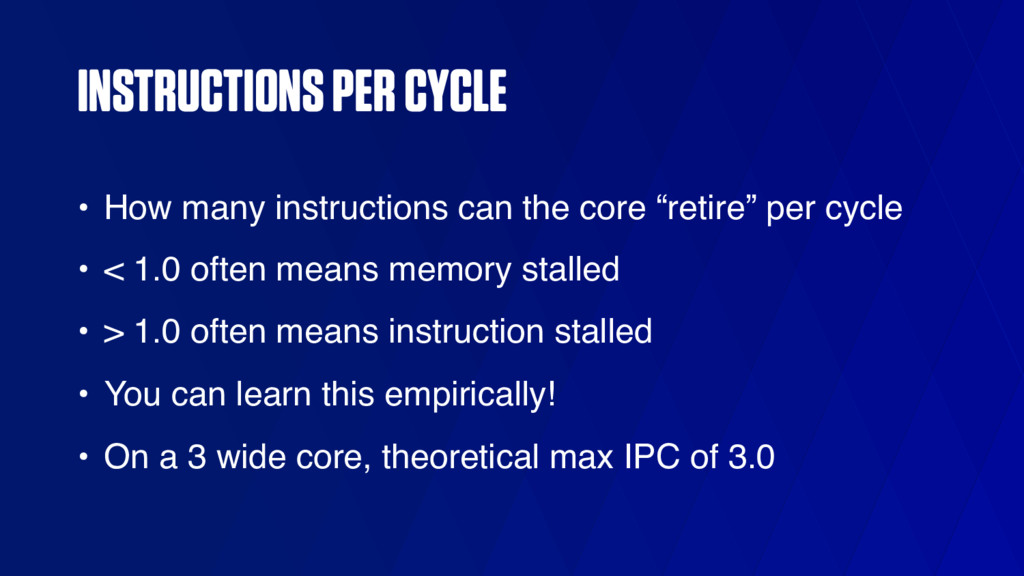
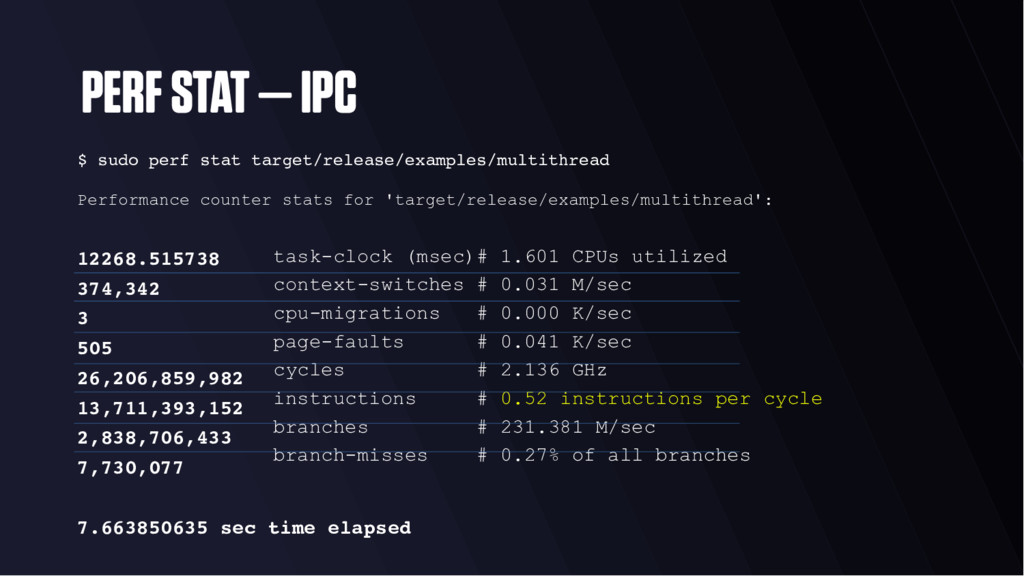
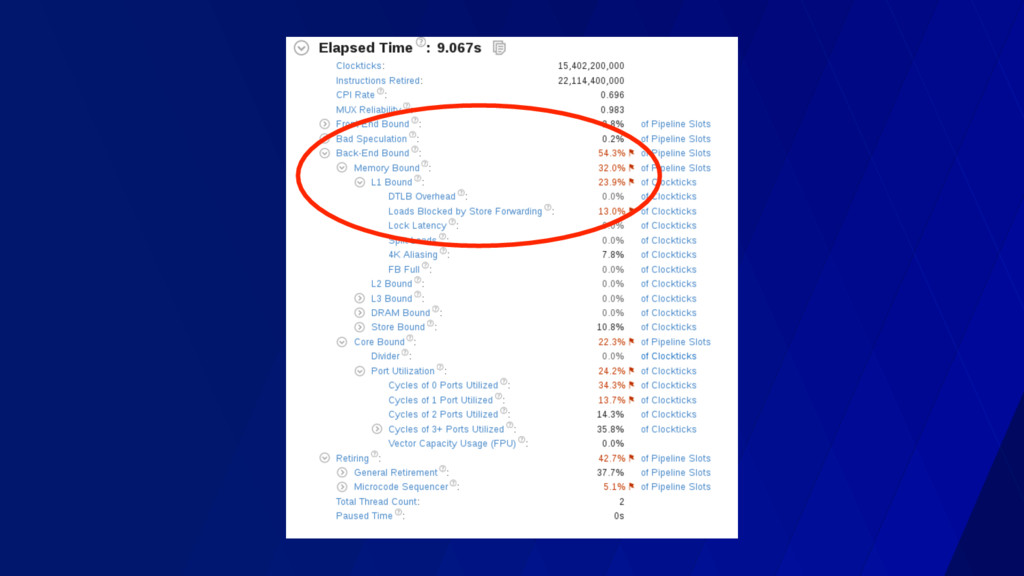
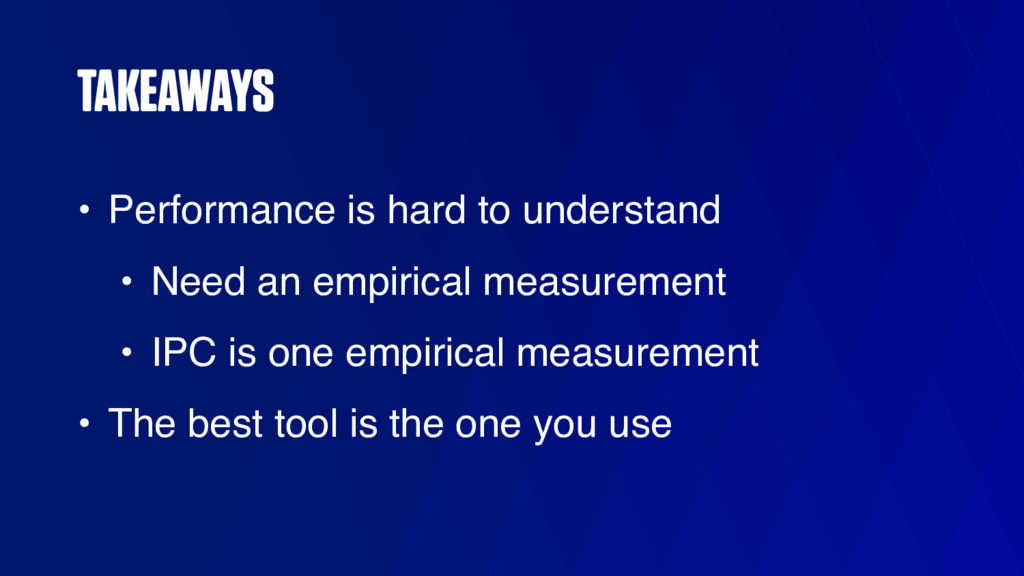
“retire” per cycle • < 1.0 often means memory stalled • > 1.0 often means instruction stalled • You can learn this empirically! • On a 3 wide core, theoretical max IPC of 3.0
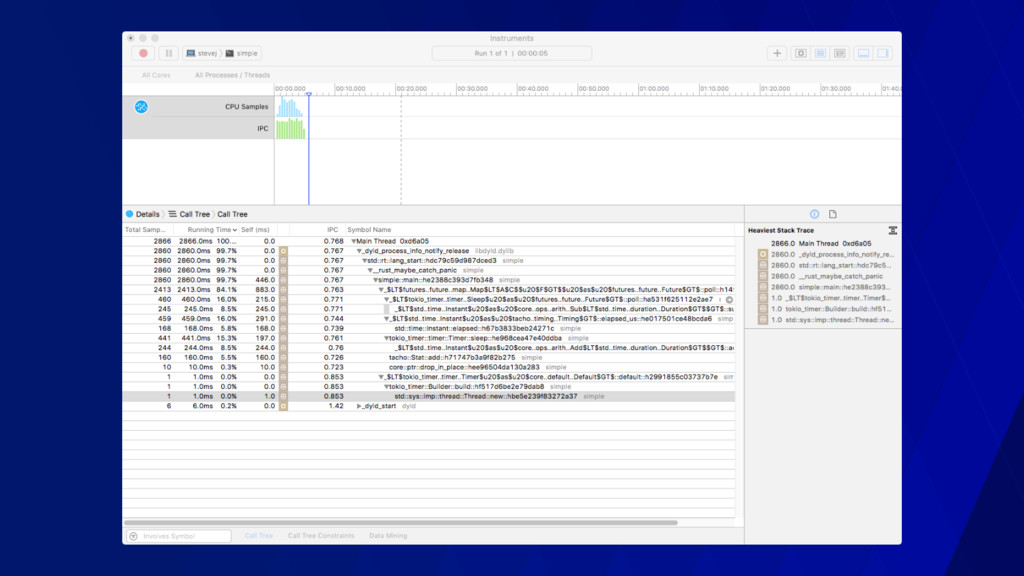
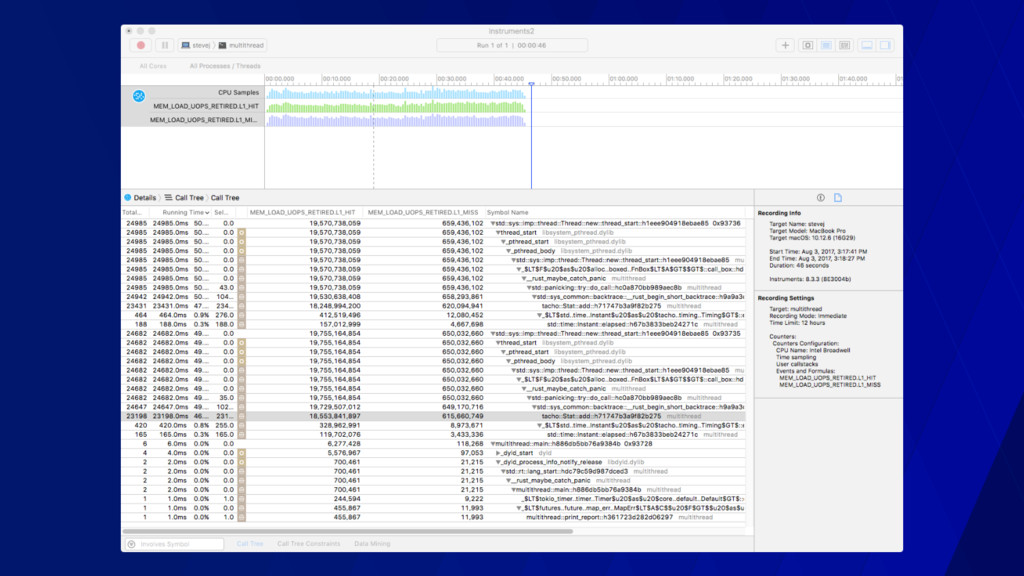
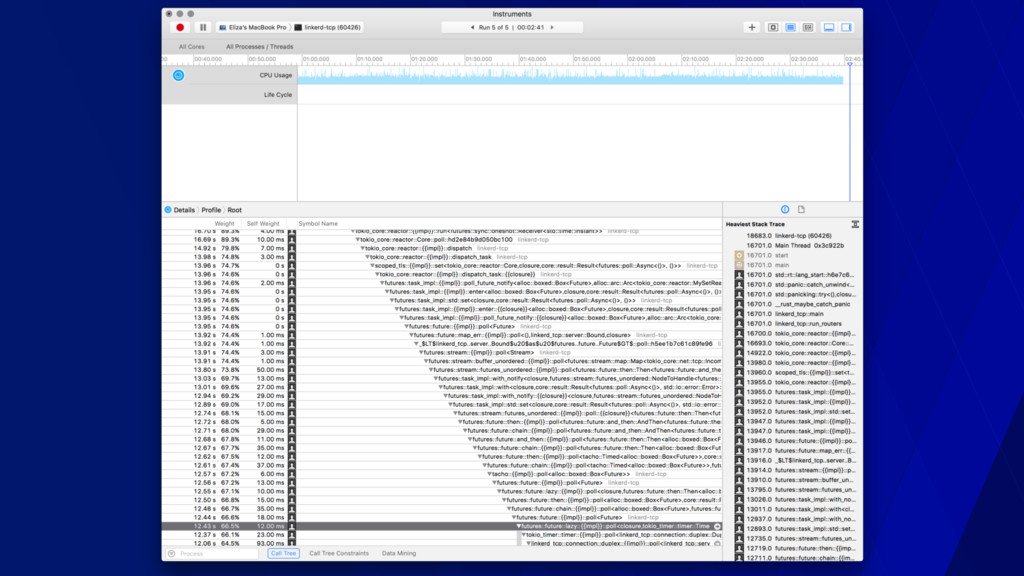
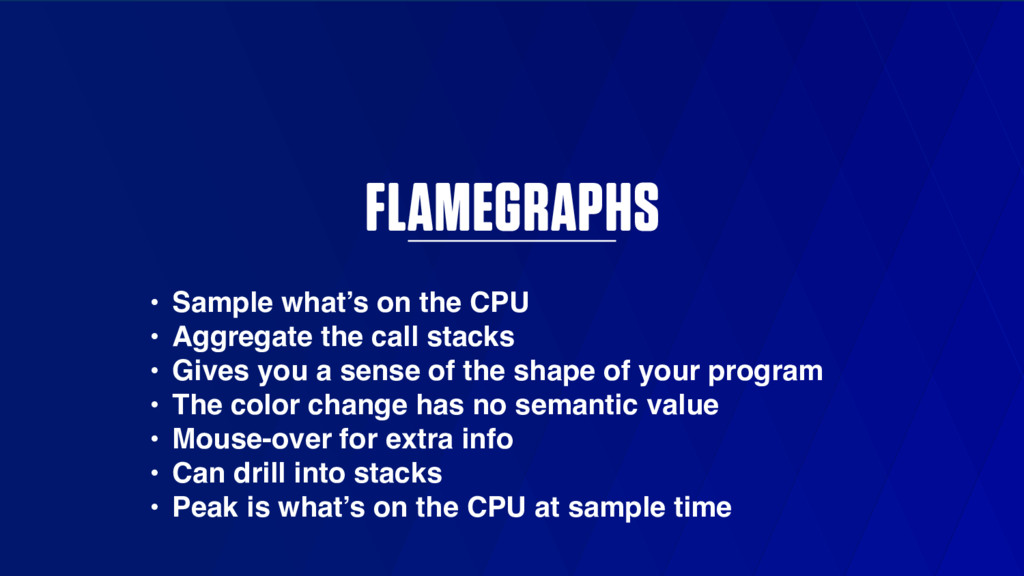
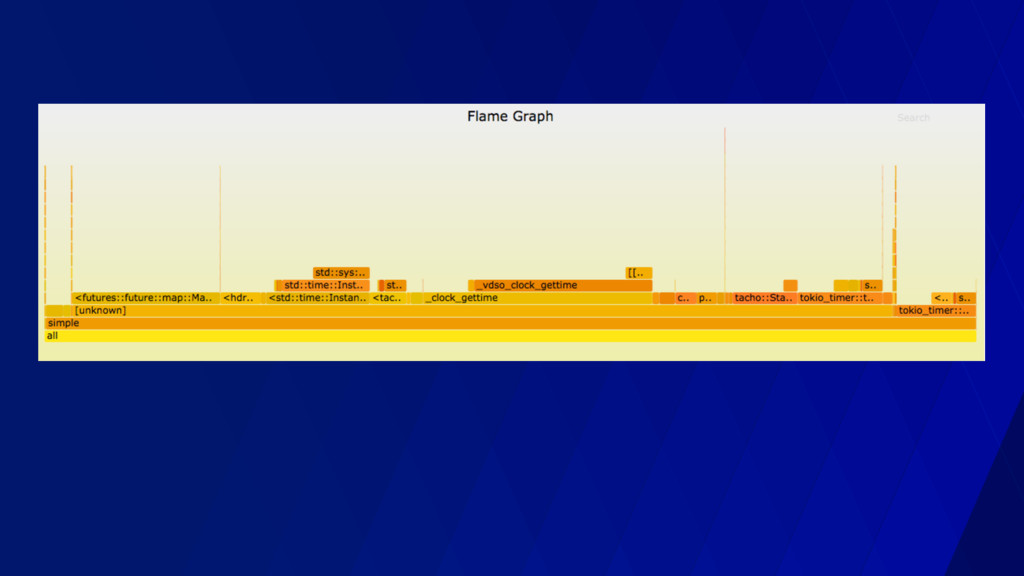
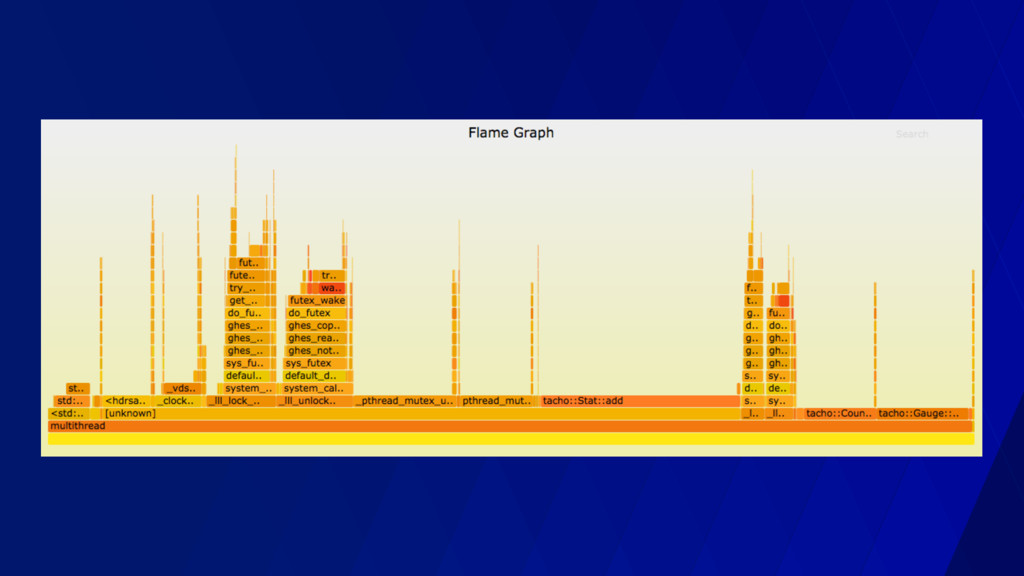
call stacks • Gives you a sense of the shape of your program • The color change has no semantic value • Mouse-over for extra info • Can drill into stacks • Peak is what’s on the CPU at sample time
![#[derive(Copy)]on large structs • Copy semantics can be a life-saver](https://files.speakerdeck.com/presentations/3dbdef81520042d7a766a5394e8d5a44/slide_17.jpg)
![#[derive(Copy)]on large structs #[derive(Copy)] struct Person { user_id: Int, name:](https://files.speakerdeck.com/presentations/3dbdef81520042d7a766a5394e8d5a44/slide_18.jpg)
![CARGO BENCH #[bench] fn bench_counter_create(b: &mut Bencher) { let (metrics,](https://files.speakerdeck.com/presentations/3dbdef81520042d7a766a5394e8d5a44/slide_30.jpg)