Upgrade to Pro — share decks privately, control downloads, hide ads and more …

Storage-Benchmarks – the good, the bad and the ugly

Storage-Benchmarks – the good, the bad and the ugly

Wo und warum sind Storage-Benchmarks manchmal mehr und manchmal weniger sinnvoll? Wir schauen dazu insbesondere den verschiedenen Benchmarks des Storage Performance Council etwas genauer auf die Finger: Was wird da eigentlich gemessen, kann ich das auch bei mir im Rechenzentrum messen, und was ist eigentlich »$/SPC-1 KIOPS« oder »SPC-2 MBPS«?

Wolfgang Stief

February 14, 2019
Tweet

More Decks by Wolfgang Stief

Other Decks in Technology

Transcript

  1. # whoami ‣ open minded geek and engineer ‣ Dipl.-Ing.

    Elektrische Energietechnik ‣ selbständig (2011), Mitgründer sys4 AG (2012)
 technisches Marketing, Erklärbär, E-Mail, Projektkümmerer, Vorstand ‣ Computermuseum München
 Cray-Cyber.org ‣ [email protected]
 @stiefkind (Twitter)
 [email protected]
  2. Agenda ‣Warum überhaupt Benchmarks?
 Aussagekraft, Herausforderungen, I/O-Stack, Tools ‣ Storage

    Performance Council
 SPC-1, SPC-2, Industriestandard, Terminologie, Reports ‣ Und was heißt das jetzt für’s Tagesgeschäft?
 Benchmarks selber programmieren?
 Benchmarks für die Beschaffung?
 Glaskugel
  3. Warum überhaupt Benchmarks? ‣ Vergleichbarkeit von Komponenten, Geräten, Systemen ‣

    Auswahlkriterium bei Beschaffung ‣ Festlegen von SLAs
 Baselining
  4. Herausforderungen @ Benchmarks (generell) ‣ synthetische Last vs. reale Last


    ➛ Benchmarks müssen vergleichbar sein
 ➛ Lastverhalten in RZs indivuell stark unterschiedlich ‣ Man kann das Falsche messen oder das falsche messen wollen. ‣ Man kann das falsche Ergebnis schlussfolgern. ‣ Man kann Fehler ignorieren. ‣ Bugs in der Benchmark-Software
 ➛ selber schreiben i. d. R. keine Option, weil sehr (zeit)aufwendig. ‣ »Active Benchmarking«
 Brendan Gregg, http://www.brendangregg.com/activebenchmarking.html »Wer misst, misst Mist« — überlieferte Ingenieursweisheit
  5. I/O-Stack (1-3) — simple, komplex, Cloud Cloud: something totally different


    viel SDS ➛ $, ASYNC_IO VM VM Filesystem ($) Block I/O Driver (ASYNC) Host System HBA Filesystem ($) Block I/O Driver (ASYNC) Filesystem ($) Block I/O Driver (ASYNC) HBA HBA HBA Storage Controller ($) Storage Controller ($) SAN Virtualisierung ($, Command Queues, Buffering) Storage Controller ($) Storage Controller ($) Flash Layer (auto tiering) VM VM Filesystem ($) Block I/O Driver (ASYNC) Host System HBA Filesystem ($) Block I/O Driver (ASYNC) Filesystem ($) Block I/O Driver (ASYNC) HBA HBA HBA Storage Controller ($) Storage Controller ($) I/O Command Queues, Buffering
  6. I/O-Stack (4) Cloud: something totally different
 viel SDS ➛ $,

    ASYNC_IO ‣ eigene Benchmarks entwickeln?
 ➛ genaue Kenntnis von Tools, Komponenten, Stack, Plattform erforderlich VM VM Filesystem ($) Block I/O Driver (ASYNC) Host System HBA Filesystem ($) Block I/O Driver (ASYNC) Filesystem ($) Block I/O Driver (ASYNC) HBA HBA HBA Storage Controller ($) Storage Controller ($) SAN Virtualisierung ($, Command Queues, Buffering) Storage Controller ($) Storage Controller ($) Flash Layer (auto tiering) VM VM Filesystem ($) Block I/O Driver (ASYNC) Host System HBA Filesystem ($) Block I/O Driver (ASYNC) Filesystem ($) Block I/O Driver (ASYNC) HBA HBA HBA Storage Controller ($) Storage Controller ($) I/O Command Queues, Buffering
  7. Storage Benchmark Tools (unvollständig) ‣ Vdbench (2000, jetzt Oracle, Java)


    https://www.oracle.com/technetwork/server-storage/vdbench-downloads-1901681.html ‣ fio (seit 2005, OpenSource, Linux)
 https://github.com/axboe/fio ‣ filebench (2002, Sun, jetzt OpenSource, WML, Microbenchmark)
 https://github.com/filebench/filebench/wiki ‣ Iometer Project (Intel 1998-2001, jetzt OSDL)
 http://www.iometer.org ‣ IOzone Filesystem Benchmark (ab 1991, u. a. Android)
 http://www.iozone.org ‣ Porcupine (2015 (1.0), Cloud File Systems)
 http://mist.cs.wayne.edu/porcupine.html ‣ IOR (seit 2001, Parallel I/O Benchmark, HPC/MPI)
 https://github.com/hpc/ior ‣ COSbench (ca. 2015(?), Cloud Object Storage, Intel)
 https://github.com/intel-cloud/cosbench
  8. Warum kein dd? ‣ dd(1) ➛ disk dump ‣ dd

    if=<input_file> of=<output_file> bs=<blocksize>
 ➛ sequential only
 ➛ genau ein Stream mit genau einer Blocksize ‣ if=/dev/zero ➛ liefert Strom von Nullen
 ➛ lässt sich hervorragend cachen
 ➛ lässt sich hervorragend komprimieren
 ➛ lässt sich hervorragend deduplizieren ‣ if=/dev/random oder /dev/urandom
 ➛ Bottleneck ist häufig CPU
  9. Agenda ‣ Warum überhaupt Benchmarks?
 Aussagekraft, Herausforderungen, I/O-Stack, Tools ‣Storage

    Performance Council
 SPC-1, SPC-2, Industriestandard, Terminologie, Reports ‣ Und was heißt das jetzt für’s Tagesgeschäft?
 Benchmarks selber programmieren?
 Benchmarks für die Beschaffung?
 Glaskugel
  10. Industriestandard SPC-1 und SPC-2 ‣ Storage Performance Council
 ➛ https://spcresults.org/


    ➛ Full Member: 12.000U$, Toolkit 4.000U$, je Submission 1.000U$ (139 Mitglieder)
 ➛ Associate Member: 4.000U$, Toolkit 6.000U$, je Submission 1.500U$ (140 Mitglieder)
 ➛ Academic Member: 0U$, Toolkit 500U$ (limited license), keine Submissions (141 Mitglieder)
 ➛ »Sponsors« ‣ formale Definition und Spezifikation
 ➛ reproduzierbar
 ➛ vgl. auch SPECint/SPECfp für CPUs ‣ Vergleichbarkeit von Ergebnissen ‣ SPC-1 für zeitkritische Anforderungen (OLTP, Response Time) ‣ SPC-2 für »large scale sequential movement of data«
  11. Industriestandard SPC-1 und SPC-2 ‣ Erweiterung »C« — Components (und

    kleine Systeme) ‣ Ergänzung »E« — Energieverbrauch
 ➛ vorgeschriebenes Messequipment für Leistungsmessung ‣ 4 Regelsätze Benchmark Version Last Updated # Submissions Latest Submission SPC-1
 SPC-1E 3.8 28.10.2018 208
 8 27.12.2018
 29.12.2015 SPC-2
 SPC-2E 1.7 15.10.2017 82
 2 12.08.2018
 24.8.2014 SPC-1C
 SPC-1C/E 1.5 12.05.2013 18
 2 12.06.2010
 02.08.2009 SPC-2C
 SPC-2C/E 1.4 12.05.2013 8
 1 8.2.2009
 18.12.2011
  12. SPC — Terminologie (1) ‣ ES, FDR, SF
 ➛ Executive

    Summary (PDF)
 ➛ Full Disclosure Report (PDF)
 ➛ Supporting Files (ZIP) ‣ Protected 1 vs. Protected 2
 ➛ 1: jedes Storage Device kann ausfallen ohne Datenverlust (typ. RAID)
 ➛ 2: eine beliebige Komponente der TSC kann ausfallen ohne Datenverlust ‣ TSC, PSC (häufig ist TSC = PSC)
 ➛ Tested Storage Configuration
 ➛ Priced Storage Configuration ‣ SPC-1 IOPS vs. SPC-2 MBPS ‣ Price-Performance
 ➛ $/SPC-1 kIOPS
 ➛ $/SPC-2 MBPS EXECUTIVE SUMMARY Page 1 of 6 SPC Benchmark 1™ V3.8 Submission Identifier: A31020 Huawei Technologies Co., Ltd Submitted for Review: December 27, 2018 Huawei OCEANSTOR 5600 V5 EXECUTIVE SUMMARY SPC BENCHMARK 1™ EXECUTIVE SUMMARY HUAWEI TECHNOLOGIES CO., LTD HUAWEI OCEANSTOR 5600 V5 SPC-1 IOPS™ 1,100,252 SPC-1 Price-Performance™ $405.39/SPC-1 KIOPS™ SPC-1 IOPS™ Response Time 0.710 ms SPC-1 Overall Response Time 0.445 ms SPC-1 ASU Capacity 26,124 GB SPC-1 ASU Price $17.08/GB SPC-1 Total System Price $446,024.48 Data Protection Level Protected 2 (RAID-10 and full redundancy) Physical Storage Capacity 69,120 GB Pricing Currency / Target Country U.S. Dollars / USA SPC-1 V3.8 SUBMISSION IDENTIFIER: A31020 SUBMITTED FOR REVIEW: DECEMBER 27, 2018 SPC BENCHMARK 1™ FULL DISCLOSURE REPORT HUAWEI TECHNOLOGIES CO., LTD HUAWEI OCEANSTOR 5600 V5 SPC-1 V3.8 SUBMISSION IDENTIFIER: A31020 SUBMITTED FOR REVIEW: DECEMBER 27, 2018
  13. SPC — Terminologie (2) • Storage Hierarchy
 ➛ Physical Storage

    Capacity ≙ Brutto-Kapazität, nichtflüchtiger Speicher
 ➛ Logical Volume Adressable Capacity ≙ Summe der Kapazität aller LUNs
 ➛ Application Storage Unit, ASU ➛ darauf wird Benchmark gefahren
 ➛ nahezu beliebiges Mapping LV ⾮ ASU Logical Volume Application Storage Unit 1 Application Storage Unit 2 Application Storage Unit 3 Logical Volume Logical Volume Logical Volume Logical Volume Application Storage Unit 1 Logical Volume Logical Volume Application Storage Unit 2 Logical Volume Logical Volume Application Storage Unit 3 Application Storage Unit 1 Application Storage Unit 2 Application Storage Unit 3 Logical Volume
  14. SPC-1 — Executive Summary (1) EXECUTIVE SUMMARY Page 1 of

    6 SPC Benchmark 1™ V3.8 Submission Identifier: A31020 Huawei Technologies Co., Ltd Submitted for Review: December 27, 2018 Huawei OCEANSTOR 5600 V5 EXECUTIVE SUMMARY SPC BENCHMARK 1™ EXECUTIVE SUMMARY HUAWEI TECHNOLOGIES CO., LTD HUAWEI OCEANSTOR 5600 V5 SPC-1 IOPS™ 1,100,252 SPC-1 Price-Performance™ $405.39/SPC-1 KIOPS™ SPC-1 IOPS™ Response Time 0.710 ms SPC-1 Overall Response Time 0.445 ms SPC-1 ASU Capacity 26,124 GB SPC-1 ASU Price $17.08/GB SPC-1 Total System Price $446,024.48 Data Protection Level Protected 2 (RAID-10 and full redundancy) Physical Storage Capacity 69,120 GB Pricing Currency / Target Country U.S. Dollars / USA SPC-1 V3.8 SUBMISSION IDENTIFIER: A31020 SUBMITTED FOR REVIEW: DECEMBER 27, 2018
  15. SPC-1 — Executive Summary (2) EXECUTIVE SUMMARY Page 2 of

    6 SPC Benchmark 1™ V3.8 Submission Identifier: A31020 Huawei Technologies Co., Ltd Submitted for Review: December 27, 2018 Huawei OCEANSTOR 5600 V5 Benchmark Configuration Diagram
  16. SPC-1 — Executive Summary (3) EXECUTIVE SUMMARY Page 4 of

    6 SPC Benchmark 1™ V3.8 Submission Identifier: A31020 Huawei Technologies Co., Ltd Submitted for Review: December 27, 2018 Huawei OCEANSTOR 5600 V5 Storage Configuration Pricing Third-Party Reseller: Huawei Technologies Co., Ltd. only sells its products to third- party resellers who, in turn, sell those products to U.S. customers. The above reflects the pricing quoted by one of those third-party resellers. See Appendix B of the Full Disclosure Report for a copy of the third-party reseller’s quotation. Description Qty Unit Price Ext. Price Disc. Disc. Price 02351LWK 56V5-256G-AC2 OceanStor 5600 V5 Engine(3U,Dual Controller,AC\240HVDC,256GB Cache,SPE63C0300) 2 116,820.00 233,640.00 68% 74,764.80 SMARTIO10ETH 4 port SmartIO I/O module(SFP+,10Gb Eth/FCoE(VN2VF)/Scale-out) 4 6,288.00 25,152.00 68% 8,048.64 SMARTIO8FC 4 port SmartIO I/O module(SFP+,8Gb FC) 8 3,192.00 25,536.00 68% 8,171.52 LPU4S12V3 4 port 4*12Gb SAS I/O module(MiniSAS HD) 8 4,963.00 39,704.00 68% 12,705.28 HSSD-960G2S-A9 960GB SSD SAS Disk Unit(2.5") 72 10,176.00 732,672.00 70% 219,801.60 DAE52525U2-AC-A2 Disk Enclosure(2U,AC\240HVDC,2.5",Expanding Module,25 Disk Slots,without Disk Unit,DAE52525U2) 8 10,584.00 84,672.00 68% 27,095.04 N8GHBA000 QLOGIC QLE2562 HBA Card,PCIE,8Gbps DualPort ,Fiber Channel Multimode LC Optic Interface,English Manual, No Drive CD 12 1,698.00 20,376.00 0% 20,376.00 SN2F01FCPC Patch Cord,DLC/PC,DLC/PC,Multi- mode,3m,A1a.2,2mm,42mm DLC,OM3 bending insensitive 24 14.00 336.00 0% 336.00 LIC-56V5-BS Basic Software License(Including DeviceManager,SmartThin,SmartMulti- tenant,SmartMigration,SmartErase,SmartMotion, SystemReporter,eService,SmartQuota,NFS,CIFS, NDMP 1 9,852.00 9,852.00 70% 2,955.60 374,254.48 02351LWK-88134ULF-36 OceanStor 5600 V5 Engine(3U,Dual Controller,AC\240HVDC,256GB Cache,SPE63C0300&4*Disk Enclosure- 2U,AC\240HVDC,2.5",DAE52525U2&36*960GB SSD SAS Disk Unit(2.5"))-Hi-Care Onsite Premier 24x7x4H Engineer Onsite Service- 36Month(s) 2 29,292.00 58,584.00 0% 58,584.00 88034JNY-88134UHK-36 Basic Software License(Including DeviceManager,SmartThin,SmartMulti- tenant,SmartMigration,SmartErase,SmartMotion, SystemReporter,eService,SmartQuota,NFS,CIFS, NDMP)-Hi-Care Application Software Upgrade Support Service-36Month(s) 1 2,919.00 2,919.00 0% 2,919.00 8812153244 OceanStor 5600 V5 Installation Service - Engineering 1 10,267.00 10,267.00 0% 10,267.00 71,770.00 446,024.48 1,100,252 405.39 26,124 17.08 SPC-1 Total System Price SPC-1 ASU Capacity (GB) SPC-1 ASU Price ($/GB) SPC-1 IOPS™ SPC-1 Price-Performance™ ($/SPC-1 KIOPS™) Hardware & Software Hardware & Software Subtotal Support & Maintenance Support & Maintenance Subtotal
  17. SPC-1 — Full Disclosure Report (1) CONFIGURATION INFORMATION Page 13

    of 42 SPC Benchmark 1™ V3.8 FULL DISCLOSURE REPORT Submission Identifier: A31020 Huawei Technologies Co., Ltd Submitted for Review: December 27, 2018 Huawei OCEANSTOR 5600 V5 CONFIGURATION INFORMATION Benchmark Configuration and Tested Storage Configuration The following diagram illustrates the Benchmark Configuration (BC), including the Tested Storage Configuration (TSC) and the Host System(s). Storage Network Configuration The Tested Storage Configuration (TSC) involved an external storage subsystem made of 4 Huawei OCEANSTOR 5600 V5, driven by 6 host systems (Huawei BENCHMARK EXECUTION RESULTS Page 16 of 42 Overview SPC Benchmark 1™ V3.8 FULL DISCLOSURE REPORT Submission Identifier: A31020 Huawei Technologies Co., Ltd Submitted for Review: December 27, 2018 Huawei OCEANSTOR 5600 V5 BENCHMARK EXECUTION RESULTS This portion of the Full Disclosure Report documents the results of the various SPC-1 Tests, Test Phases, and Test Runs. Benchmark Execution Overview Workload Generator Input Parameters The SPC-1 Workload Generator commands and input parameters for the Test Phases are presented in the Supporting Files (see Appendix A). Primary Metrics Test Phases The benchmark execution consists of the Primary Metrics Test Phases, including the Test Phases SUSTAIN, RAMPD_100 to RAMPD_10, RAMPU_50 to RAMPU_100, RAMP_0, REPEAT_1 and REPEAT_2. Each Test Phase starts with a transition period followed by a Measurement Interval. Measurement Intervals by Test Phase Graph The following graph presents the average IOPS and the average Response Times measured over the Measurement Interval (MI) of each Test Phase. Exception and Waiver None. 0 0.1 0.2 0.3 0.4 0.5 0.6 0.7 0.8 0 200,000 400,000 600,000 800,000 1,000,000 1,200,000 Average Measured Response Time (ms) Average Measured IOPS Measurement Intervals by Test Phase Graph IOPS Response Time
  18. SPC-1 — Full Disclosure Report (2) BENCHMARK EXECUTION RESULTS Page

    24 of 42 Primary Metrics – Response Time Ramp Test SPC Benchmark 1™ V3.8 FULL DISCLOSURE REPORT Submission Identifier: A31020 Huawei Technologies Co., Ltd Submitted for Review: December 27, 2018 Huawei OCEANSTOR 5600 V5 Response Time Ramp Test – Average Response Time Graph Response Time Ramp Test – RAMPD_10 Response Time Graph 0.000 0.100 0.200 0.300 0.400 0.500 0.600 0.700 0.800 Average Measured Response Time (ms) Average Response Time Graph (Response Time Ramp Test) MI 0.0 0.2 0.4 0.6 0.8 1.0 1.2 1.4 0 2 4 6 8 10 12 14 Response Time (ms) Relative Run Time (minutes) Response Time Graph (RAMPD_10 @ 110,020 IOPS) ASU1 ASU2 ASU3 All ASUs BENCHMARK EXECUTION RESULTS Page 27 of 42 Repeatability Tests SPC Benchmark 1™ V3.8 FULL DISCLOSURE REPORT Submission Identifier: A31020 Huawei Technologies Co., Ltd Submitted for Review: December 27, 2018 Huawei OCEANSTOR 5600 V5 REPEAT_2_100 – Response Time Graph Repeatability Test – Intensity Multiplier The following tables lists the targeted intensity multiplier (Defined), the measured intensity multiplier (Measured) for each I/O STREAM, its coefficient of variation (Variation) and the percent of difference (Difference) between Target and Measured. REPEAT_1_100 Test Phase ASU1-1 ASU1-2 ASU1-3 ASU1-4 ASU2-1 ASU2-2 ASU2-3 ASU3-1 Defined 0.0350 0.2810 0.0700 0.2100 0.0180 0.0700 0.0350 0.2810 Measured 0.0350 0.2810 0.0700 0.2100 0.0180 0.0700 0.0350 0.2810 Variation 0.0005 0.0002 0.0007 0.0003 0.0008 0.0005 0.0005 0.0001 Difference 0.002% 0.005% 0.010% 0.005% 0.025% 0.005% 0.015% 0.003% REPEAT_2_100 Test Phase ASU1-1 ASU1-2 ASU1-3 ASU1-4 ASU2-1 ASU2-2 ASU2-3 ASU3-1 Defined 0.0350 0.2810 0.0700 0.2100 0.0180 0.0700 0.0350 0.2810 Measured 0.0350 0.2810 0.0700 0.2100 0.0180 0.0700 0.0350 0.2810 Variation 0.0004 0.0002 0.0005 0.0002 0.0011 0.0003 0.0008 0.0002 Difference 0.043% 0.010% 0.016% 0.003% 0.045% 0.006% 0.011% 0.005% MI 0.0 0.2 0.4 0.6 0.8 1.0 1.2 1.4 0 2 4 6 8 10 12 14 Response Time (ms) Relative Run Time (minutes) Response Time Graph (REPEAT_2_100 @ 1,100,200 IOPS) ASU1 ASU2 ASU3 All ASUs
  19. SPC-1 — Supporting Files (1) $ tree SPC-1_A31020_Supporting-Files_Huawei-OS5600-V5 SPC-1_A31020_Supporting-Files_Huawei-OS5600-V5 !""

    Supporting\ Files #"" C_Tuning $ #"" aio-max-nr.sh $ #"" nr_requests.sh $ !"" scheduler.sh #"" D_Creation $ #"" mklun.txt $ !"" mkvolume.sh #"" E_Inventory $ #"" profile1_storage.log $ #"" profile1_volume.log $ #"" profile2_storage.log $ !"" profile2_volume.log #"" F_Generator $ #"" full_run.sh $ #"" host.HST $ !"" slave_asu.asu !"" SPC1_RESULTS #"" SPC1_INIT_0_Raw_Results.xlsx #"" SPC1_METRICS_0_Quick_Look.xlsx #"" SPC1_METRICS_0_Raw_Results.xlsx #"" SPC1_METRICS_0_Summary_Results.xlsx #"" SPC1_PERSIST_1_0_Raw_Results.xlsx #"" SPC1_PERSIST_2_0_Raw_Results.xlsx #"" SPC1_Run_Set_Overview.xlsx #"" SPC1_VERIFY_0_Raw_Results.xlsx !"" SPC1_VERIFY_1_Raw_Results.xlsx 6 directories, 21 files
  20. SPC-1 — Supporting Files (2) $ cat SPC-1_A31020_Supporting-Files_Huawei-OS5600-V5/Supporting\ Files/C_Tuning/aio-max-nr.sh echo

    10485760 > /proc/sys/fs/aio-max-nr $ cat SPC-1_A31020_Supporting-Files_Huawei-OS5600-V5/Supporting\ Files/D_Creation/mklun.txt create disk_domain name=dd00 disk_list=DAE000.0-8 tier0_hotspare_strategy=low disk_domain_id=0 create disk_domain name=dd01 disk_list=DAE030.0-8 tier0_hotspare_strategy=low disk_domain_id=1 create disk_domain name=dd02 disk_list=DAE040.0-8 tier0_hotspare_strategy=low disk_domain_id=2 … create storage_pool name=sp00 disk_type=SSD capacity=3139GB raid_level=RAID10 pool_id=0 disk_domain_id=0 create storage_pool name=sp01 disk_type=SSD capacity=3139GB raid_level=RAID10 pool_id=1 disk_domain_id=1 … create lun name=lun_sp00 lun_id_list=0-3 pool_id=0 capacity=784GB prefetch_policy=none create lun name=lun_sp01 lun_id_list=4-7 pool_id=1 capacity=784GB prefetch_policy=none … create host name=host0 operating_system=Linux host_id=0 create host name=host1 operating_system=Linux host_id=1 … create host_group name=hg0 host_group_id=0 host_id_list=0-5 create lun_group name=lg0 lun_group_id=0 add lun_group lun lun_group_id=0 lun_id_list=0-31 create mapping_view name=mv1 mapping_view_id=1 lun_group_id=0 host_group_id=0 add host initiator host_id=0 initiator_type=FC wwn=21000024ff4b81fc add host initiator host_id=0 initiator_type=FC wwn=21000024ff4b81fd … $ cat SPC-1_A31020_Supporting-Files_Huawei-OS5600-V5/Supporting\ Files/D_Creation/mkvolume.sh pvcreate /dev/sdb pvcreate /dev/sdc pvcreate /dev/sdd … vgcreate vg1 /dev/sdb /dev/sdc /dev/sdd /dev/sde… … lvcreate -n asu101 -i 32 -I 512 -C y -L 608.25g vg1 lvcreate -n asu102 -i 32 -I 512 -C y -L 608.25g vg1 lvcreate -n asu103 -i 32 -I 512 -C y -L 608.25g vg1 lvcreate -n asu104 -i 32 -I 512 -C y -L 608.25g vg1 …
  21. SPC-2 — Executive Summary EXECUTIVE SUMMARY Page 4 of 9

    SPC BENCHMARK 2™ V1.7.0 Executive Summary Vexata Inc. Submitted: August 29, 2018 VX100-F Scalable NVMe Flash Array Submission ID: B12004 SPC-2 Reported Data VX100-F Scalable NVMe Flash Array SPC-2 MBPS™ SPC-2 Price- Performance ASU Capacity (GB) Total Price Data Protection Level 49,042.39 $5.35 20,615.843 $262,572.59 Protected 1 (RAID 5 (N+1).) The above SPC-2 MBPS™ value represents the aggregate data rate of all three SPC-2 workloads: Large File Processing (LFP), Large Database Query (LDQ), and Video On Demand (VOD). Currency Used: "Target Country": U.S. Dollars USA SPC-2 Large File Processing (LFP) Reported Data Data Rate (MB/second) Number of Streams Data Rate per Stream Price-Performance LFP Composite 47,554.98 $5.52 Write Only: 1024 KiB Transfer 35,532.23 40 888.31 256 KiB Transfer 34,763.83 80 434.55 Read-Write: 1024 KiB Transfer 59,486.68 184 323.30 256 KiB Transfer 59,810.01 184 325.05 Read Only: 1024 KiB Transfer 48,190.46 184 261.90 256 KiB Transfer 47,546.68 184 258.41 The above SPC-2 Data Rate value for LFP Composite represents the aggregate performance of all three LFP Test Phases: (Write Only, Read-Write, and Read Only). SPC-2 Large Database Query (LDQ) Reported Data Data Rate (MB/second) Number of Streams Data Rate per Stream Price-Performance LDQ Composite 49,869.23 $5.27 1024 KiB Transfer Size 4 I/Os Outstanding 50,425.48 32 1,575.80 1 I/O Outstanding 50,390.42 96 524.90 64 KiB Transfer Size 4 I/Os Outstanding 50,609.64 96 527.18 1 I/O Outstanding 48,051.39 320 150.16 The above SPC-2 Data Rate value for LDQ Composite represents the aggregate performance of the two LDQ Test Phases: (1024 KiB and 64 KiB Transfer Sizes). SPC-2 Video On Demand (VOD) Reported Data Data Rate (MB/second) Number of Streams Data Rate per Stream Price-Performance 49,702.97 63,200 0.79 $5.28
  22. SPC-2 — Full Disclosure Report (1) SPC-2 DATA REPOSITORY Page

    22 of 61 SPC BENCHMARK 2™ V1.7.0 Full Disclosure Report Vexata Inc. Submitted: August 29, 2018 VX100-F Scalable NVMe Flash Array Submission ID: B12004 Storage Hierarchy Ratios Addressable Storage Capacity Configured Storage Capacity Physical Storage Capacity Total ASU Capacity 100.00% 32.21% 32.21% Data Protection (RAID 5 (N+1).) 2.18% 2.18% Addressable Storage Capacity 32.21% 32.21% Required Storage 37.45% 37.45% Configured Storage Capacity 100.00% Global Storage Overhead 0.00% Unused Storage: Addressable 0.00% Configured 25.57% Physical 0.00% Storage Capacity Charts Global Storage Overhead: 0.000 GB (0.00%) Unused Physical Capacity: 0.000 GB (0.00%) Data Capacity: 22,284.902 GB (34.81%) Data Protection Capacity: 1,392.806 GB (2.18%) Sparing Capacity: 0.000 GB (0.00%) Overhead & Metadata: 23,970.195 GB (37.45%) Configured Storage Capacity: 64,013.113 GB (100.00%) Physical Storage Capacity: 64,013.113 GB SPC-2 DATA REPOSITORY Page 23 of 61 SPC BENCHMARK 2™ V1.7.0 Full Disclosure Report Vexata Inc. Submitted: August 29, 2018 VX100-F Scalable NVMe Flash Array Submission ID: B12004 Data Protection Capacity: 1,392.806 GB (2.18%) Spares: 0.000 GB (0.00%) Overhead & Metadata: 23,970.195 GB (37.45%) Addressable Storage Capacity: 20,615.843 GB (32.21%) Unused Data Capacity: 1,669.059 GB (2.61%) Data Capacity: 22,284.902 GB (34.81%) Configured Storage Capacity: 64,013.113 GB ASU Capacity: 20,615.843 GB (100.00%) Addressable Storage Capacity: 20,615.843 GB Unused Addressable Capacity: 0.000 GB (0.00%)
  23. SPC-2 — Full Disclosure Report (2) SPC-2 BENCHMARK EXECUTION RESULTS

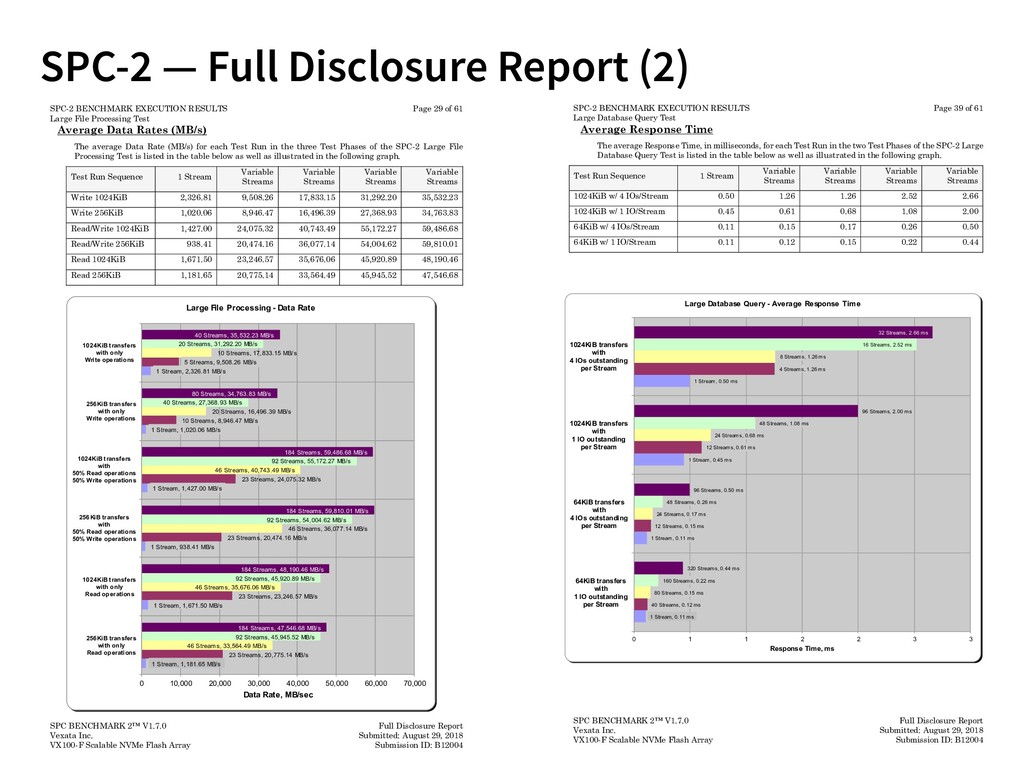
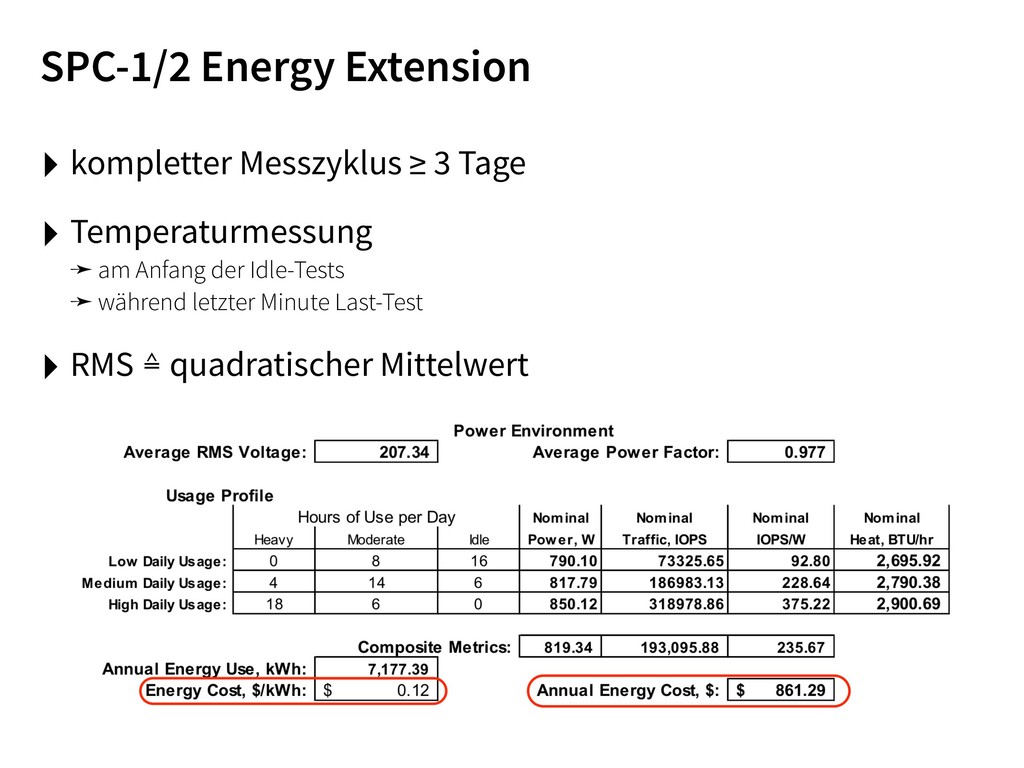
    Page 29 of 61 Large File Processing Test SPC BENCHMARK 2™ V1.7.0 Full Disclosure Report Vexata Inc. Submitted: August 29, 2018 VX100-F Scalable NVMe Flash Array Submission ID: B12004 Average Data Rates (MB/s) The average Data Rate (MB/s) for each Test Run in the three Test Phases of the SPC-2 Large File Processing Test is listed in the table below as well as illustrated in the following graph. Test Run Sequence 1 Stream Variable Streams Variable Streams Variable Streams Variable Streams Write 1024KiB 2,326.81 9,508.26 17,833.15 31,292.20 35,532.23 Write 256KiB 1,020.06 8,946.47 16,496.39 27,368.93 34,763.83 Read/Write 1024KiB 1,427.00 24,075.32 40,743.49 55,172.27 59,486.68 Read/Write 256KiB 938.41 20,474.16 36,077.14 54,004.62 59,810.01 Read 1024KiB 1,671.50 23,246.57 35,676.06 45,920.89 48,190.46 Read 256KiB 1,181.65 20,775.14 33,564.49 45,945.52 47,546.68 1 Stream, 1,181.65 MB/s 1 Stream, 1,671.50 MB/s 1 Stream, 938.41 MB/s 1 Stream, 1,427.00 MB/s 1 Stream, 1,020.06 MB/s 1 Stream, 2,326.81 MB/s 23 Streams, 20,775.14 MB/s 23 Streams, 23,246.57 MB/s 23 Streams, 20,474.16 MB/s 23 Streams, 24,075.32 MB/s 10 Streams, 8,946.47 MB/s 5 Streams, 9,508.26 MB/s 46 Streams, 33,564.49 MB/s 46 Streams, 35,676.06 MB/s 46 Streams, 36,077.14 MB/s 46 Streams, 40,743.49 MB/s 20 Streams, 16,496.39 MB/s 10 Streams, 17,833.15 MB/s 92 Streams, 45,945.52 MB/s 92 Streams, 45,920.89 MB/s 92 Streams, 54,004.62 MB/s 92 Streams, 55,172.27 MB/s 40 Streams, 27,368.93 MB/s 20 Streams, 31,292.20 MB/s 184 Streams, 47,546.68 MB/s 184 Streams, 48,190.46 MB/s 184 Streams, 59,810.01 MB/s 184 Streams, 59,486.68 MB/s 80 Streams, 34,763.83 MB/s 40 Streams, 35,532.23 MB/s 0 10,000 20,000 30,000 40,000 50,000 60,000 70,000 256KiB transfers with only Read operations 1024KiB transfers with only Read operations 256KiB transfers with 50% Read operations 50% Write operations 1024KiB transfers with 50% Read operations 50% Write operations 256KiB transfers with only Write operations 1024KiB transfers with only Write operations Data Rate, MB/sec Large File Processing - Data Rate SPC-2 BENCHMARK EXECUTION RESULTS Page 39 of 61 Large Database Query Test SPC BENCHMARK 2™ V1.7.0 Full Disclosure Report Vexata Inc. Submitted: August 29, 2018 VX100-F Scalable NVMe Flash Array Submission ID: B12004 Average Response Time The average Response Time, in milliseconds, for each Test Run in the two Test Phases of the SPC-2 Large Database Query Test is listed in the table below as well as illustrated in the following graph. Test Run Sequence 1 Stream Variable Streams Variable Streams Variable Streams Variable Streams 1024KiB w/ 4 IOs/Stream 0.50 1.26 1.26 2.52 2.66 1024KiB w/ 1 IO/Stream 0.45 0.61 0.68 1.08 2.00 64KiB w/ 4 IOs/Stream 0.11 0.15 0.17 0.26 0.50 64KiB w/ 1 IO/Stream 0.11 0.12 0.15 0.22 0.44 1 Stream, 0.11 ms 1 Stream, 0.11 ms 1 Stream, 0.45 ms 1 Stream, 0.50 ms 40 Streams, 0.12 ms 12 Streams, 0.15 ms 12 Streams, 0.61 ms 4 Streams, 1.26 ms 80 Streams, 0.15 ms 24 Streams, 0.17 ms 24 Streams, 0.68 ms 8 Streams, 1.26 ms 160 Streams, 0.22 ms 48 Streams, 0.26 ms 48 Streams, 1.08 ms 16 Streams, 2.52 ms 320 Streams, 0.44 ms 96 Streams, 0.50 ms 96 Streams, 2.00 ms 32 Streams, 2.66 ms 0 1 1 2 2 3 3 64KiB transfers with 1 IO outstanding per Stream 64KiB transfers with 4 IOs outstanding per Stream 1024KiB transfers with 1 IO outstanding per Stream 1024KiB transfers with 4 IOs outstanding per Stream Response Time, ms Large Database Query - Average Response Time
  24. SPC-1/2 Energy Extension ‣ kompletter Messzyklus ≥ 3 Tage ‣

    Temperaturmessung
 ➛ am Anfang der Idle-Tests
 ➛ während letzter Minute Last-Test ‣ RMS ≙ quadratischer Mittelwert
  25. SPC — Pricing (im Report) ‣ Hardware, Software, zusätzlich erforderliche

    Komponenten für
 Storage-Funktionalität, 3 Jahre Support, alle anfallenden Gebühren (Steuern, Zoll u. ä.) ‣ ausgenommen: HW für Benchmark-Setup ohne Storage-Funktion
 ➛ Server, die Workload erzeugen
 ➛ evtl. HBAs, FC-Switches, Verkabelung
 ➛ Fracht/Verpackung ‣ Projektpreise sind nicht erlaubt (»individually negotiated«)
 ➛ Wie aussagekräftig ist dann noch $/IOPS oder $/MBPS? ‣ Support ≙ 4h Response Time + 4h Vor-Ort-Service
 ➛ Vor-Ort = Ersatzteil und/oder Techniker
  26. Agenda ‣ Warum überhaupt Benchmarks?
 Aussagekraft, Herausforderungen, I/O-Stack, Tools ‣

    Storage Performance Council
 SPC-1, SPC-2, Industriestandard, Terminologie, Reports ‣Und was heißt das jetzt für’s Tagesgeschäft?
 Benchmarks selber programmieren?
 Benchmarks für die Beschaffung?
 Glaskugel
  27. SPC-1/2 selber bauen? ‣ ja, geht, und ist prinzipiell auch

    erlaubt
 ➛ aufwendig in der Entwicklung
 ➛ muss für offizielle Benchmarks von einem Auditor abgenommen werden $ cat spc1-preflight.vdbench *** *** vdbench Parameterfile to emulate SPC-1 workload *** ** storage definitions ** sd=asu11,lun=/dev/rdsk/c25t2100000E1E19FB51d0s2 sd=asu12,lun=/dev/rdsk/c25t2100000E1E19FB51d13s2 sd=asu21,lun=/dev/rdsk/c26t2100000E1E19F170d32s2 sd=asu22,lun=/dev/rdsk/c26t2100000E1E19F240d68s2 sd=asu31,lun=/dev/rdsk/c27t2100000E1E19F5A1d29s2 sd=asu32,lun=/dev/rdsk/c27t2100000E1E19FB71d39s2 sd=asu41,lun=/dev/rdsk/c28t2100000E1E19F1B1d21s2 sd=asu42,lun=/dev/rdsk/c28t2100000E1E19F261d8s2 ** workload definitions ** wd=asu111,sd=asu11,rdpct=50,xfersize=4k,skew=1 wd=asu112,sd=asu11,rdpct=50,xfersize=4k,skew=6,range=(15,20) wd=asu113,sd=asu11,rdpct=100,xfersize=(8k,40,16k,24,32k,20,64k,8,128k,8),skew=2,range=(40,50) wd=asu114,sd=asu11,rdpct=50,xfersize=4k,skew=5,range=(70,75) wd=asu121,sd=asu12,rdpct=30,xfersize=4k,skew=1 wd=asu122,sd=asu12,rdpct=30,xfersize=4k,skew=2,range=(47,52) wd=asu123,sd=asu12,rdpct=100,xfersize=(8k,40,16k,24,32k,20,64k,8,128k,8),skew=1,range=(40,50) wd=asu131,sd=asu13,rdpct=0,xfersize=(8k,40,16k,24,32k,20,64k,8,128k,8),skew=7,range=(35,65) … ** run definition (raw I/O) ** rd=spc1emu,wd=(asu111,asu112,asu113,asu114,asu121,…,),iorate=max,elapsed=300
  28. Benchmarks in der Storage-Beschaffung? ‣ Wie genau kennen Sie die

    im Unternehmen benötigten
 ➛ IOPS und MBPS,
 ➛ als Funktion der I/O-Blocksize,
 ➛ mit der Verteilung nach read/write? 㱺 Wie sind dann SPC-Werte zu bewerten? ‣ keine allgemeingültigen IOPS-Muster
 ➛ »Fingerprint« des Unternehmens, abhängig von vielen Faktoren/Randbedingungen ‣ Herstellerdarstellung immer »so große Zahl als wie gehen tut«
 ➛ Anpassen der Benchmark-Optionen ‣ Lösungen?
 ➛ umfangreicher, lange laufender PoC (aufwendig)
 ➛ flexibles, in alle Richtungen skalierbares Storage (»Wollmilchsau«)
  29. Glaskugel — Was bringt die Zukunft? ‣ Cloud Storage (public

    und private)
 ➛ viel Software involviert, mehrere Abstraktionslayer
 ➛ COSbench ‣ Solid State Memory (NAND Flash, Optane u. a.)
 ➛ keine »bremsende« Mechanik mehr
 ➛ Applikations-Debugging kann Thema werden, wenn plötzlich
 Bottleneck ≠ Storage wird (z. B. komplexe oder »kaputte« SQL Queries) Bootlenecks verschieben sich nur durch das System, verschwinden aber nicht.
  30. Quellen und »further learning« ‣ Spezifikationen zu den SPC-1/2 Benchmarks


    https://spcresults.org/benchmarks ‣ Avishay Traeger et al.
 A Nine Year Study of File System and Storage Benchmarking
 https://www.fsl.cs.sunysb.edu/docs/fsbench/fsbench.pdf ‣ Brendan Gregg
 Broken Linux Performance Tools
 SCALE 14x, 2016
 https://www.youtube.com/watch?v=OPio8V-z03c ‣ Raj Jain
 The Art of Computer Systems Performance Analysis
 John Wiley & Sons, Inc., 1991
  31. Vielen Dank für Ihre Teilnahme am Live-Webinar Moderator:
 Karl Fröhlich


    speicherguide.de Referent:
 Wolfgang Stief
 Erklärbär, sys4 AG speicherguide.de [email protected] @SpeicherKarl (Twitter) sys4.de [email protected] @stiefkind (Twitter) Weitere Informationen: