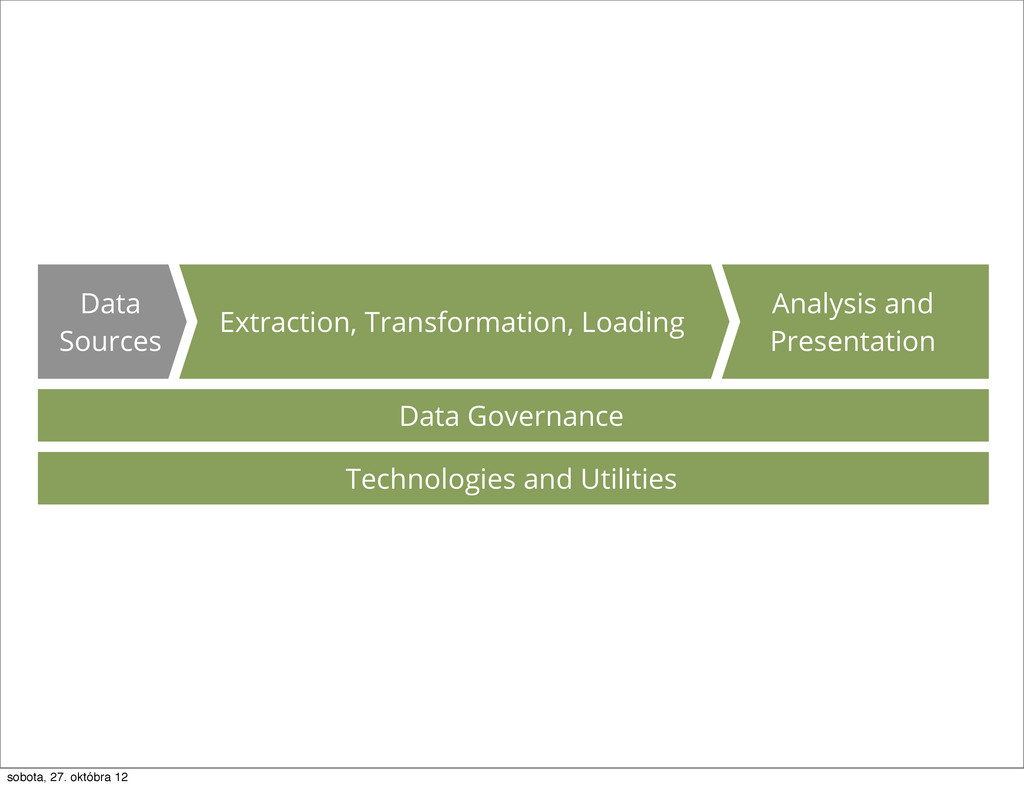
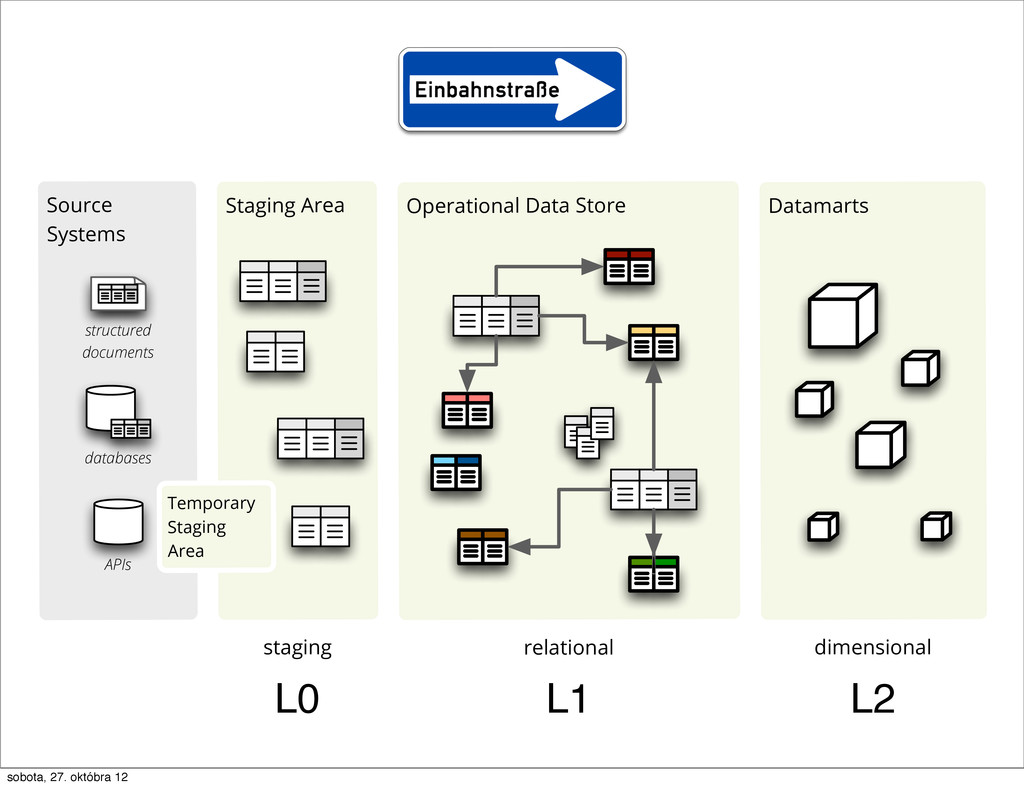
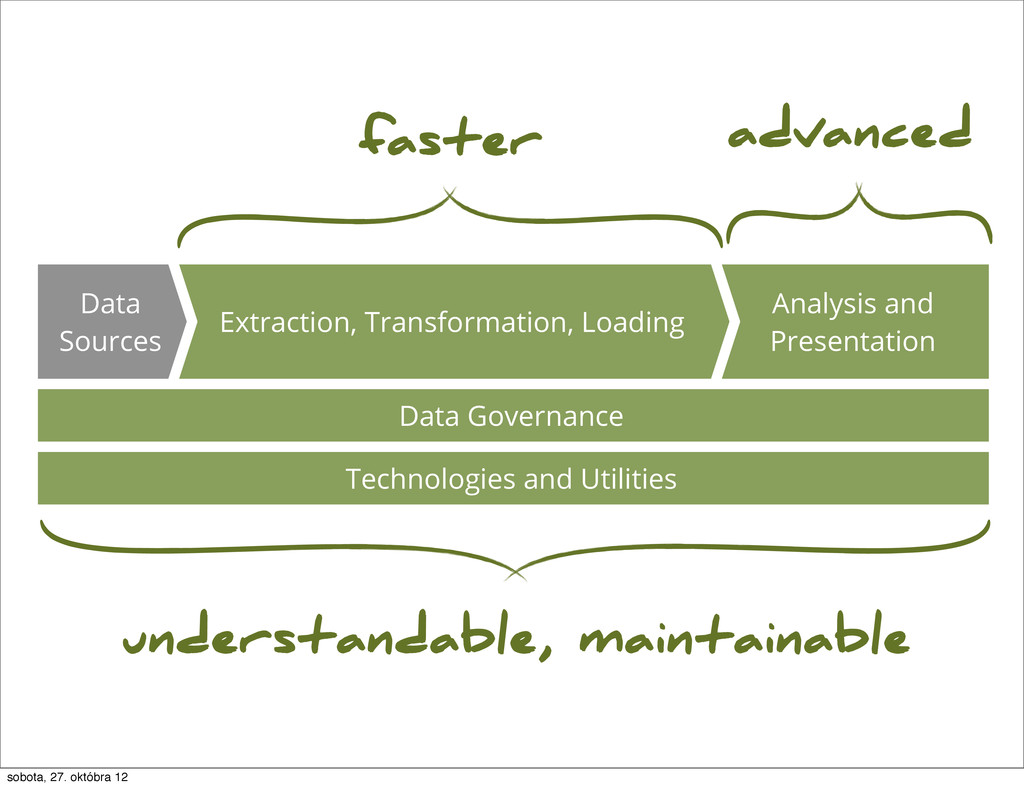
Upgrade to Pro — share decks privately, control downloads, hide ads and more …

Business Intelligence in Python

Business Intelligence in Python

What is the state of BI and python.

Stefan Urbanek

October 27, 2012
Tweet

More Decks by Stefan Urbanek

Other Decks in Technology

Transcript

  1. Python for Business
    Intelligence
    Štefan Urbánek ■ @Stiivi ■ [email protected] ■ October 2012
    sobota, 27. októbra 12

    View Slide

  2. python business intelligence
    )
    sobota, 27. októbra 12

    View Slide

  3. Q/A and articles with Java
    solution references
    (not listed here)
    Results
    sobota, 27. októbra 12

    View Slide

  4. sobota, 27. októbra 12

    View Slide

  5. Why?
    sobota, 27. októbra 12

    View Slide

  6. Overview
    ■ Traditional Data Warehouse
    ■ Python and Data
    ■ Is Python Capable?
    ■ Conclusion
    sobota, 27. októbra 12

    View Slide

  7. Business
    Intelligence
    sobota, 27. októbra 12

    View Slide

  8. people
    technology processes
    sobota, 27. októbra 12

    View Slide

  9. Data Governance
    Analysis and
    Presentation
    Extraction, Transformation, Loading
    Data
    Sources
    Technologies and Utilities
    sobota, 27. októbra 12

    View Slide

  10. Traditional Data
    Warehouse
    sobota, 27. októbra 12

    View Slide

  11. ■ Extracting data from the original sources
    ■ Quality assuring and cleaning data
    ■ Conforming the labels and measures
    in the data to achieve consistency across the original sources
    ■ Delivering data in a physical format that can be used by
    query tools, report writers, and dashboards.
    Source: Ralph Kimball – The Data Warehouse ETL Toolkit
    sobota, 27. októbra 12

    View Slide

  12. Source
    Systems
    Staging Area Operational Data Store Datamarts
    structured
    documents
    databases
    APIs
    Temporary
    Staging
    Area
    staging relational dimensional
    L0 L1 L2
    sobota, 27. októbra 12

    View Slide

  13. real time = daily
    sobota, 27. októbra 12

    View Slide

  14. Multi-dimensional
    Modeling
    sobota, 27. októbra 12

    View Slide

  15. sobota, 27. októbra 12

    View Slide

  16. aggregation browsing
    slicing and dicing
    sobota, 27. októbra 12

    View Slide

  17. business / analyst’s
    point of view
    regardless of physical schema implementation
    sobota, 27. októbra 12

    View Slide

  18. Facts
    fact
    most detailed information
    measurable
    fact data cell
    sobota, 27. októbra 12

    View Slide

  19. dimensions
    location
    type
    time
    sobota, 27. októbra 12

    View Slide

  20. ■ provide context for facts
    ■ used to filter queries or reports
    ■ control scope of aggregation of facts
    Dimension
    sobota, 27. októbra 12

    View Slide

  21. Pentaho
    sobota, 27. októbra 12

    View Slide

  22. Python and Data
    community perception*
    *as of Oct 2012
    sobota, 27. októbra 12

    View Slide

  23. Scientific & Financial
    sobota, 27. októbra 12

    View Slide

  24. Python
    sobota, 27. októbra 12

    View Slide

  25. Data Governance
    Analysis and
    Presentation
    Extraction, Transformation, Loading
    Data
    Sources
    Technologies and Utilities
    sobota, 27. októbra 12

    View Slide

  26. T1[s] T2[s] T3[s] T4[s]
    P1 392,55 25,04 367,51 520,27
    P2 920,00 776,71 360,03 989,75
    P3 877,14 784,61 502,41 786,96
    P4 997,65 527,45 447,87 504,76
    P5 752,58 237,17 549,78 287,02
    n-dimensional array of numbers
    Scientific Data
    sobota, 27. októbra 12

    View Slide

  27. Assumptions
    ■ data is mostly numbers
    ■ data is neatly organized...
    ■ … in one multi-dimensional array
    sobota, 27. októbra 12

    View Slide

  28. Data Governance
    Analysis and
    Presentation
    Extraction, Transformation, Loading
    Data
    Sources
    Technologies and Utilities
    sobota, 27. októbra 12

    View Slide

  29. Business Data
    sobota, 27. októbra 12

    View Slide

  30. multiple representations
    of same data
    multiple snapshots of one source
    categories are
    changing
    sobota, 27. októbra 12

    View Slide


  31. sobota, 27. októbra 12

    View Slide

  32. Is Python Capable?
    very basic examples
    sobota, 27. októbra 12

    View Slide

  33. Data Pipes with
    SQLAlchemy
    Data Governance
    Analysis and
    Presentation
    Extraction, Transformation, Loading
    Data
    Sources
    Technologies and Utilities
    sobota, 27. októbra 12

    View Slide

  34. ■ connection: create_engine
    ■ schema reflection: MetaData, Table
    ■ expressions: select(), insert()
    sobota, 27. októbra 12

    View Slide

  35. src_engine = create_engine("sqlite:///data.sqlite")
    src_metadata = MetaData(bind=src_engine)
    src_table = Table('data', src_metadata, autoload=True)
    target_engine = create_engine("postgres://localhost/sandbox")
    target_metadata = MetaData(bind=target_engine)
    target_table = Table('data', target_metadata)
    sobota, 27. októbra 12

    View Slide

  36. for column in src_table.columns:
    target_table.append_column(column.copy())
    target_table.create()
    insert = target_table.insert()
    for row in src_table.select().execute():
    insert.execute(row)
    clone schema:
    copy data:
    sobota, 27. októbra 12

    View Slide

  37. magic used:
    metadata reflection
    sobota, 27. októbra 12

    View Slide

  38. reader = csv.reader(file_stream)
    columns = reader.next()
    for column in columns:
    table.append_column(Column(column, String))
    table.create()
    for row in reader:
    insert.execute(row)
    text file (CSV) to table:
    sobota, 27. októbra 12

    View Slide

  39. Simple T from ETL
    Data Governance
    Analysis and
    Presentation
    Extraction, Transformation, Loading
    Data
    Sources
    Technologies and Utilities
    sobota, 27. októbra 12

    View Slide

  40. transformation = [
    ('fiscal_year', {"w function": int,
    ". field":"fiscal_year"}),
    ('region_code', {"4 mapping": region_map,
    ". field":"region"}),
    ('borrower_country', None),
    ('project_name', None),
    ('procurement_type', None),
    ('major_sector_code', {"4 mapping": sector_code_map,
    ". field":"major_sector"}),
    ('major_sector', None),
    ('supplier', None),
    ('contract_amount', {"w function": currency_to_number,
    ". field": 'total_contract_amount'}
    ]
    target fields source transformations
    sobota, 27. októbra 12

    View Slide

  41. for row in source:
    result = transform(row, [ transformation)
    table.insert(result).execute()
    Transformation
    sobota, 27. októbra 12

    View Slide

  42. OLAP with Cubes
    Data Governance
    Analysis and
    Presentation
    Extraction, Transformation, Loading
    Data
    Sources
    Technologies and Utilities
    sobota, 27. októbra 12

    View Slide

  43. cubes dimensions
    measures levels, attributes, hierarchy
    Model
    {
    “name” = “My Model”
    “description” = ....
    “cubes” = [...]
    “dimensions” = [...]
    }
    sobota, 27. októbra 12

    View Slide


  44. logical
    physical
    sobota, 27. októbra 12

    View Slide

  45. workspace.browser(cube)
    load_model("model.json")
    create_workspace("sql",
    model,
    url="sqlite:///data.sqlite")
    model.cube("sales")
    Aggregation Browser
    backend
    cubes
    Application

    1
    2
    3
    4
    sobota, 27. októbra 12

    View Slide

  46. browser.aggregate(o cell,
    . drilldown=[9 "sector"])
    drill-down
    sobota, 27. októbra 12

    View Slide

  47. q row.label k row.key
    for row in result.table_rows(“sector”):
    row.record["amount_sum"]
    sobota, 27. októbra 12

    View Slide

  48. ✂ cut = PointCut(9 “date”, [2010])
    o cell = o 
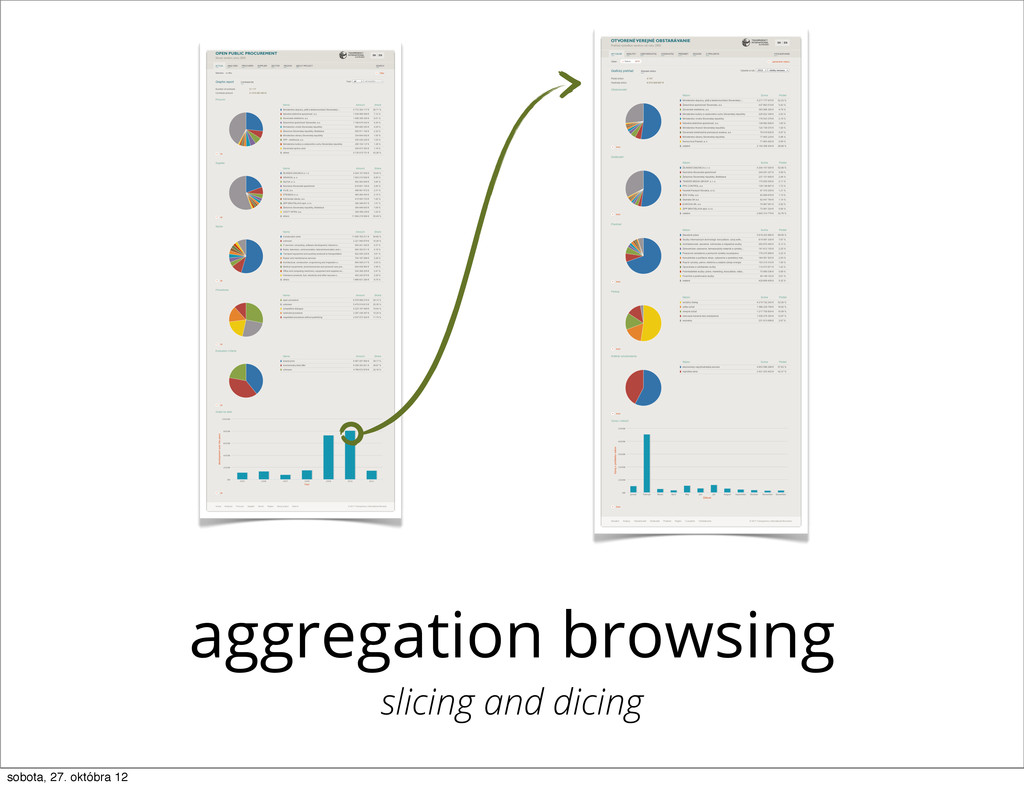
cell.slice(✂ cut)
    browser.aggregate(o cell,
    drilldown=[9 “date”])
    2006 2007 2008 2009 2010
    Total
    Jan Feb Mar Apr March April May ...
    whole cube
    o cell = Cell(cube)
    browser.aggregate(o cell)
    browser.aggregate(o cell,
    drilldown=[9 “date”])
    sobota, 27. októbra 12

    View Slide

  49. How can Python
    be Useful
    sobota, 27. októbra 12

    View Slide

  50. ■ saves maintenance resources
    ■ shortens development time
    ■ saves your from going insane
    Language
    just the
    sobota, 27. októbra 12

    View Slide

  51. Source
    Systems
    Staging Area Operational Data Store Datamarts
    structured
    documents
    databases
    APIs
    Temporary
    Staging
    Area
    staging relational dimensional
    L0 L1 L2
    faster
    sobota, 27. októbra 12

    View Slide

  52. Data Governance
    Analysis and
    Presentation
    Extraction, Transformation, Loading
    Data
    Sources
    Technologies and Utilities
    faster advanced
    understandable, maintainable
    sobota, 27. októbra 12

    View Slide

  53. Conclusion
    sobota, 27. októbra 12

    View Slide

  54. people
    technology processes
    BI is about…
    sobota, 27. októbra 12

    View Slide

  55. don’t forget
    metadata
    sobota, 27. októbra 12

    View Slide

  56. who is going to fix your COBOL Java tool
    if you have only Python guys around?
    Future
    sobota, 27. októbra 12

    View Slide

  57. is capable, let’s start
    sobota, 27. októbra 12

    View Slide

  58. Thank You
    Twitter:
    @Stiivi
    DataBrewery blog:
    blog.databrewery.org
    Github:
    github.com/Stiivi
    [t\
    sobota, 27. októbra 12

    View Slide