$30 off During Our Annual Pro Sale. View Details »

VIESORE: Visual impact evaluation system for offshore renewable energy

Chad Cooper
September 25, 2012

VIESORE: Visual impact evaluation system for offshore renewable energy

Presented at the Mid-America GIS Consortium 2012 Conference in Kansas City, MO

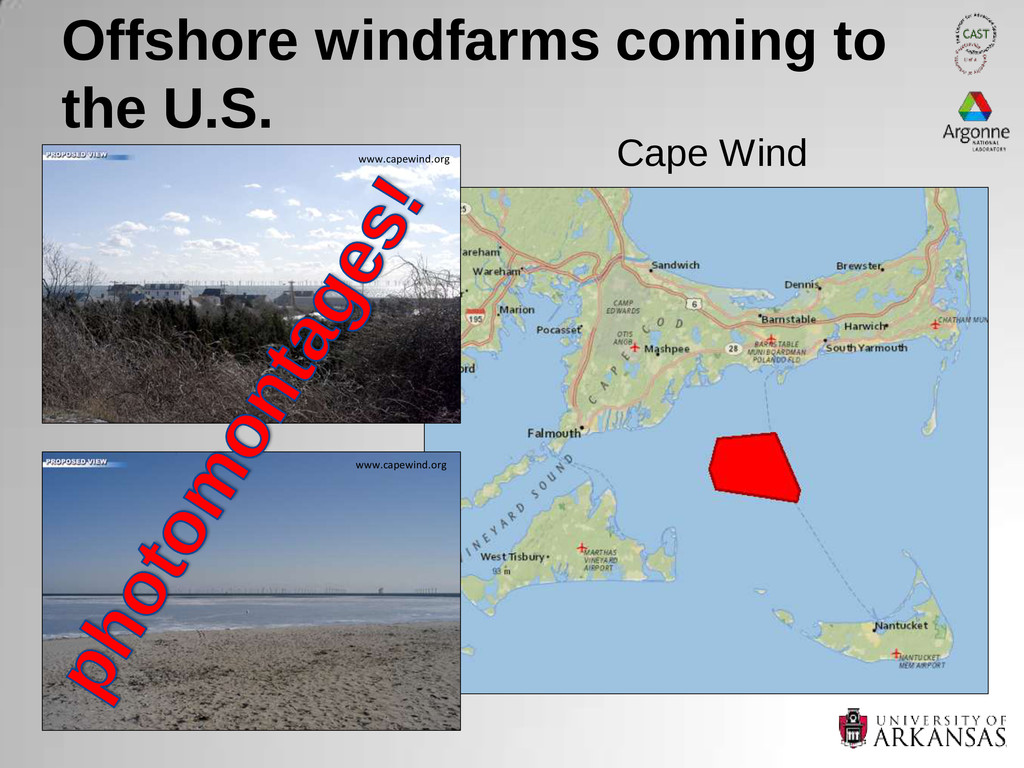
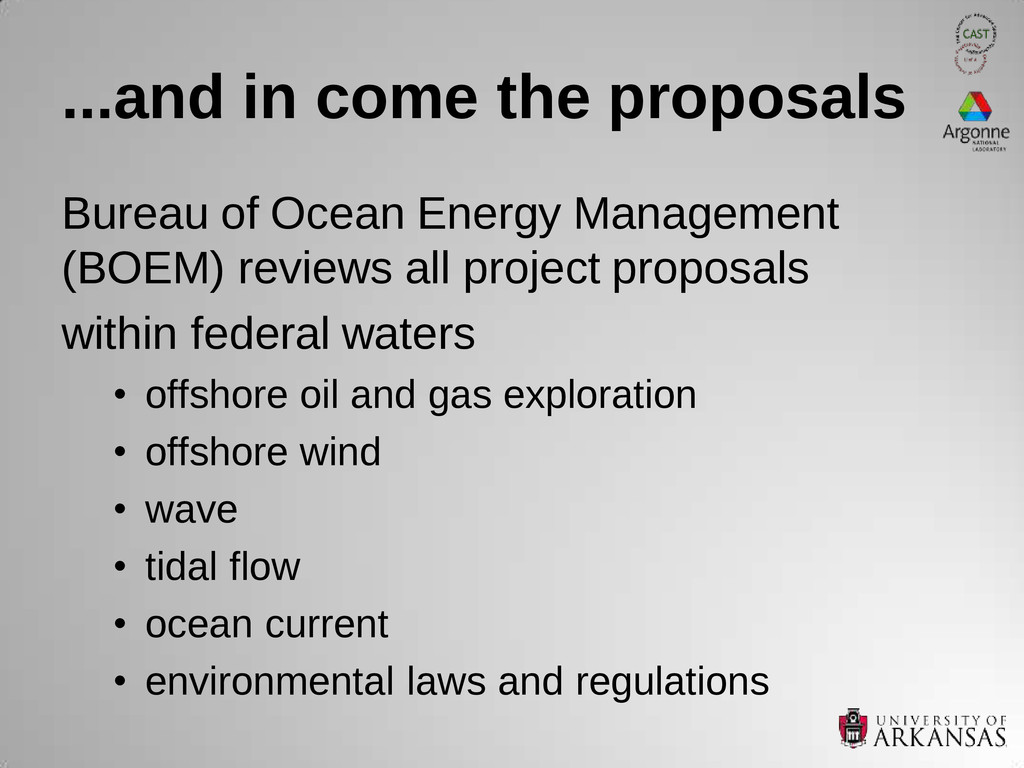
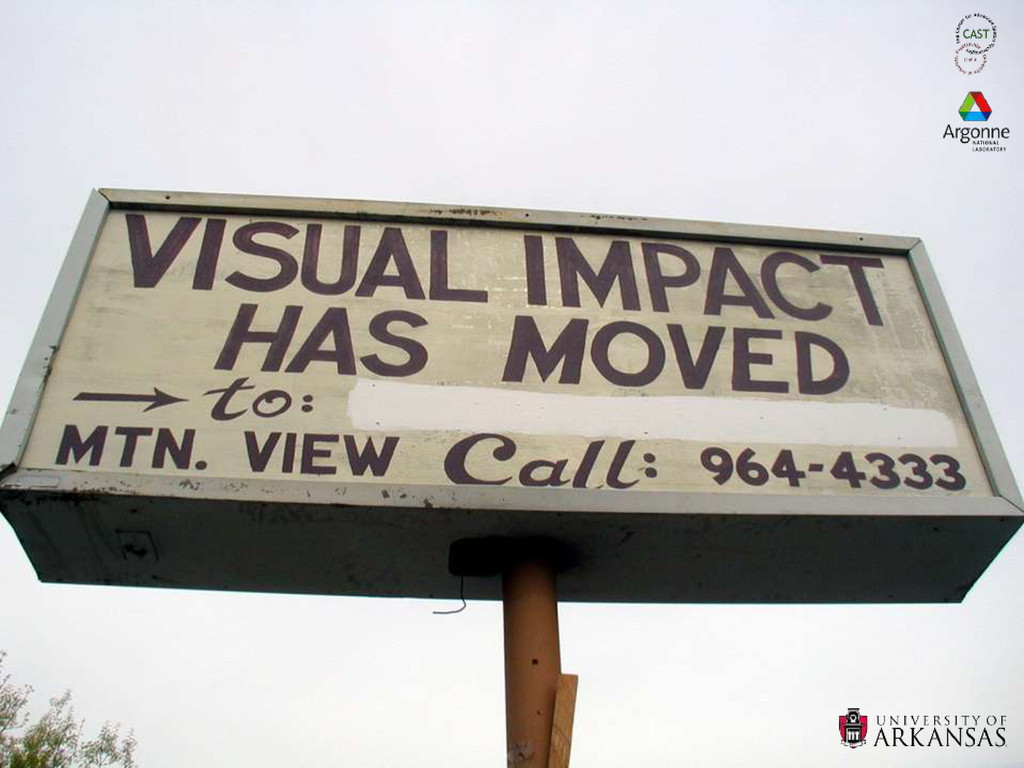
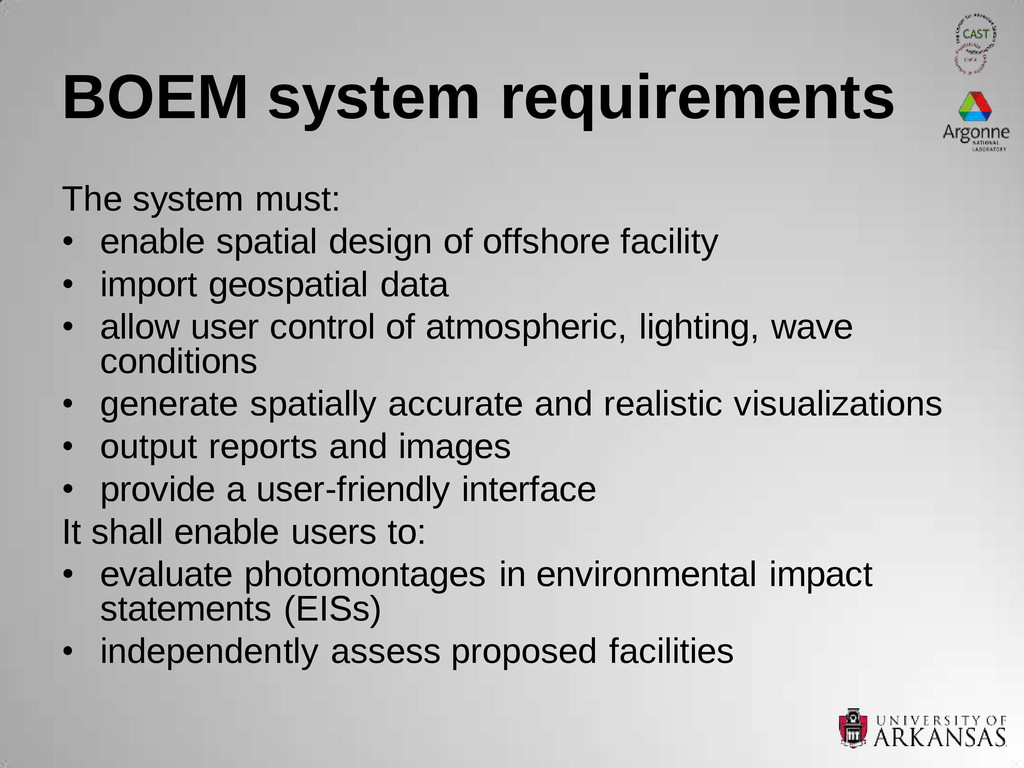
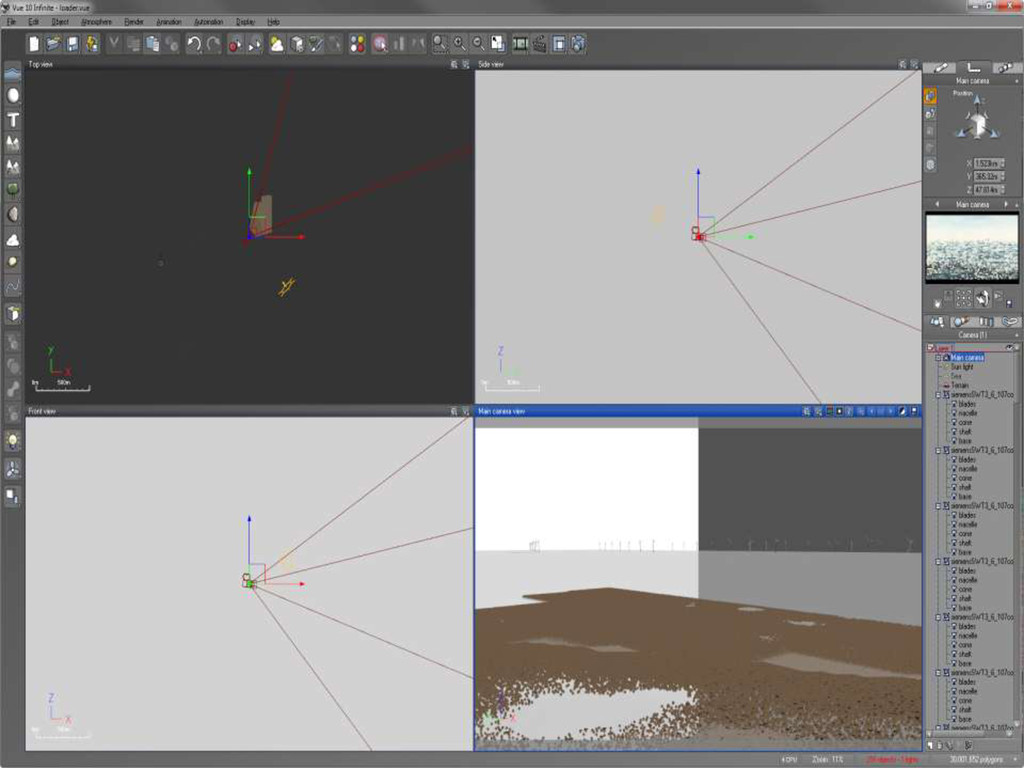
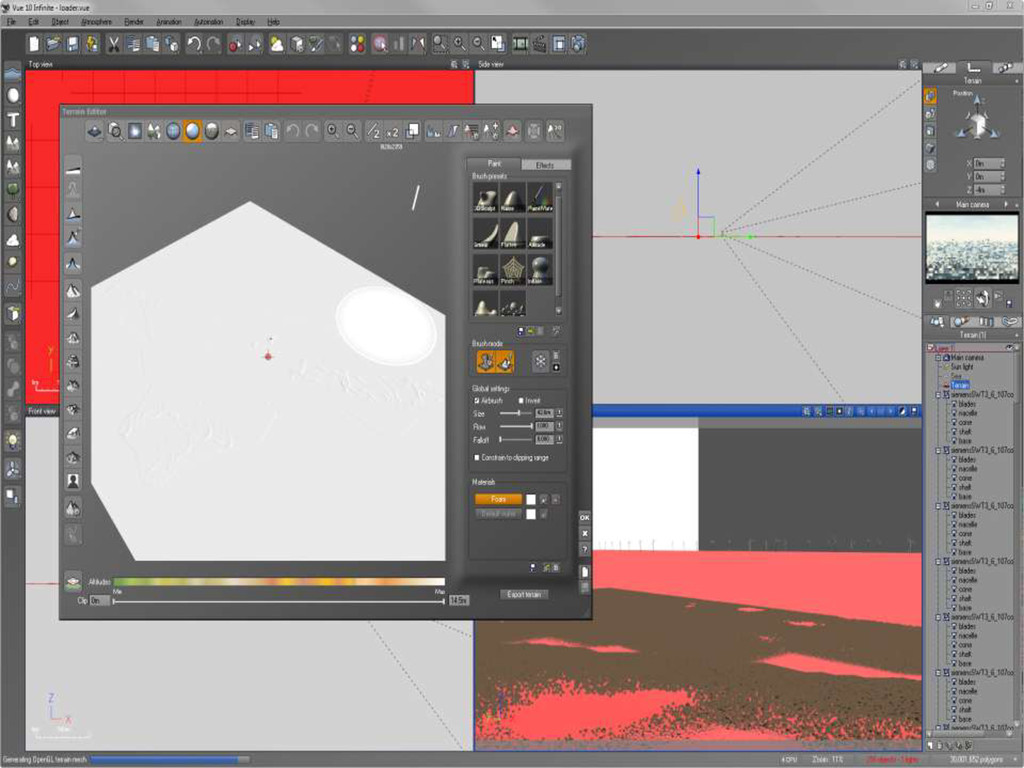
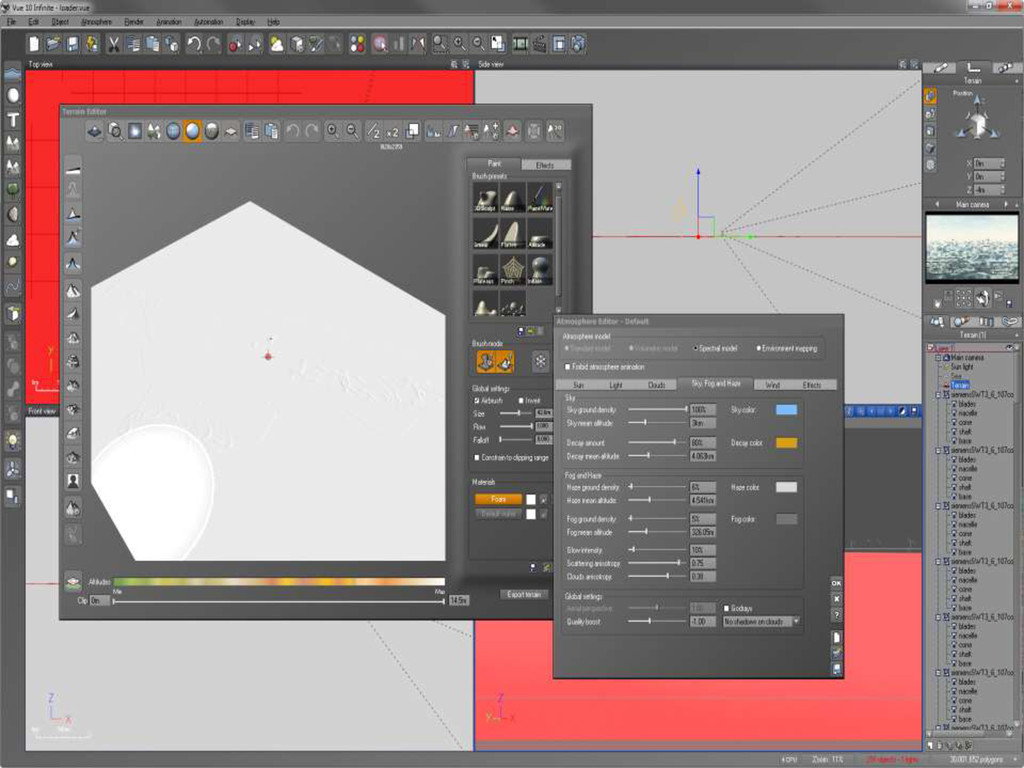
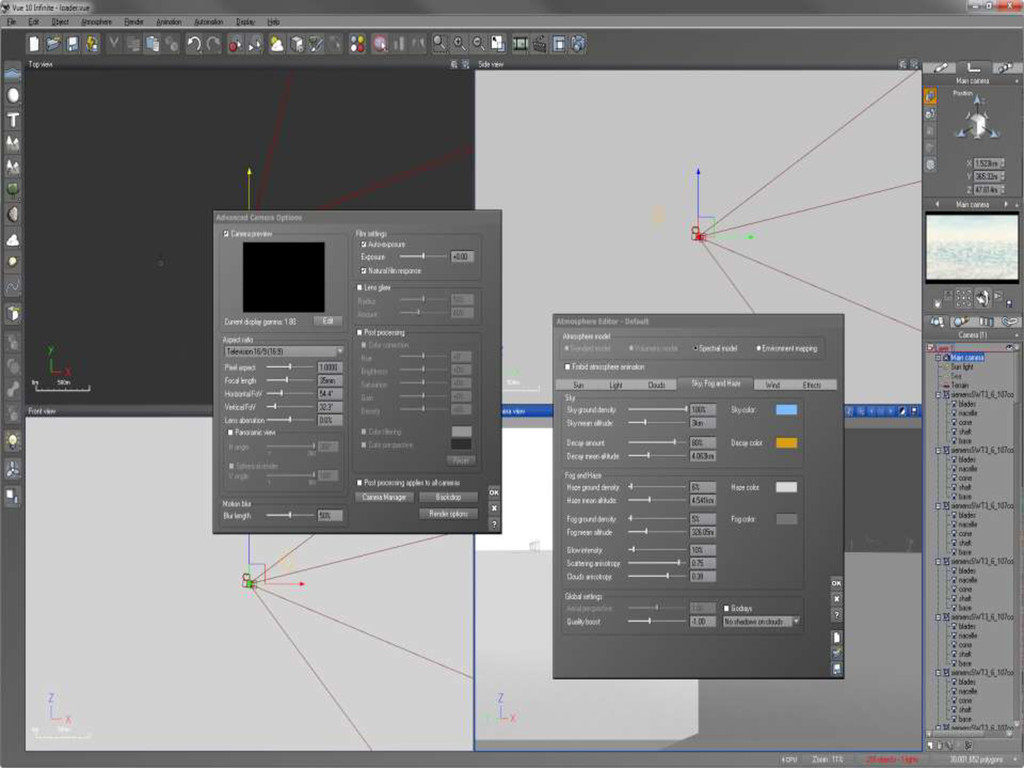
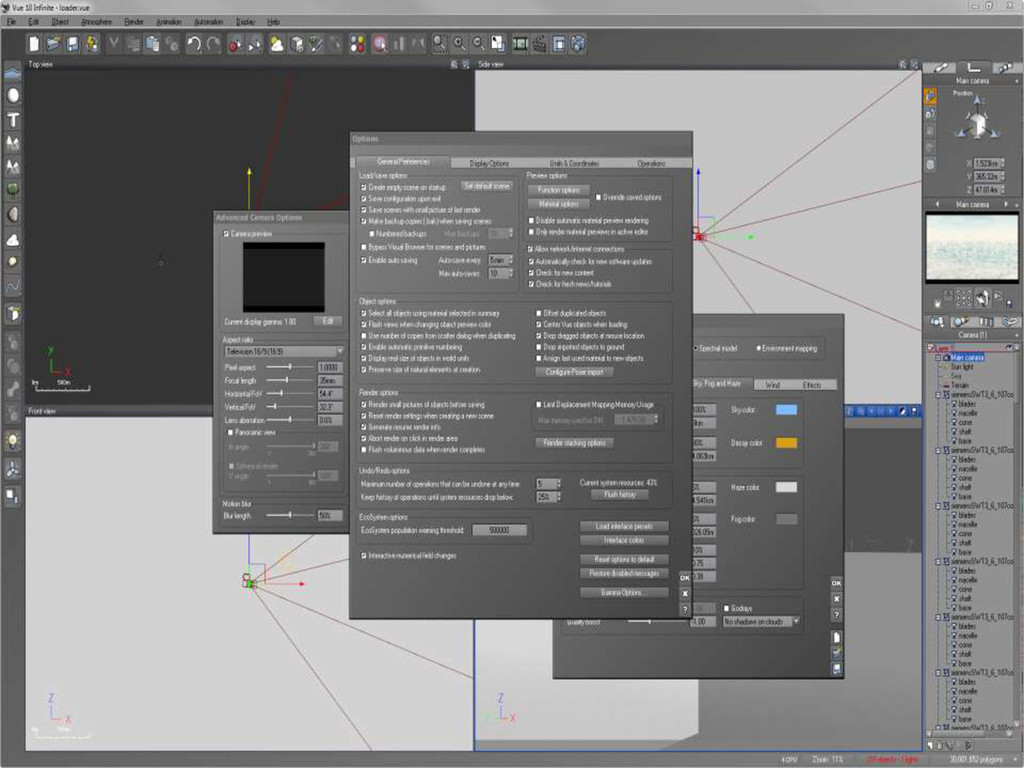
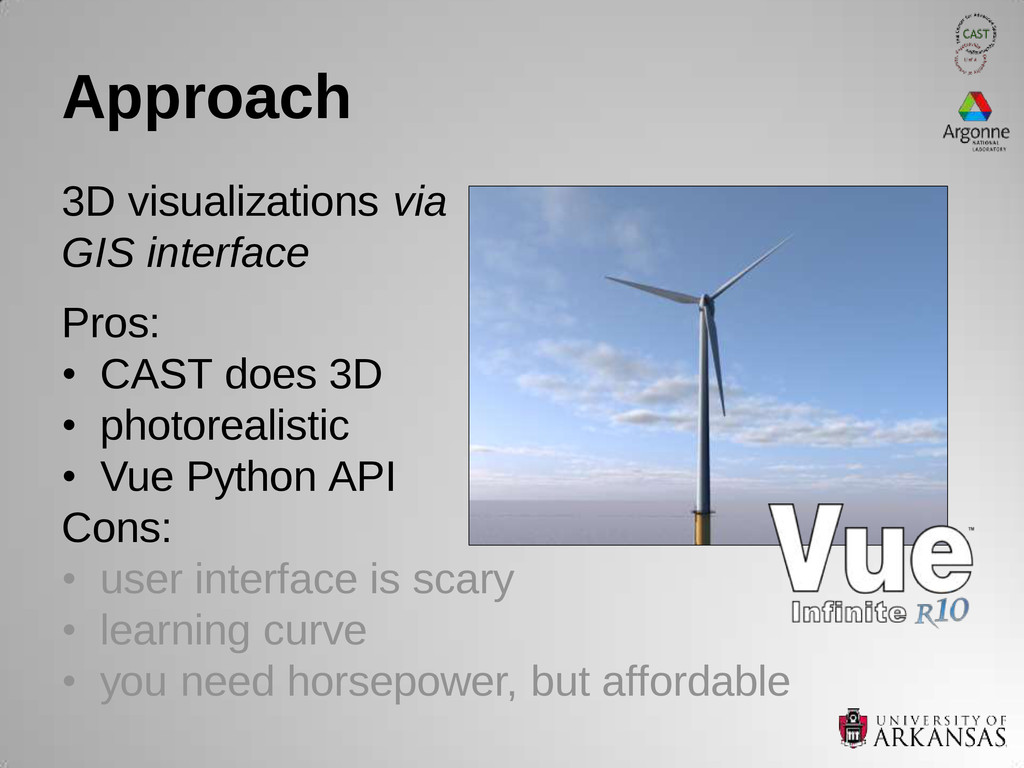
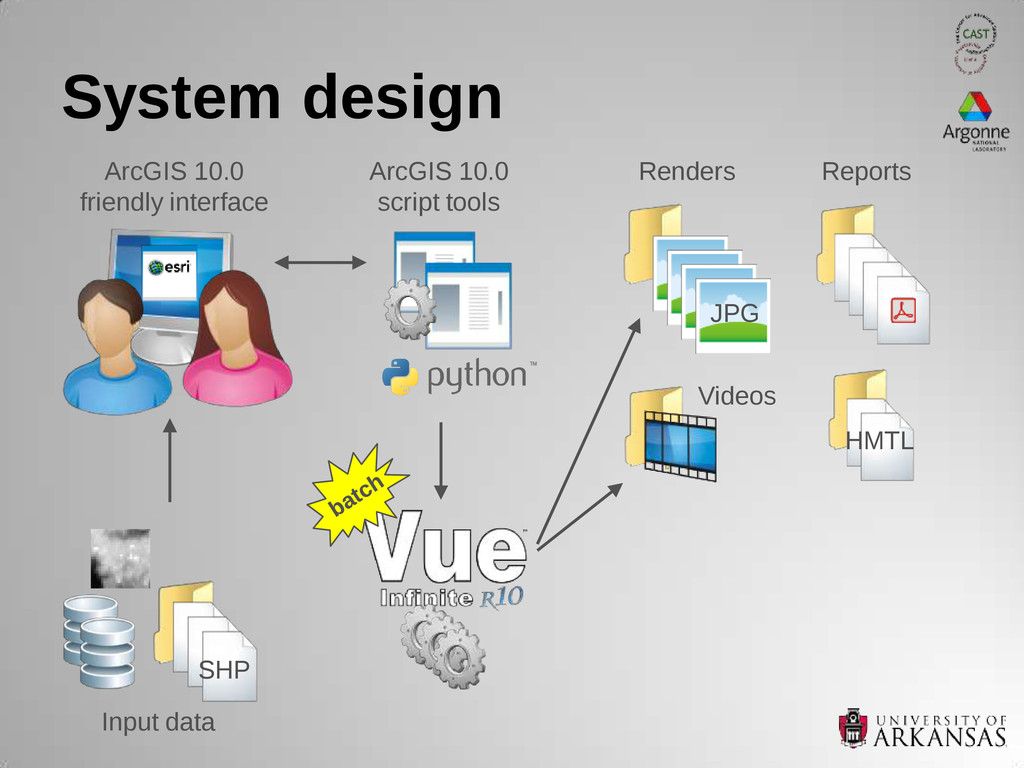
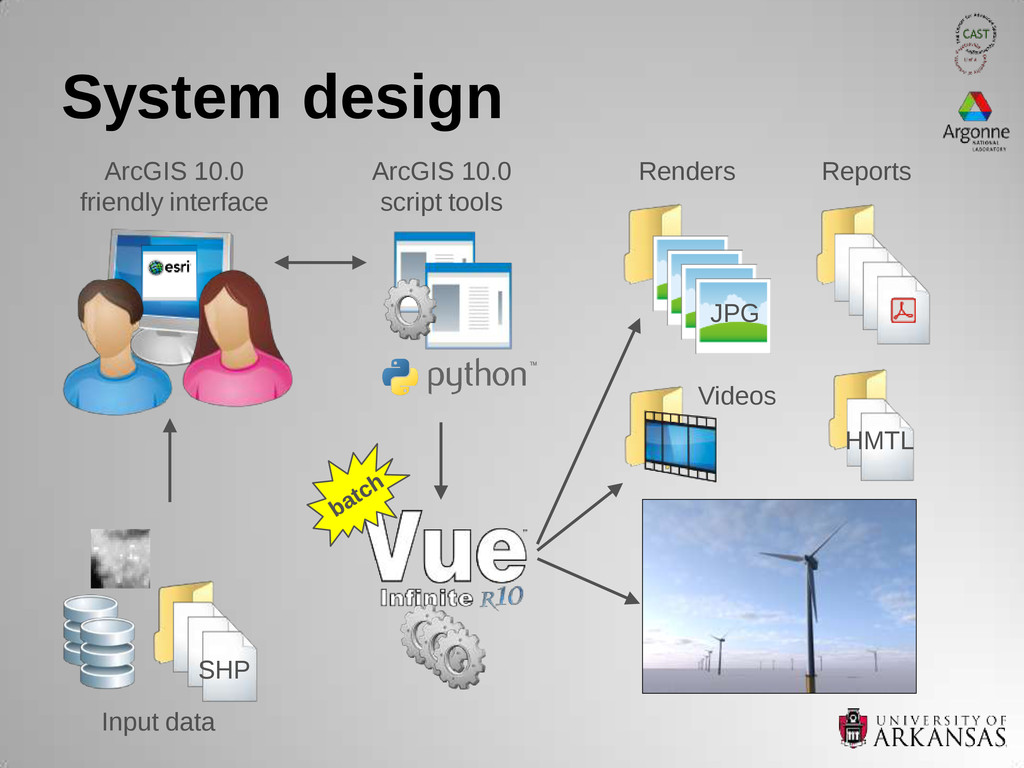
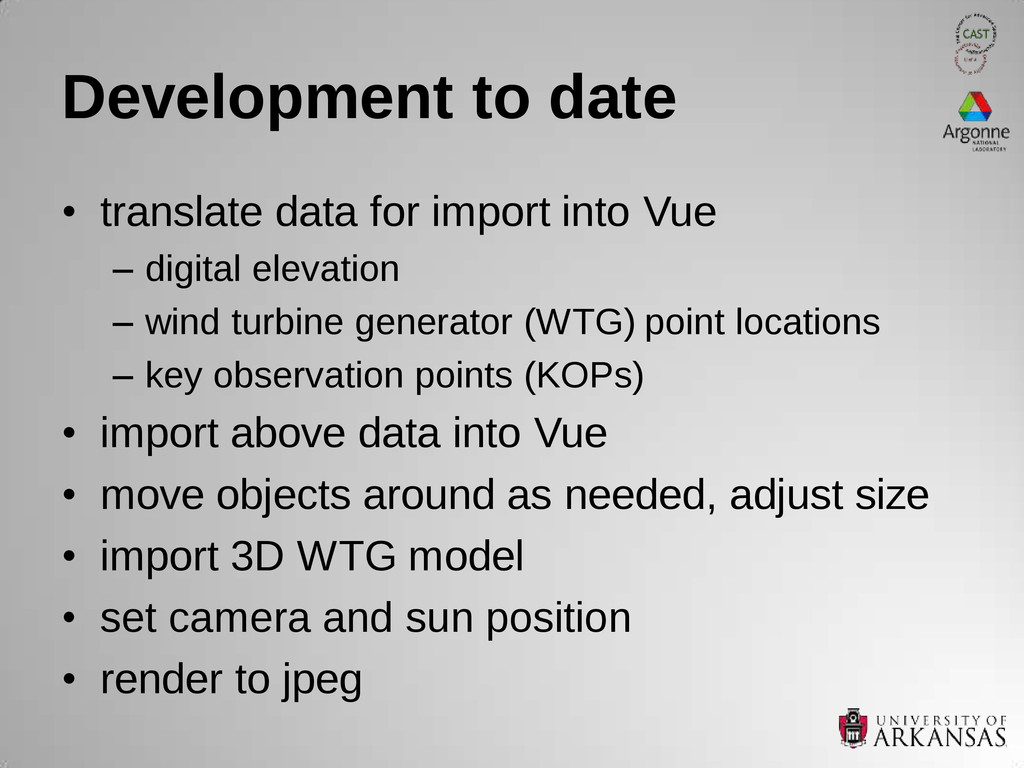
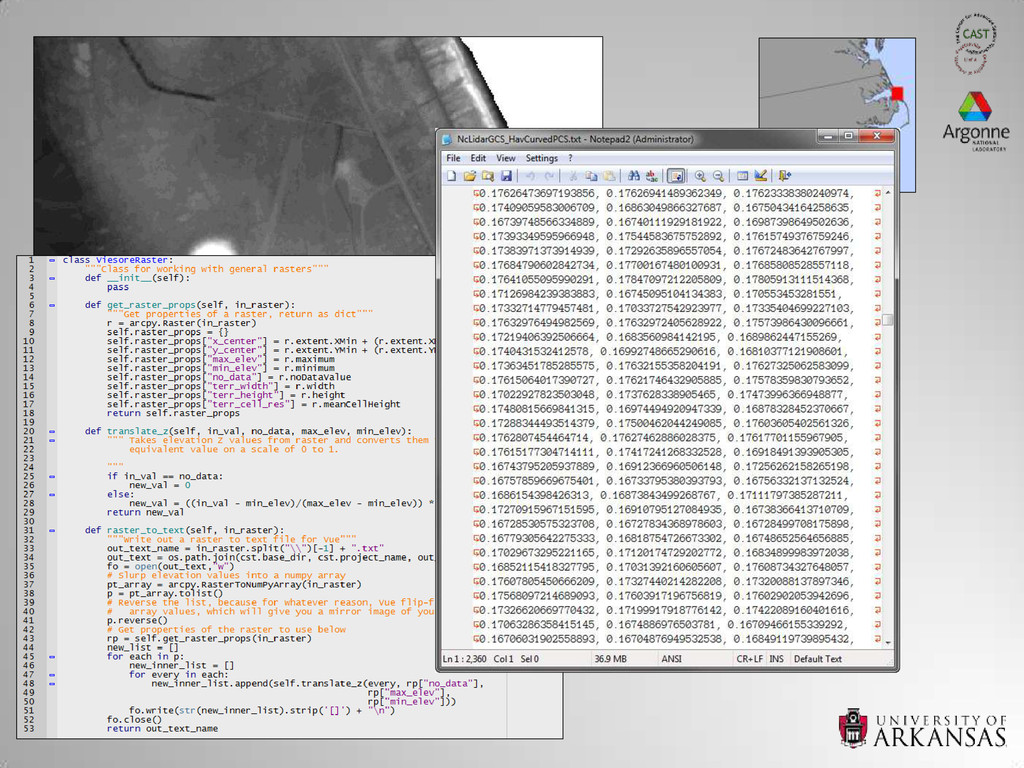
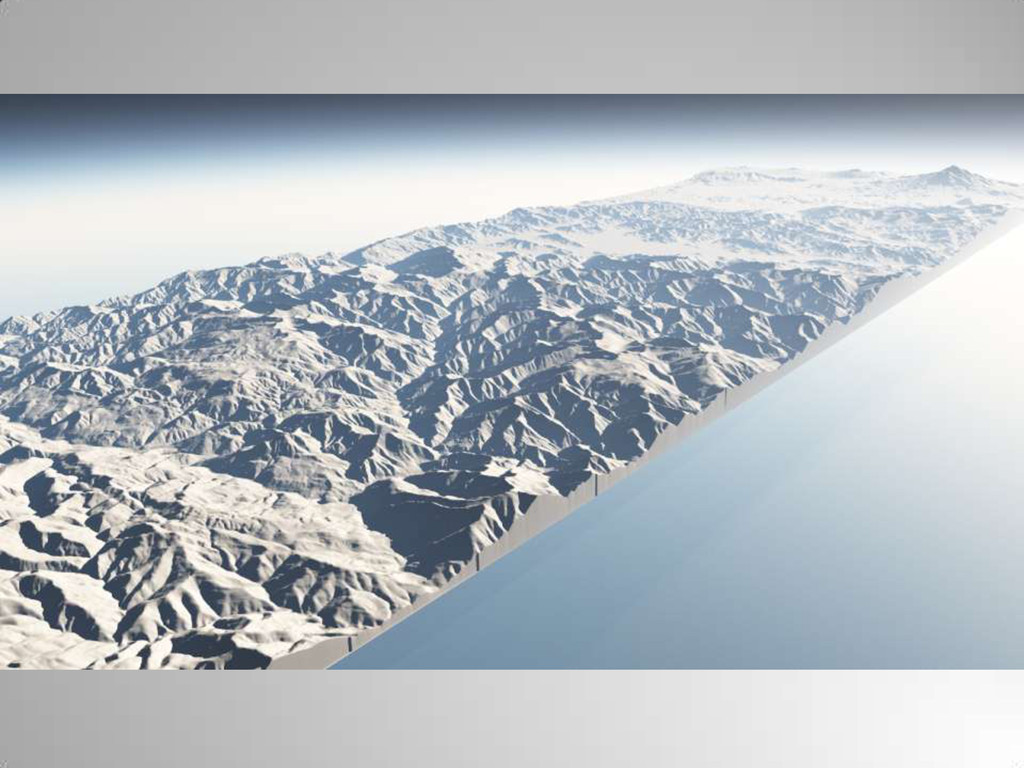
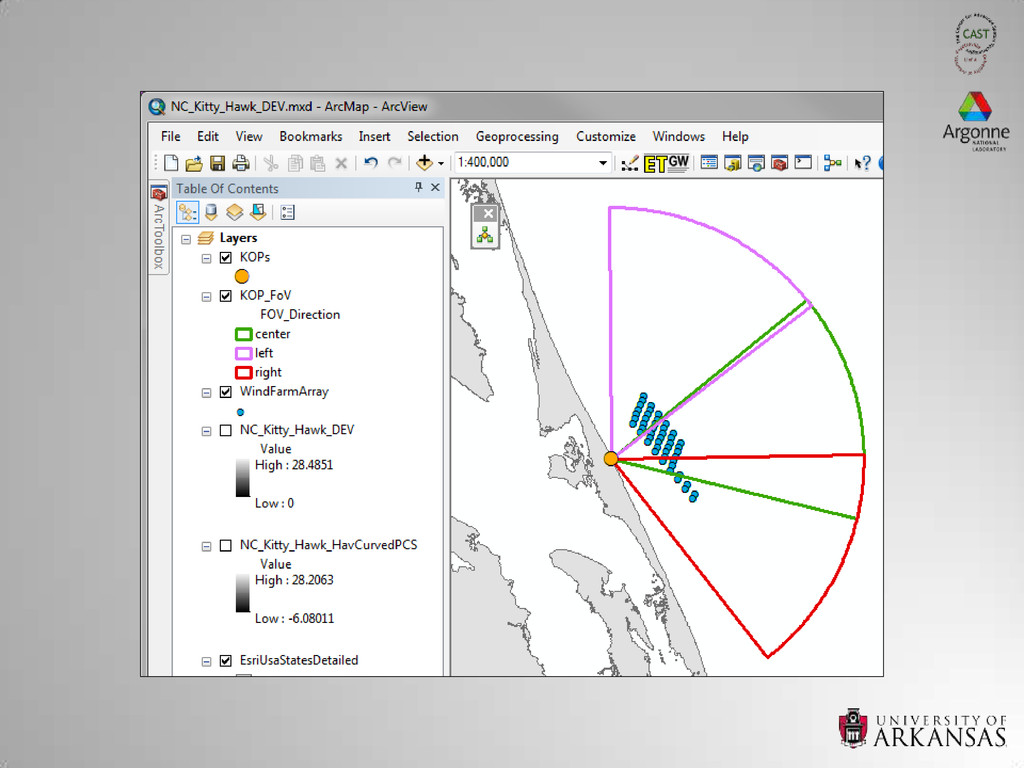
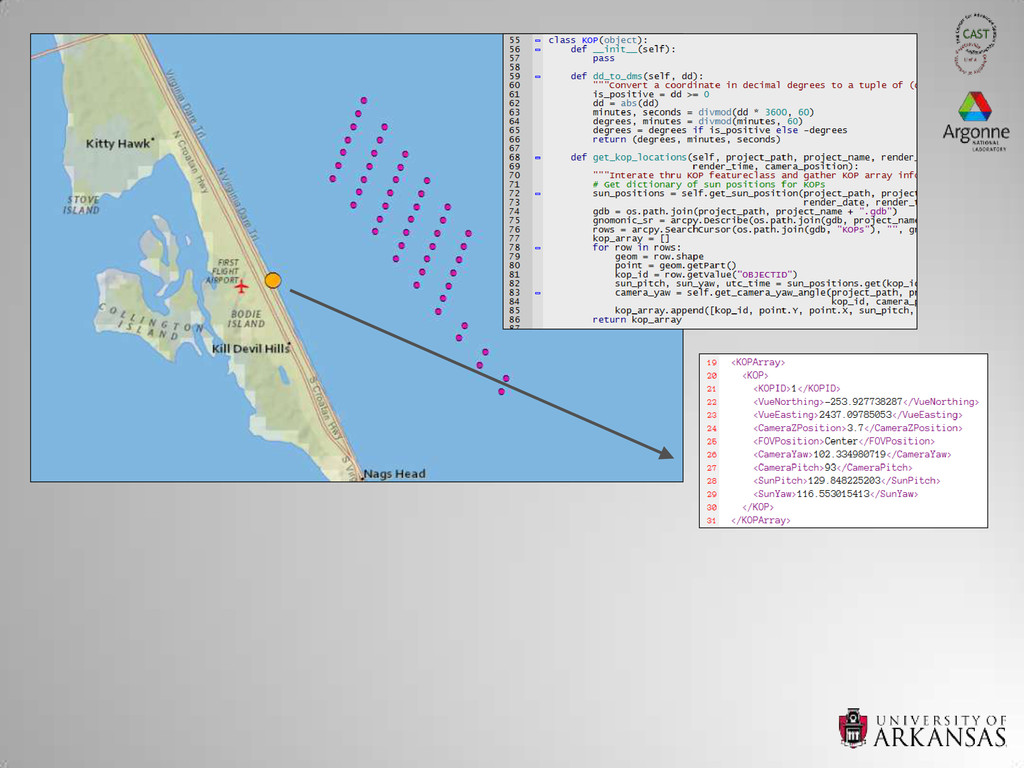
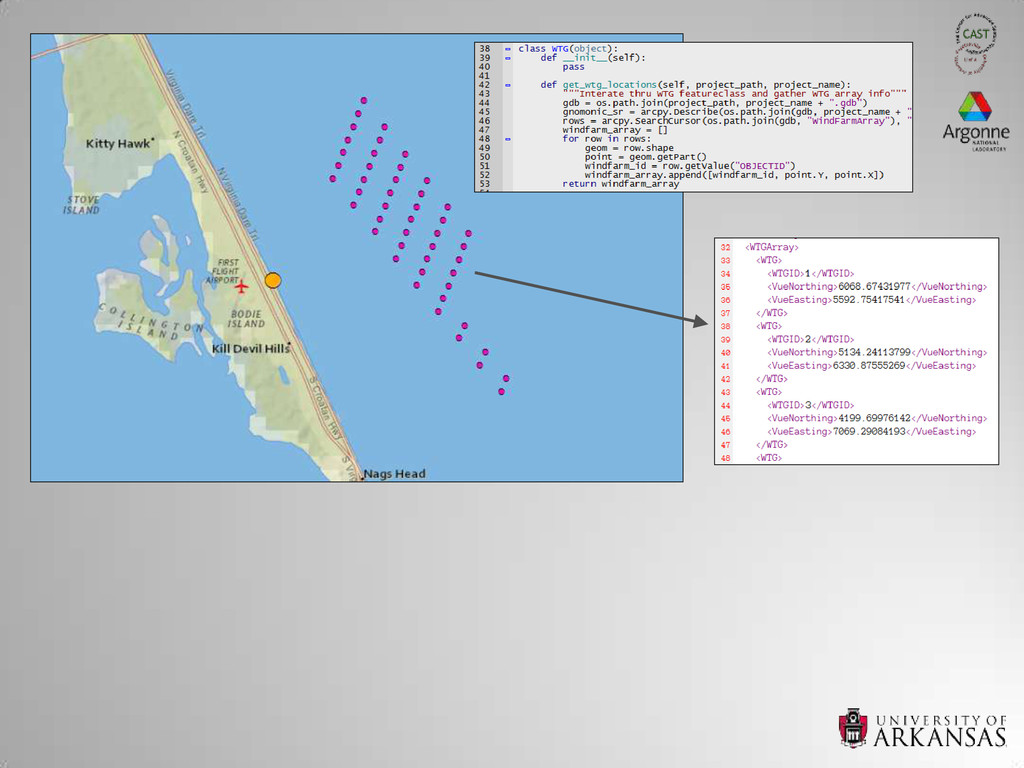
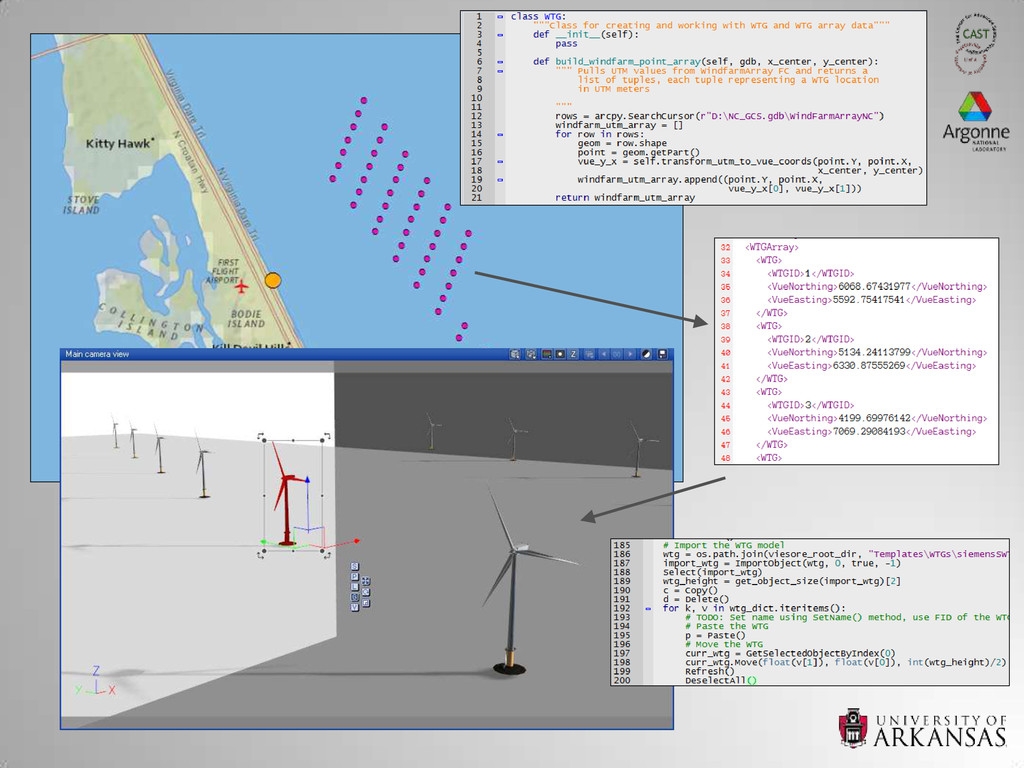
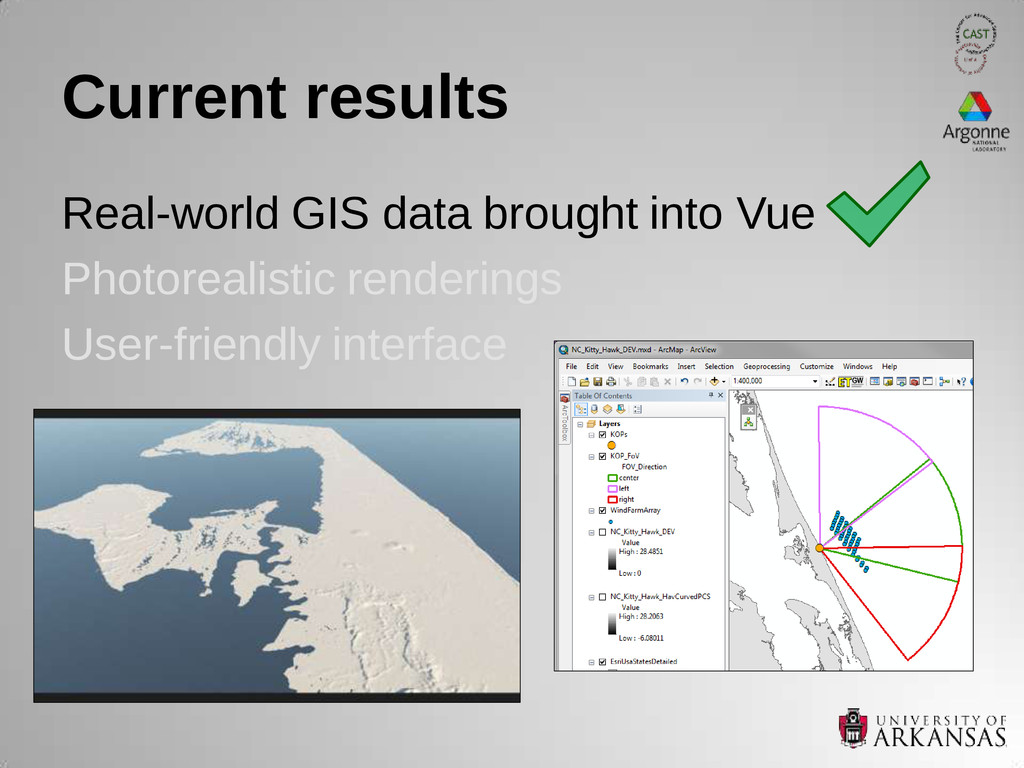
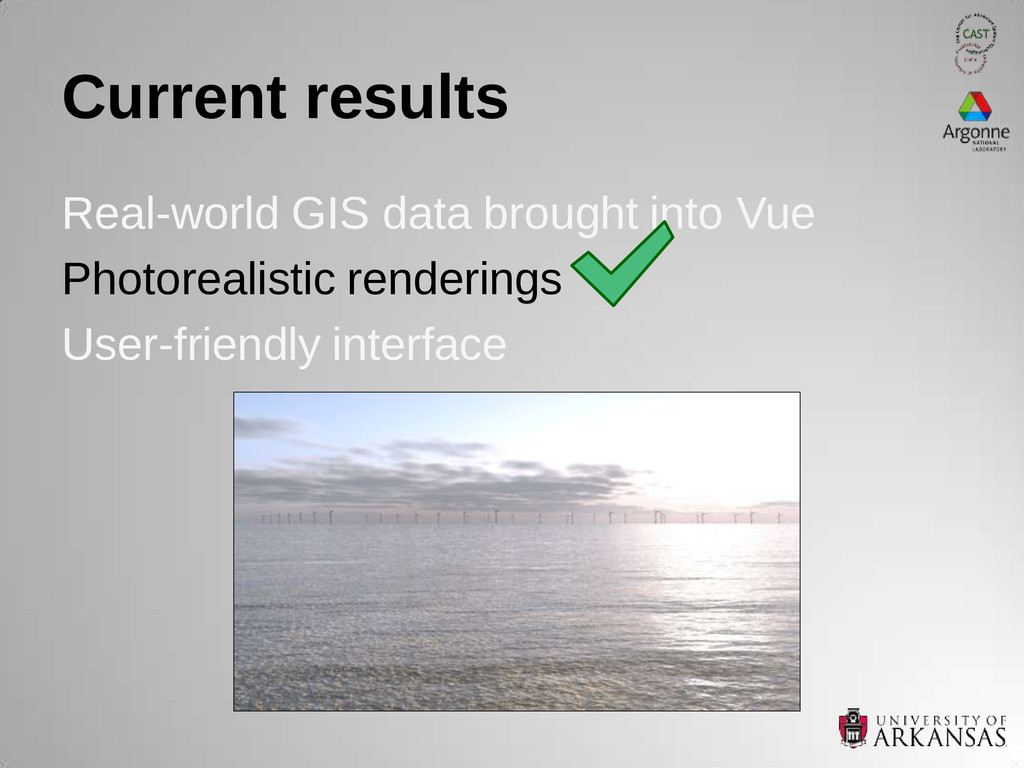
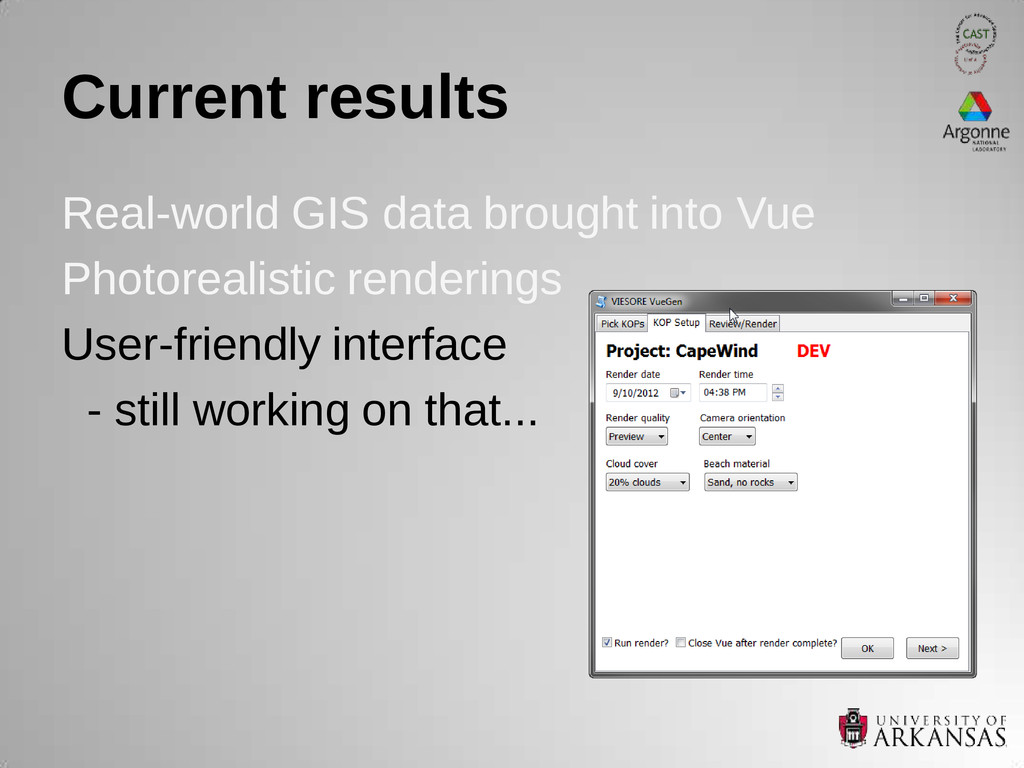
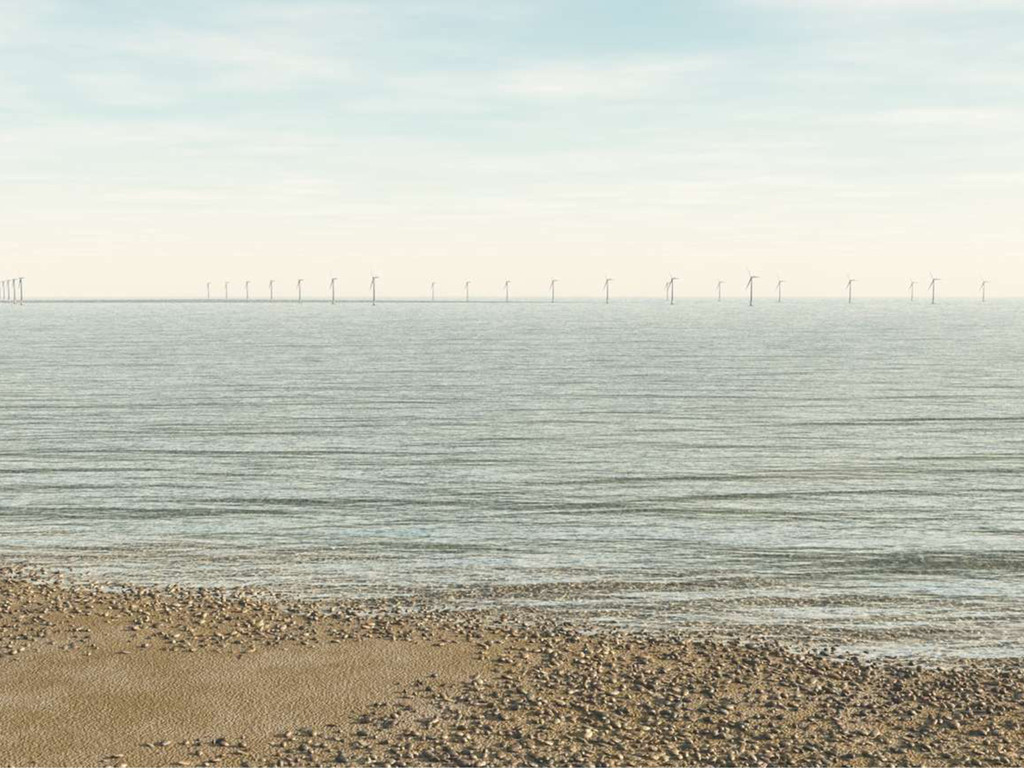
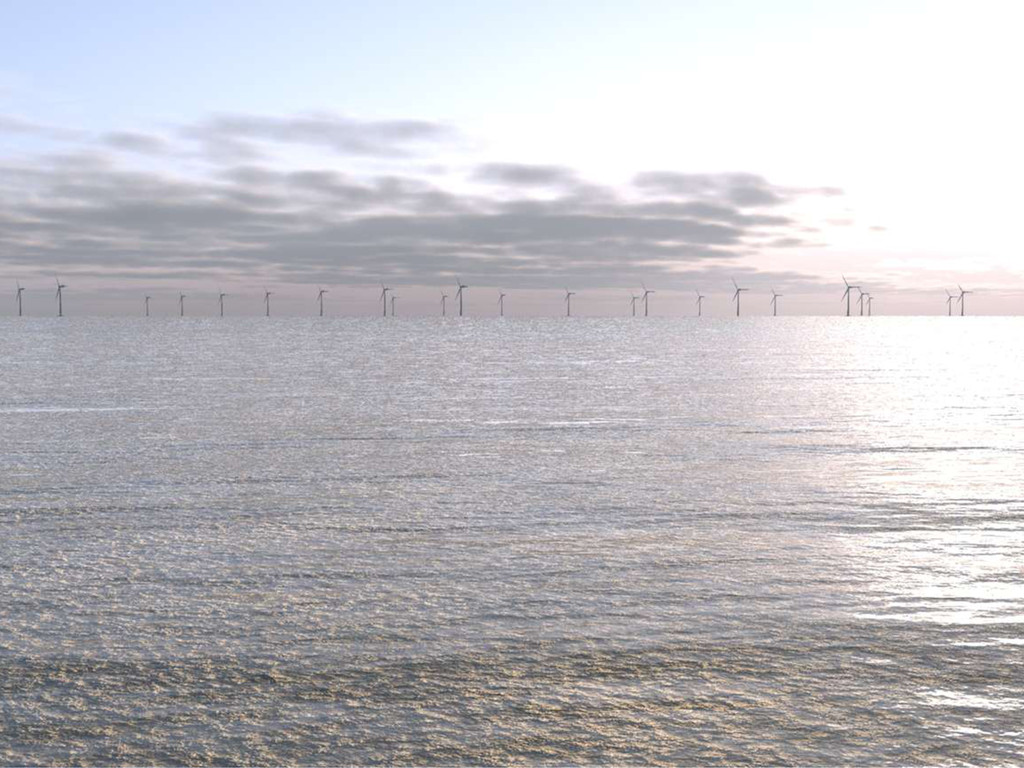
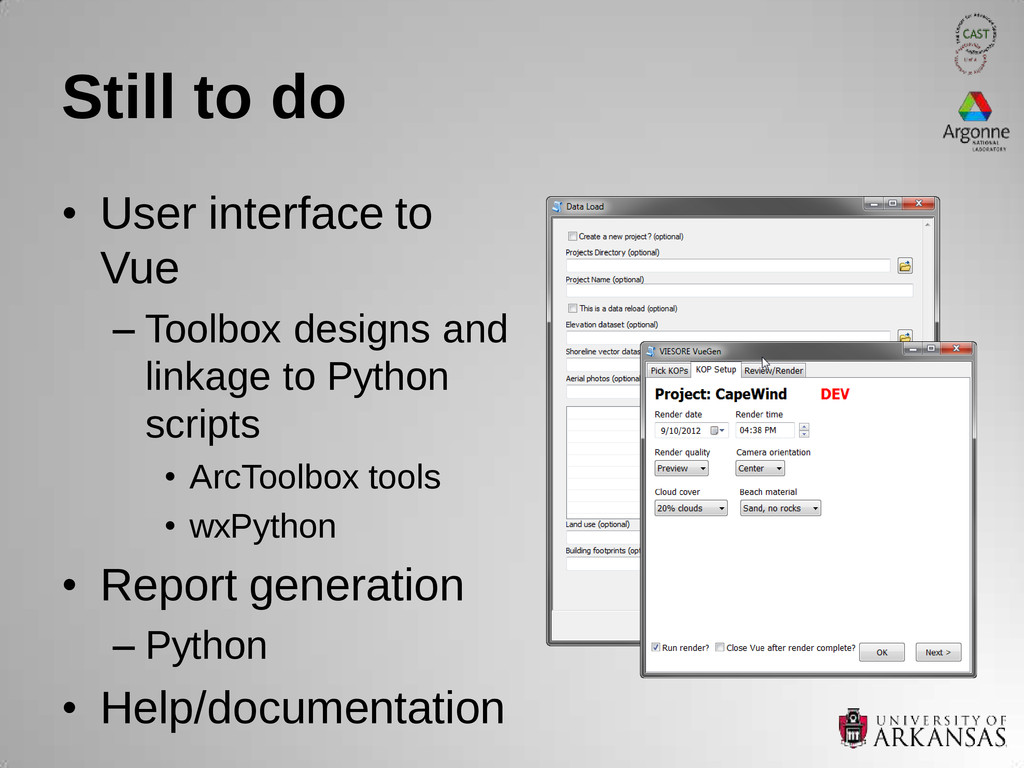
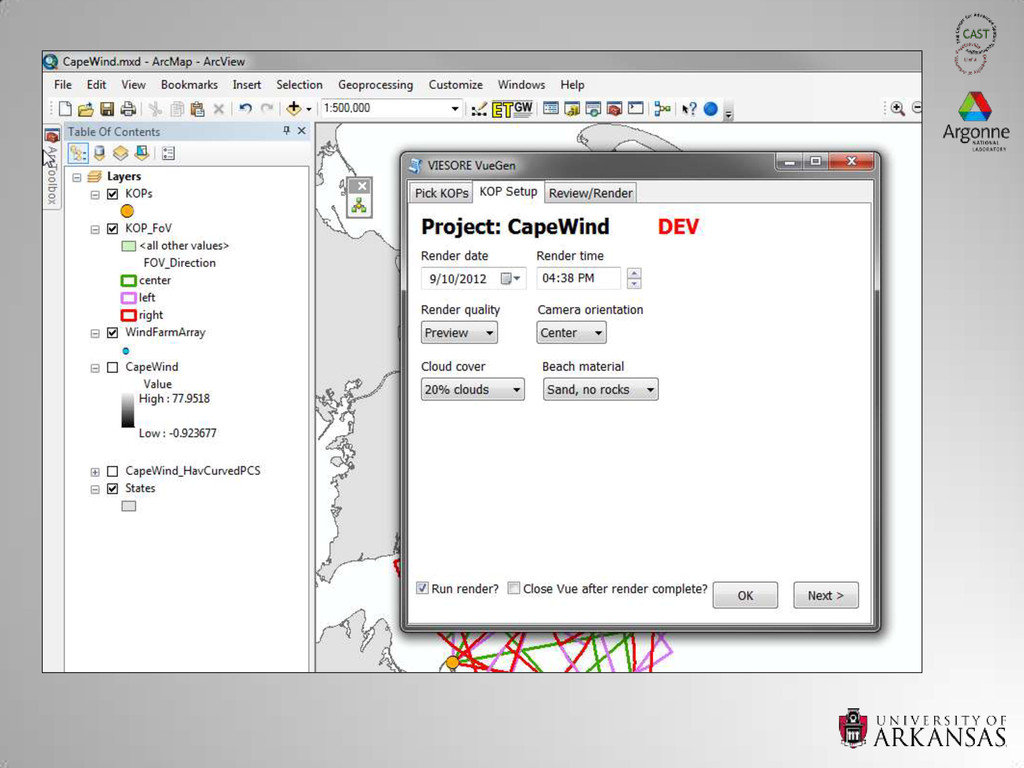
In the fall of 2010, the Bureau of Ocean Energy Management entered into an interagency agreement with the US Department of Energyís Argonne National Laboratories to sponsor the development of a geographic information system-based tool for creating spatially accurate and realistic visualizations of offshore wind facilities. The development of the Visual Impact Evaluation System of Offshore Renewable Energy (VIESORE) tool is a collaborative research effort between the Bureau, Argonne National Laboratories and the University of Arkansas. VIESORE is a ArcGIS 10.0 desktop-based application that allows a user to design the spatial layout of a facility; import, prepare, and process accurate GIS data for the study area; run a series of visual analyses; define atmospheric, lighting, and wave conditions; and then generate, through the 3D visualization software package Vue 10.5 Infinite, realistic visualizations of the proposed facility as it would be seen from any number of viewpoints defined by the user. Through VISEORE, BOEM staff will be able to verify the accuracy of visual impact simulations of offshore renewable energy facilities prepared by other parties; prepare simulations for use in public involvement activities; and rapidly develop simulations for in-house use to evaluate visual characteristics of hypothetical or proposed offshore renewable energy facilities.

Chad Cooper

September 25, 2012
Tweet

More Decks by Chad Cooper

Other Decks in Technology

Transcript

  1. VIESORE
    Visual Impact Evaluation System
    for Offshore Renewable Energy
    Chad Cooper, Snow Winters, Malcolm Williamson, Jackson
    Cothren
    Center for Advanced Spatial Technologies
    University of Arkansas, Fayetteville
    Robert Sullivan
    Argonne National Laboratory
    Argonne, Illinois

    View Slide

  2. Credits/disclaimer
    • funded by Bureau of Ocean Energy
    Management (BOEM)
    • on-going study
    • not meant to represent BOEM policy

    View Slide

  3. Offshore wind 101
    • First offshore wind farm – Denmark 1991
    • 2010 – 39 offshore farms off coasts of UK,
    Europe, and Scandinavia
    • Largest turbines now over 500 feet tall
    • Power carried to land via transmission
    cable
    • Wind energy contractors submit site
    proposals to governing bodies
    – Contractors provide photomontages

    View Slide

  4. Cape Wind
    www.capewind.org
    www.capewind.org
    Offshore windfarms coming to
    the U.S.

    View Slide

  5. Offshore windfarms coming to
    the U.S.
    Cape Wind
    www.capewind.org
    www.capewind.org

    View Slide

  6. ...and in come the proposals
    Bureau of Ocean Energy Management
    (BOEM) reviews all project proposals
    within federal waters
    • offshore oil and gas exploration
    • offshore wind
    • wave
    • tidal flow
    • ocean current
    • environmental laws and regulations

    View Slide

  7. Offshore wind 101 – Cape Wind
    • Siemens SWT 3.6-107
    – rotor diameter – 107m (351ft)
    – total turbine height – 132m (433ft)
    • 130 turbines arranged in a grid
    • 12.5 miles of transmission cable
    • partial generation planned for 2015

    View Slide

  8. View Slide

  9. BOEM system requirements
    The system must:
    • enable spatial design of offshore facility
    • import geospatial data
    • allow user control of atmospheric, lighting, wave
    conditions
    • generate spatially accurate and realistic visualizations
    • output reports and images
    • provide a user-friendly interface
    It shall enable users to:
    • evaluate photomontages in environmental impact
    statements (EISs)
    • independently assess proposed facilities

    View Slide

  10. Approach
    Photomontages
    Pros:
    • realistic
    • accepted
    • accurate*
    *dependent upon lens used
    Cons:
    • need photos from every potential point of interest
    – oops, we didn’t take a photo from there!
    • difficult to show different lighting/weather conditions
    • human error
    www.capewind.org

    View Slide

  11. Approach
    Photomontages
    Pros:
    • realistic
    • accepted
    • accurate*
    *dependent upon lens used
    Cons:
    • need photos from every potential point of interest
    – oops, we didn’t take a photo from there!
    • difficult to show different lighting/weather conditions
    • human error
    www.capewind.org

    View Slide

  12. Approach
    3D visualizations
    Pros:
    • CAST does 3D
    • photorealistic
    • Vue Python API
    Cons:
    • learning curve
    • you need horsepower
    • user interface is scary – no likey GIS data

    View Slide

  13. View Slide

  14. View Slide

  15. View Slide

  16. View Slide

  17. View Slide

  18. Approach
    3D visualizations via
    GIS interface
    Pros:
    • CAST does 3D
    • photorealistic
    • Vue Python API
    Cons:
    • user interface is scary
    • learning curve
    • you need horsepower, but affordable

    View Slide

  19. View Slide

  20. View Slide

  21. View Slide

  22. View Slide

  23. System design
    SHP
    ArcGIS 10.0
    script tools
    JPG
    Reports
    Renders
    Input data
    ArcGIS 10.0
    friendly interface
    Videos
    HMTL

    View Slide

  24. System design
    SHP
    ArcGIS 10.0
    script tools
    JPG
    Reports
    Renders
    Input data
    ArcGIS 10.0
    friendly interface
    Videos
    HMTL

    View Slide

  25. System design
    SHP
    ArcGIS 10.0
    script tools
    JPG
    Reports
    Renders
    Videos
    Input data
    ArcGIS 10.0
    friendly interface
    xml
    Log
    Log
    Log
    .vue
    xml
    template
    HMTL
    .atm
    .mat
    project

    View Slide

  26. Development to date
    • translate data for import into Vue
    – digital elevation
    – wind turbine generator (WTG) point locations
    – key observation points (KOPs)
    • import above data into Vue
    • move objects around as needed, adjust size
    • import 3D WTG model
    • set camera and sun position
    • render to jpeg

    View Slide

  27. Development to date
    • translate data for import into Vue
    – digital elevation
    – wind turbine (WTG) point locations
    – key observation points (KOPs)
    • import above data into Vue
    • move objects around as needed, adjust size
    • import 3D WTG model
    • set camera and sun position
    • render to jpeg

    View Slide

  28. Data translations

    View Slide

  29. View Slide

  30. View Slide

  31. View Slide

  32. View Slide

  33. Kitty Hawk, NC
    1/9 arc-second NED
    vertical accuracy +/- 1 meter

    View Slide

  34. View Slide

  35. Oregon coast
    1/9 arc-second NED
    vertical accuracy +/- 1 meter

    View Slide

  36. View Slide

  37. Key observation points
    A.K.A., the camera

    View Slide

  38. View Slide

  39. View Slide

  40. View Slide

  41. View Slide

  42. WTG placement

    View Slide

  43. View Slide

  44. View Slide

  45. Current results
    Real-world GIS data brought into Vue
    Photorealistic renderings
    User-friendly interface

    View Slide

  46. Current results
    Real-world GIS data brought into Vue
    Photorealistic renderings
    User-friendly interface

    View Slide

  47. Current results
    Real-world GIS data brought into Vue
    Photorealistic renderings
    User-friendly interface
    - still working on that...

    View Slide

  48. Renders

    View Slide

  49. View Slide

  50. View Slide

  51. View Slide

  52. Issues tackled
    • Vue data formats
    • Data translations galore
    • Using real-world data in software that
    wasn’t really made for it
    • Coarse-grained Vue Python API makes
    you come up with creative workarounds

    View Slide

  53. Still to do
    • User interface to
    Vue
    – Toolbox designs and
    linkage to Python
    scripts
    • ArcToolbox tools
    • wxPython
    • Report generation
    – Python
    • Help/documentation

    View Slide

  54. View Slide

  55. Questions?
    [email protected]
    http://cast.uark.edu

    View Slide