Cooper Center for Advanced Spatial Technologies University of Arkansas, Fayetteville http://cast.uark.edu |
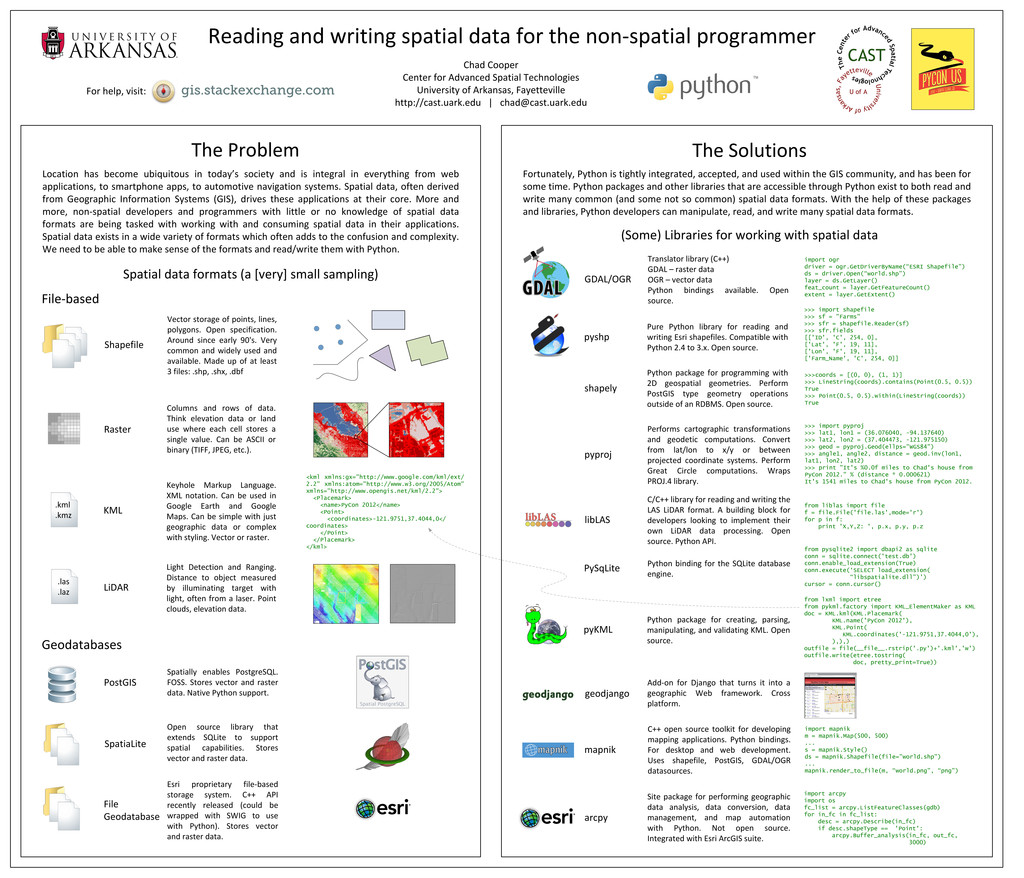
[email protected] Location has become ubiquitous in today’s society and is integral in everything from web applications, to smartphone apps, to automotive navigation systems. Spatial data, often derived from Geographic Information Systems (GIS), drives these applications at their core. More and more, non-spatial developers and programmers with little or no knowledge of spatial data formats are being tasked with working with and consuming spatial data in their applications. Spatial data exists in a wide variety of formats which often adds to the confusion and complexity. We need to be able to make sense of the formats and read/write them with Python. The Problem The Solutions Fortunately, Python is tightly integrated, accepted, and used within the GIS community, and has been for some time. Python packages and other libraries that are accessible through Python exist to both read and write many common (and some not so common) spatial data formats. With the help of these packages and libraries, Python developers can manipulate, read, and write many spatial data formats. Spatial data formats (a [very] small sampling) File-based Shapefile Raster KML LiDAR Geodatabases PostGIS File Geodatabase SpatiaLite Vector storage of points, lines, polygons. Open specification. Around since early 90's. Very common and widely used and available. Made up of at least 3 files: .shp, .shx, .dbf Columns and rows of data. Think elevation data or land use where each cell stores a single value. Can be ASCII or binary (TIFF, JPEG, etc.). Keyhole Markup Language. XML notation. Can be used in Google Earth and Google Maps. Can be simple with just geographic data or complex with styling. Vector or raster. Light Detection and Ranging. Distance to object measured by illuminating target with light, often from a laser. Point clouds, elevation data. <kml xmlns:gx="http://www.google.com/kml/ext/ 2.2" xmlns:atom="http://www.w3.org/2005/Atom" xmlns="http://www.opengis.net/kml/2.2"> <Placemark> <name>PyCon 2012</name> <Point> <coordinates>-121.9751,37.4044,0</ coordinates> </Point> </Placemark> </kml> Spatially enables PostgreSQL. FOSS. Stores vector and raster data. Native Python support. Open source library that extends SQLite to support spatial capabilities. Stores vector and raster data. Esri proprietary file-based storage system. C++ API recently released (could be wrapped with SWIG to use with Python). Stores vector and raster data. GDAL/OGR pyKML pyshp shapely geodjango mapnik arcpy pyproj libLAS (Some) Libraries for working with spatial data Translator library (C++) GDAL – raster data OGR – vector data Python bindings available. Open source. Pure Python library for reading and writing Esri shapefiles. Compatible with Python 2.4 to 3.x. Open source. Python package for programming with 2D geospatial geometries. Perform PostGIS type geometry operations outside of an RDBMS. Open source. Performs cartographic transformations and geodetic computations. Convert from lat/lon to x/y or between projected coordinate systems. Perform Great Circle computations. Wraps PROJ.4 library. C/C++ library for reading and writing the LAS LiDAR format. A building block for developers looking to implement their own LiDAR data processing. Open source. Python API. Python package for creating, parsing, manipulating, and validating KML. Open source. Add-on for Django that turns it into a geographic Web framework. Cross platform. C++ open source toolkit for developing mapping applications. Python bindings. For desktop and web development. Uses shapefile, PostGIS, GDAL/OGR datasources. Site package for performing geographic data analysis, data conversion, data management, and map automation with Python. Not open source. Integrated with Esri ArcGIS suite. >>> import shapefile >>> sf = "Farms" >>> sfr = shapefile.Reader(sf) >>> sfr.fields [['ID', 'C', 254, 0], ['Lat', 'F', 19, 11], ['Lon', 'F', 19, 11], ['Farm_Name', 'C', 254, 0]] >>>coords = [(0, 0), (1, 1)] >>> LineString(coords).contains(Point(0.5, 0.5)) True >>> Point(0.5, 0.5).within(LineString(coords)) True .kml .kmz .las .laz from liblas import file f = file.File('file.las',mode='r') for p in f: print 'X,Y,Z: ', p.x, p.y, p.z import mapnik m = mapnik.Map(500, 500) ... s = mapnik.Style() ds = mapnik.Shapefile(file=”world.shp”) ... mapnik.render_to_file(m, “world.png”, “png”) >>> import pyproj >>> lat1, lon1 = (36.076040, -94.137640) >>> lat2, lon2 = (37.404473, -121.975150) >>> geod = pyproj.Geod(ellps="WGS84") >>> angle1, angle2, distance = geod.inv(lon1, lat1, lon2, lat2) >>> print "It's %0.0f miles to Chad's house from PyCon 2012." % (distance * 0.000621) It's 1541 miles to Chad's house from PyCon 2012. from lxml import etree from pykml.factory import KML_ElementMaker as KML doc = KML.kml(KML.Placemark( KML.name('PyCon 2012'), KML.Point( KML.coordinates('-121.9751,37.4044,0'), ),),) outfile = file(__file__.rstrip('.py')+'.kml','w') outfile.write(etree.tostring( doc, pretty_print=True)) import arcpy import os fc_list = arcpy.ListFeatureClasses(gdb) for in_fc in fc_list: desc = arcpy.Describe(in_fc) if desc.shapeType == 'Point': arcpy.Buffer_analysis(in_fc, out_fc, 3000) import ogr driver = ogr.GetDriverByName(“ESRI Shapefile”) ds = driver.Open(“world.shp”) layer = ds.GetLayer() feat_count = layer.GetFeatureCount() extent = layer.GetExtent() For help, visit: PySqLite Python binding for the SQLite database engine. from pysqlite2 import dbapi2 as sqlite conn = sqlite.connect('test.db') conn.enable_load_extension(True) conn.execute(‘SELECT load_extension( “libspatialite.dll”)’) cursor = conn.cursor()