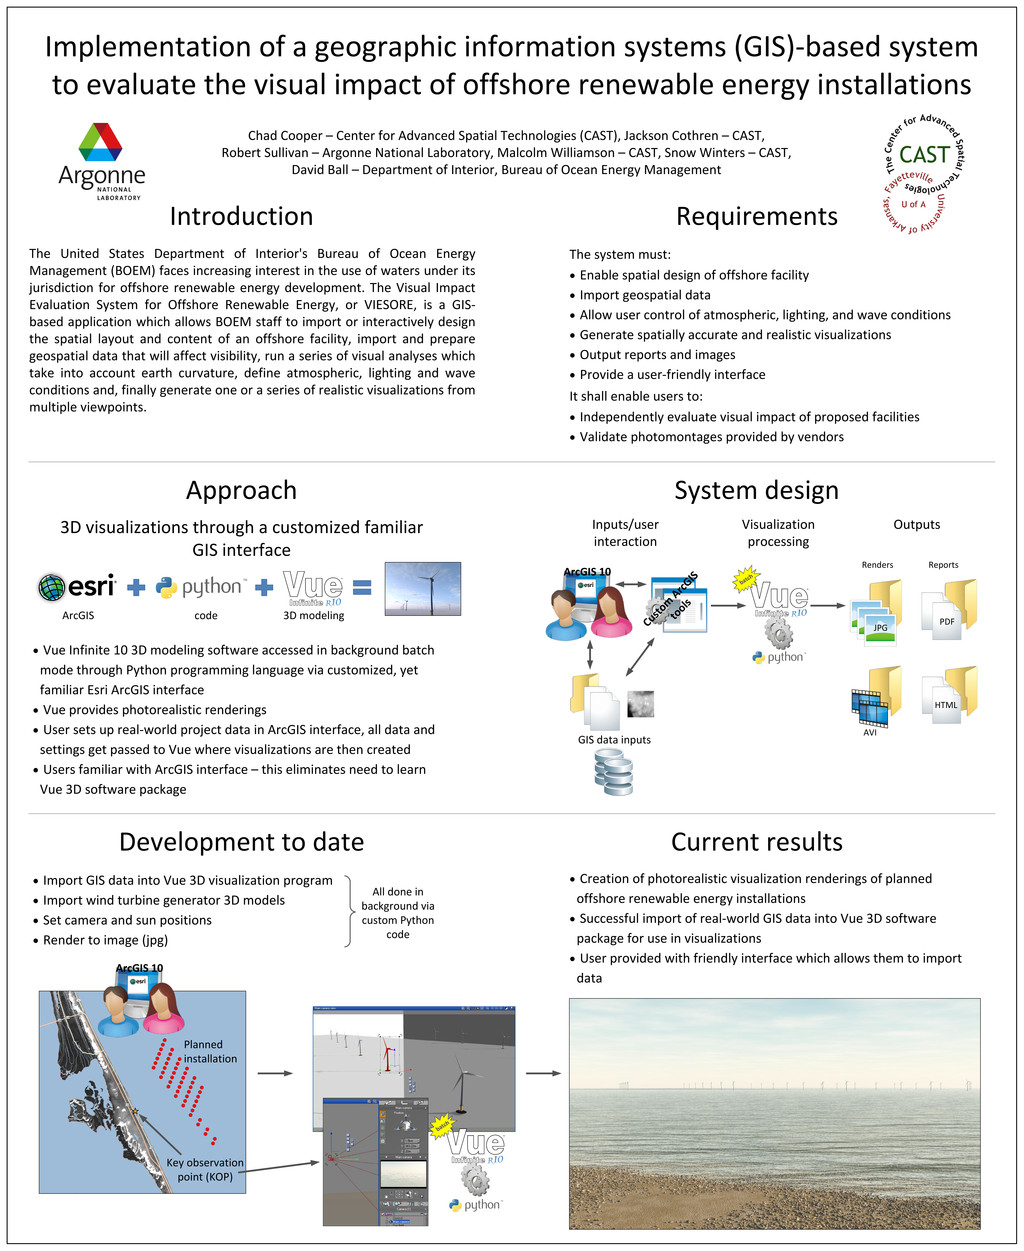
the visual impact of offshore renewable energy installations Chad Cooper – Center for Advanced Spatial Technologies (CAST), Jackson Cothren – CAST, Robert Sullivan – Argonne National Laboratory, Malcolm Williamson – CAST, Snow Winters – CAST, David Ball – Department of Interior, Bureau of Ocean Energy Management The United States Department of Interior's Bureau of Ocean Energy Management (BOEM) faces increasing interest in the use of waters under its jurisdiction for offshore renewable energy development. The Visual Impact Evaluation System for Offshore Renewable Energy, or VIESORE, is a GIS- based application which allows BOEM staff to import or interactively design the spatial layout and content of an offshore facility, import and prepare geospatial data that will affect visibility, run a series of visual analyses which take into account earth curvature, define atmospheric, lighting and wave conditions and, finally generate one or a series of realistic visualizations from multiple viewpoints. Introduction Requirements Approach System design Development to date Current results · Enable spatial design of offshore facility · Import geospatial data · Allow user control of atmospheric, lighting, and wave conditions · Generate spatially accurate and realistic visualizations · Output reports and images · Provide a user-friendly interface 3D visualizations through a customized familiar GIS interface Renders Reports AVI HTML · Vue Infinite 10 3D modeling software accessed in background batch mode through Python programming language via customized, yet familiar Esri ArcGIS interface · Vue provides photorealistic renderings · User sets up real-world project data in ArcGIS interface, all data and settings get passed to Vue where visualizations are then created · Users familiar with ArcGIS interface – this eliminates need to learn Vue 3D software package ArcGIS code 3D modeling Inputs/user interaction Visualization processing Outputs GIS data inputs Custom ArcGIS tools ArcGIS 10 · Import GIS data into Vue 3D visualization program · Import wind turbine generator 3D models · Set camera and sun positions · Render to image (jpg) All done in background via custom Python code · Creation of photorealistic visualization renderings of planned offshore renewable energy installations · Successful import of real-world GIS data into Vue 3D software package for use in visualizations · User provided with friendly interface which allows them to import data JPG Key observation point (KOP) Planned installation ArcGIS 10 PDF The system must: · Independently evaluate visual impact of proposed facilities · Validate photomontages provided by vendors It shall enable users to: