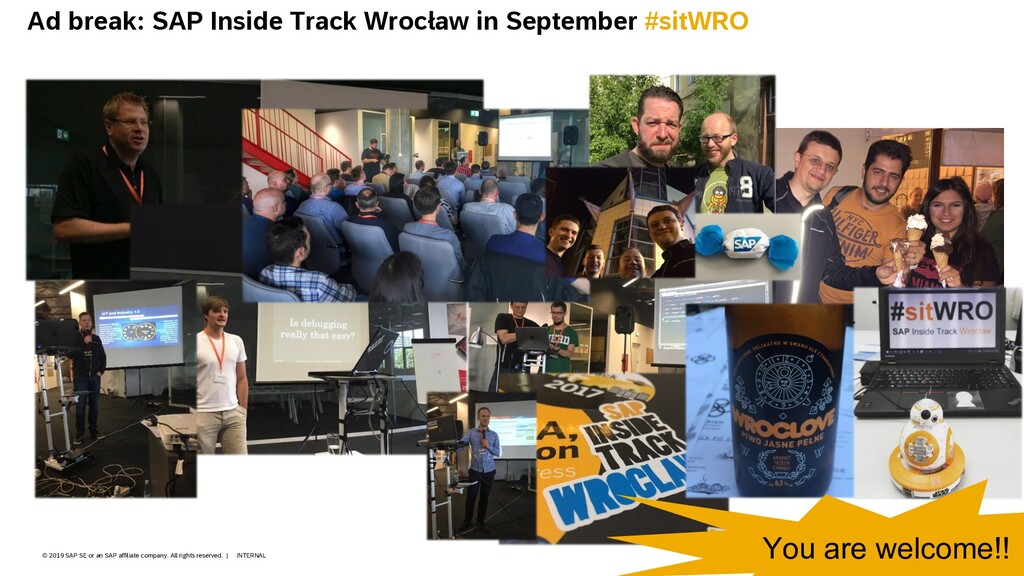
company. All rights reserved. ǀ Let me introduce myself - Віталій Рудницький aka Vitaliy Rudnytskiy, aka Witalij Rudnicki aka @Sygyzmundovych - SAP’s Developer Relations team - 12 years as a BI Technology Consultant - SAP Mentor 2010-2014 - Self-proclaimed King of Data Geeks J - Organizer of Wrocław’s SAP Community meetups and SIT - https://people.sap.com/vitaliy.rudnytskiy
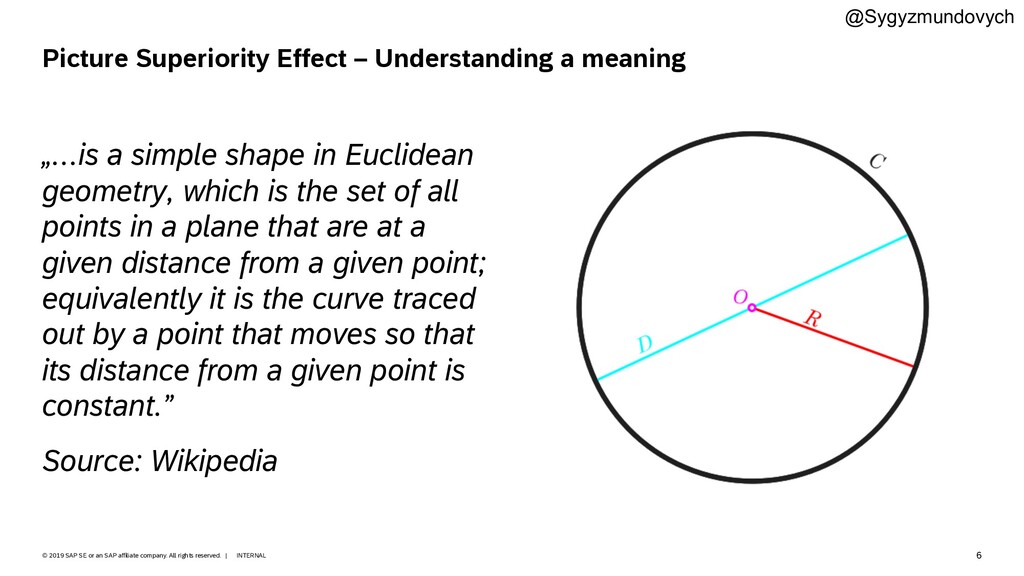
company. All rights reserved. ǀ Picture Superiority Effect – Understanding a meaning „…is a simple shape in Euclidean geometry, which is the set of all points in a plane that are at a given distance from a given point; equivalently it is the curve traced out by a point that moves so that its distance from a given point is constant.” Source: Wikipedia @Sygyzmundovych
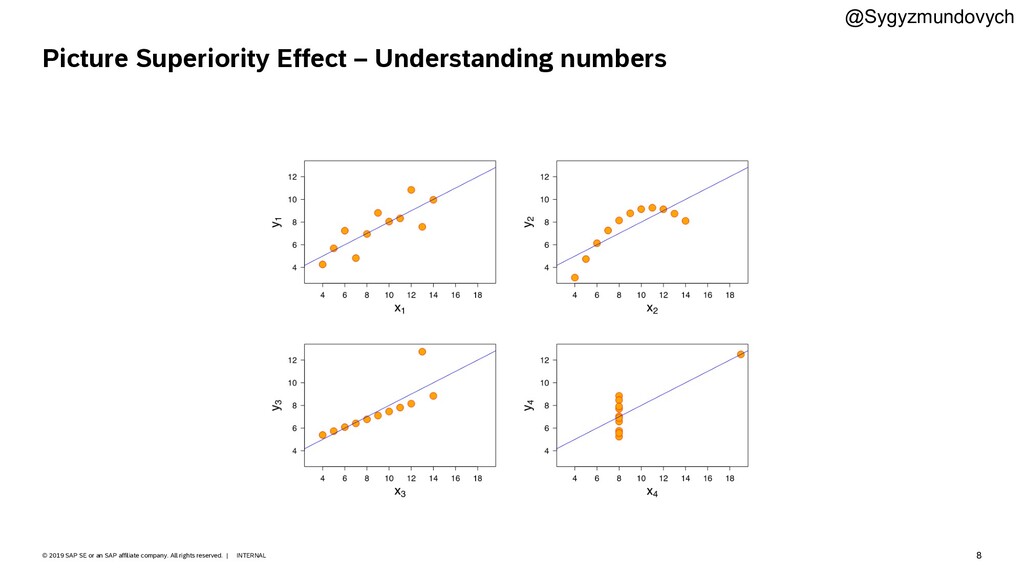
company. All rights reserved. ǀ Picture Superiority Effect – Understanding numbers I II III IV x y x y x y x y 10.0 8.04 10.0 9.14 10.0 7.46 8.0 6.58 8.0 6.95 8.0 8.14 8.0 6.77 8.0 5.76 13.0 7.58 13.0 8.74 13.0 12.74 8.0 7.71 9.0 8.81 9.0 8.77 9.0 7.11 8.0 8.84 11.0 8.33 11.0 9.26 11.0 7.81 8.0 8.47 14.0 9.96 14.0 8.10 14.0 8.84 8.0 7.04 6.0 7.24 6.0 6.13 6.0 6.08 8.0 5.25 4.0 4.26 4.0 3.10 4.0 5.39 19.0 12.50 12.0 10.84 12.0 9.13 12.0 8.15 8.0 5.56 7.0 4.82 7.0 7.26 7.0 6.42 8.0 7.91 5.0 5.68 5.0 4.74 5.0 5.73 8.0 6.89 Property Value Mean of x in each case 9 (exact) Sample variance of x in each case 11 (exact) Mean of y in each case 7.50 (to 2 decimal places) Sample variance of y in each case 4.122 or 4.127 (to 3 decimal places) Correlation between x and y in each case 0.816 (to 3 decimal places) Linear regression line in each case y = 3.00 + 0.500x (to 2 and 3 decimal places, respectively) http://en.wikipedia.org/wiki/Anscombe%27s_quartet @Sygyzmundovych
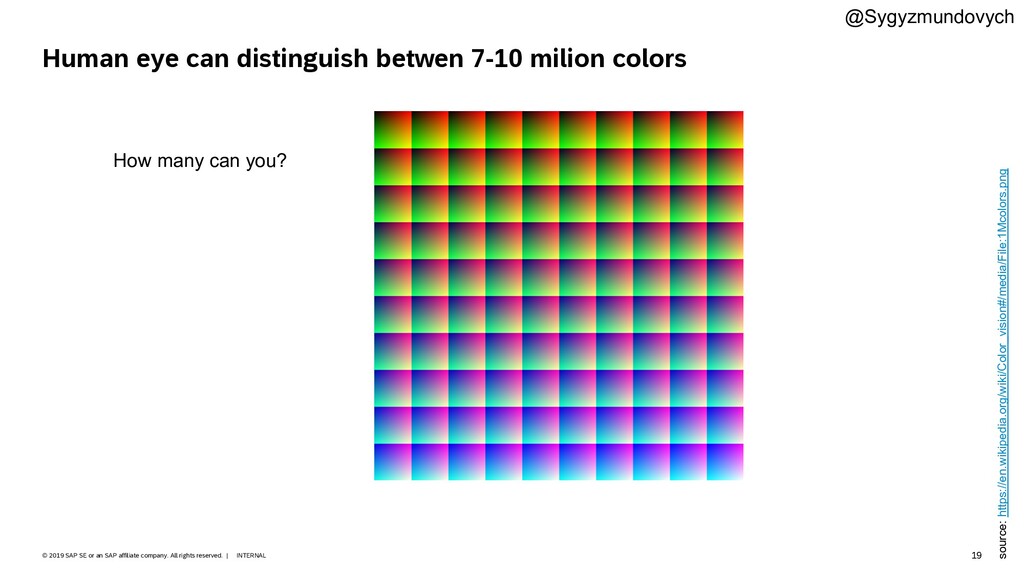
company. All rights reserved. ǀ Human eye can distinguish betwen 7-10 milion colors How many can you? source: https://en.wikipedia.org/wiki/Color_vision#/media/File:1Mcolors.png @Sygyzmundovych
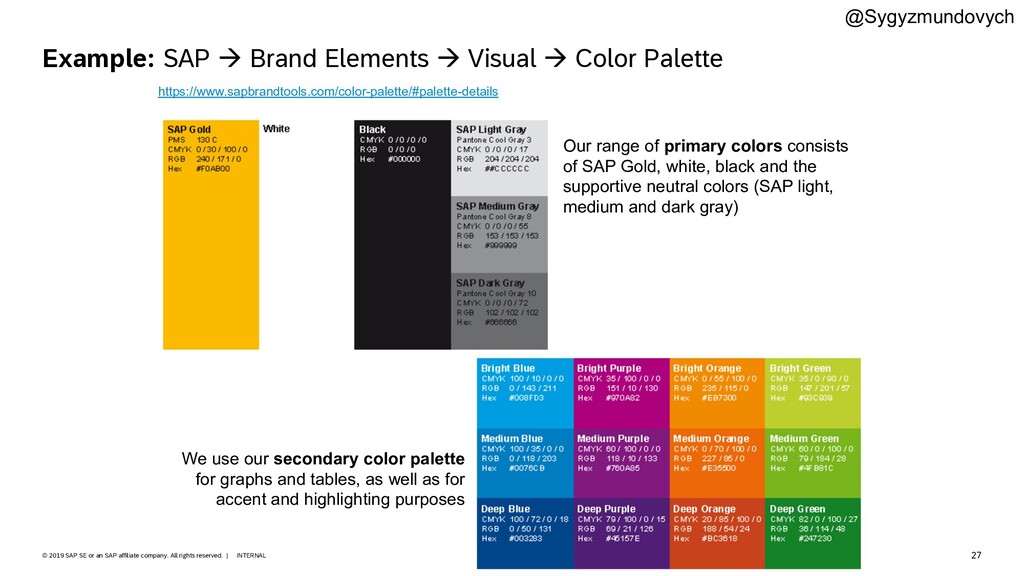
company. All rights reserved. ǀ Example: SAP à Brand Elements à Visual à Color Palette Our range of primary colors consists of SAP Gold, white, black and the supportive neutral colors (SAP light, medium and dark gray) We use our secondary color palette for graphs and tables, as well as for accent and highlighting purposes https://www.sapbrandtools.com/color-palette/#palette-details @Sygyzmundovych
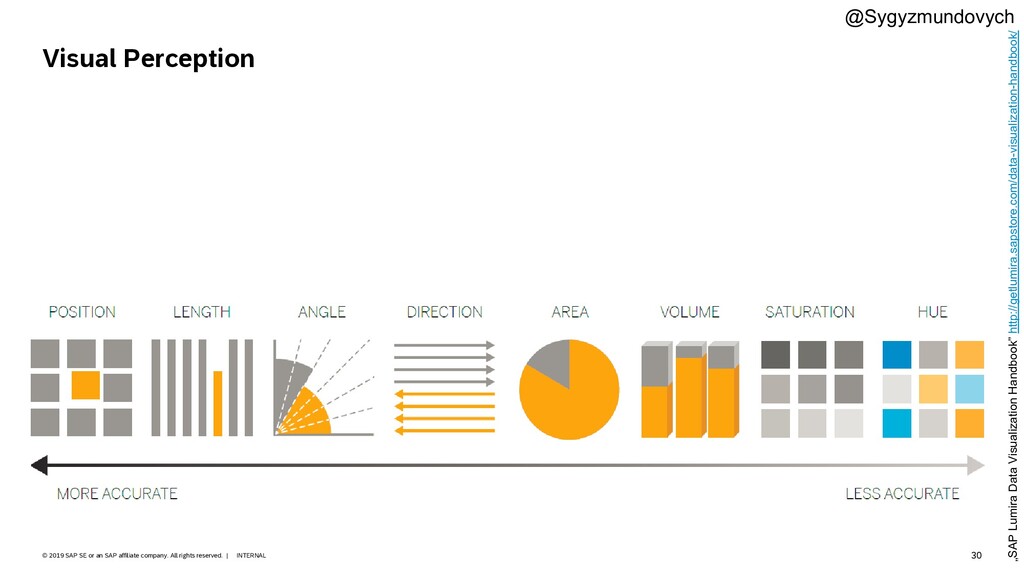
company. All rights reserved. ǀ Visual Perception „SAP Lumira Data Visualization Handbook” http://getlumira.sapstore.com/data-visualization-handbook/ @Sygyzmundovych
company. All rights reserved. ǀ Chart Picker Source: http://www.extremepresentation.typepad.com/blog/2008/06/visualization-taxonomies.html @Sygyzmundovych “…precise representation of the true data value…”
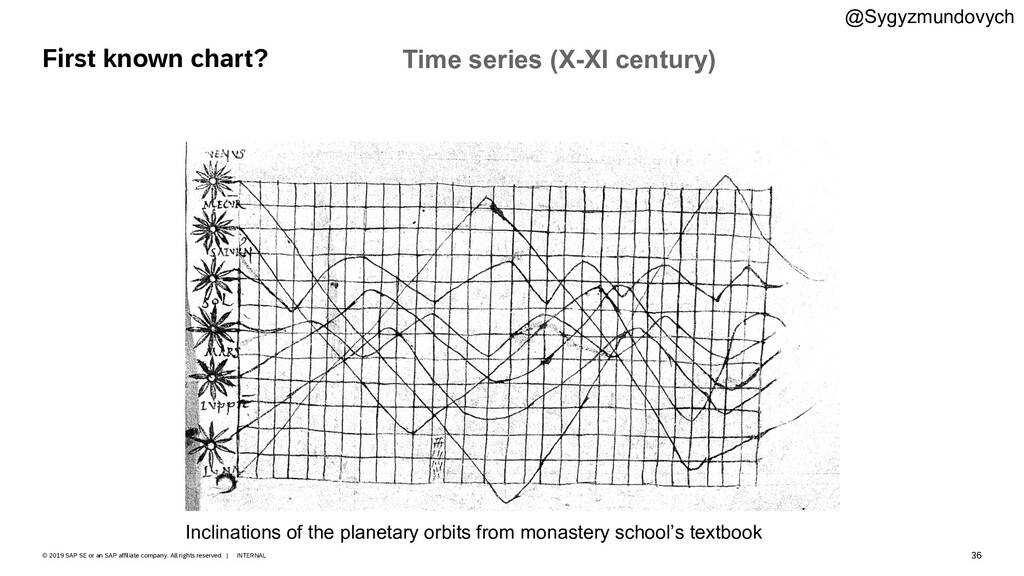
company. All rights reserved. ǀ First known chart? Inclinations of the planetary orbits from monastery school’s textbook Time series (X-XI century) @Sygyzmundovych
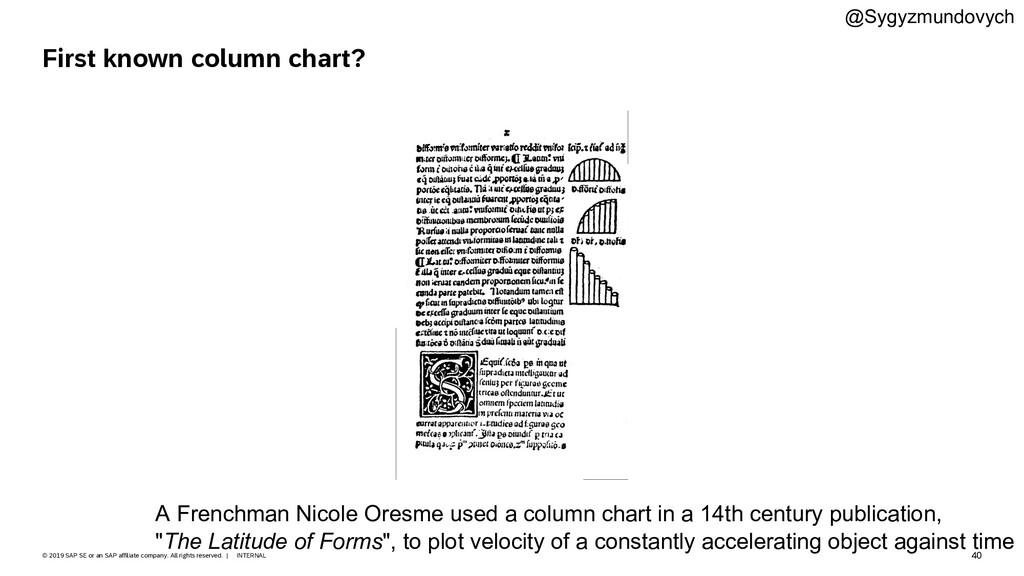
company. All rights reserved. ǀ First known column chart? A Frenchman Nicole Oresme used a column chart in a 14th century publication, "The Latitude of Forms", to plot velocity of a constantly accelerating object against time @Sygyzmundovych
company. All rights reserved. ǀ Introduction of Relational Graphics: neither Time nor Geo Apparently the first use of pie charts: The Statistical Breviary, by William Playfair, 1801 @Sygyzmundovych
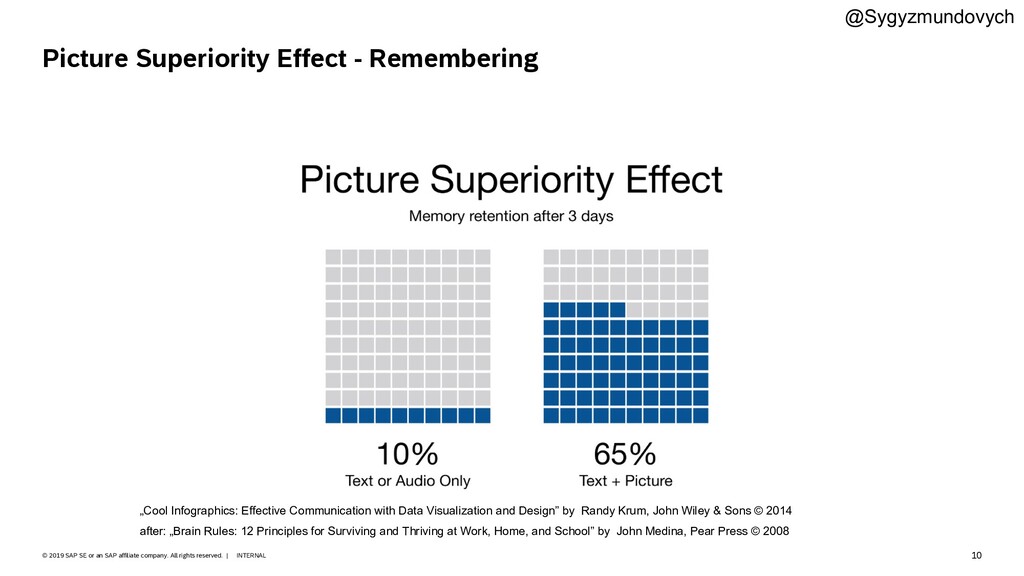
company. All rights reserved. ǀ The most famous geospatial chart @Sygyzmundovych Inspired by Picquet, Dr John Snow adopted the same principle to depict cholera deaths in Central London in 1854. source: http://en.wikipedia.org/wiki/Soho#Broad_Street_pump
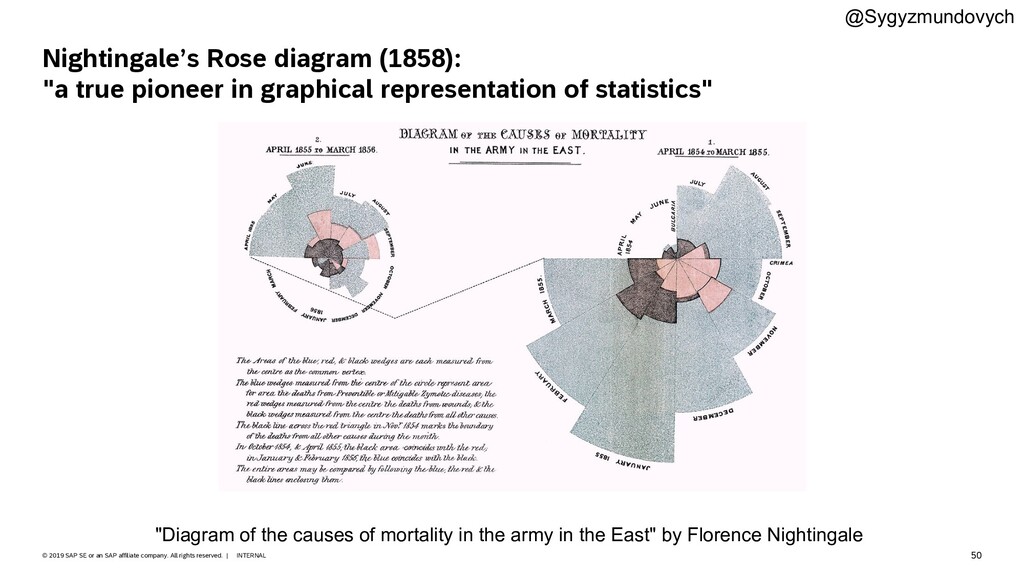
company. All rights reserved. ǀ Nightingale’s Rose diagram (1858): "a true pioneer in graphical representation of statistics" "Diagram of the causes of mortality in the army in the East" by Florence Nightingale @Sygyzmundovych
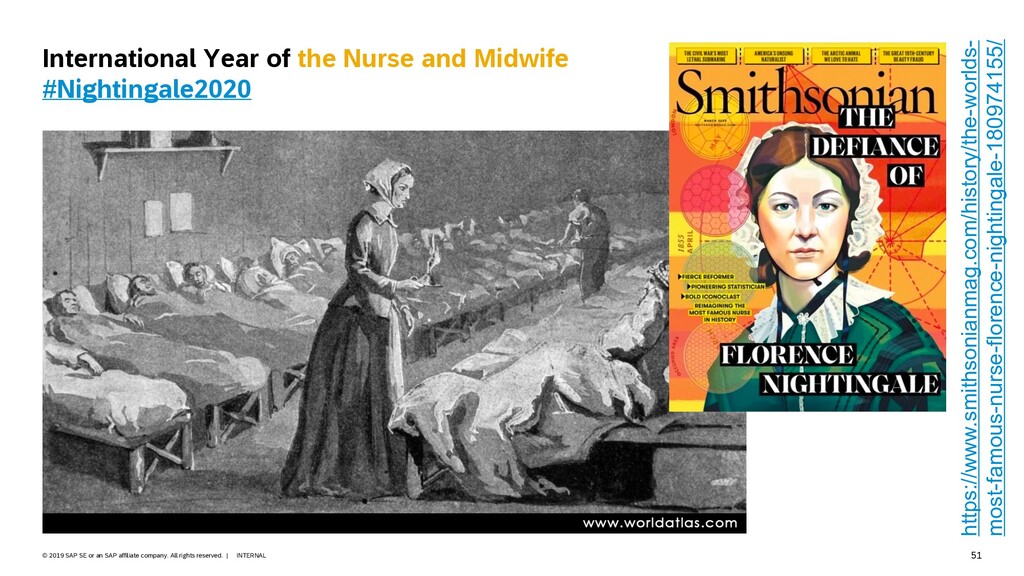
company. All rights reserved. ǀ International Year of the Nurse and Midwife #Nightingale2020 https://www.smithsonianmag.com/history/the-worlds- most-famous-nurse-florence-nightingale-180974155/
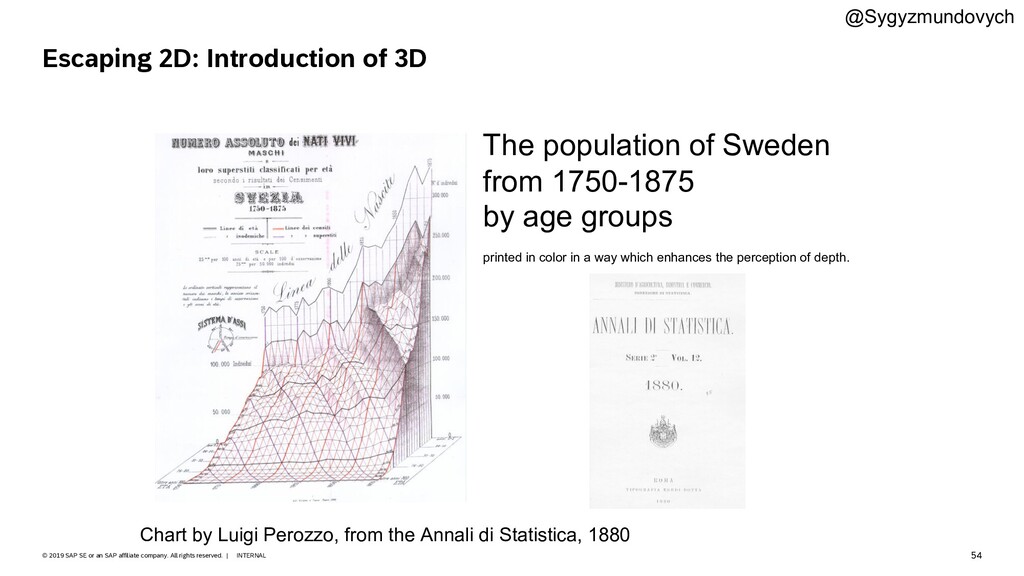
company. All rights reserved. ǀ Escaping 2D: Introduction of 3D Chart by Luigi Perozzo, from the Annali di Statistica, 1880 The population of Sweden from 1750-1875 by age groups printed in color in a way which enhances the perception of depth. @Sygyzmundovych
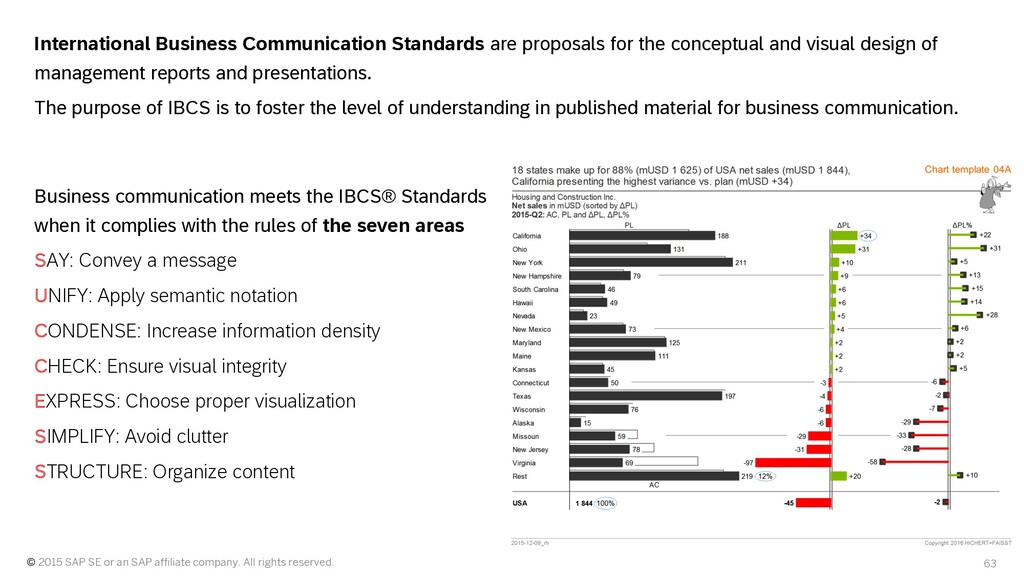
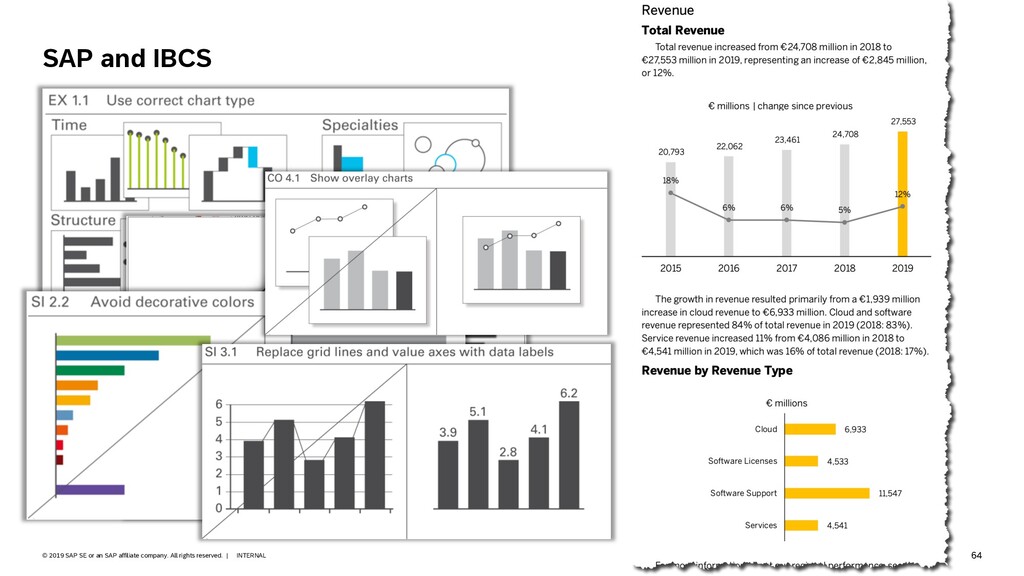
company. All rights reserved. ǀ Since 2013 the Creative Commons IBCS® project has been governed by the newly-founded IBCS Association. The further development of the IBCS® Standards is an ongoing process, which is managed by the not-for-profit IBCS Association. The International Business Communication Standards (IBCS®) are practical proposals for the design of reports, presentations, dashboards and the diagrams and tables contained therein. This involves the conception of the content, the visual perception and the application of a semantic notation.
All rights reserved. International Business Communication Standards are proposals for the conceptual and visual design of management reports and presentations. The purpose of IBCS is to foster the level of understanding in published material for business communication. Business communication meets the IBCS® Standards when it complies with the rules of the seven areas SAY: Convey a message UNIFY: Apply semantic notation CONDENSE: Increase information density CHECK: Ensure visual integrity EXPRESS: Choose proper visualization SIMPLIFY: Avoid clutter STRUCTURE: Organize content
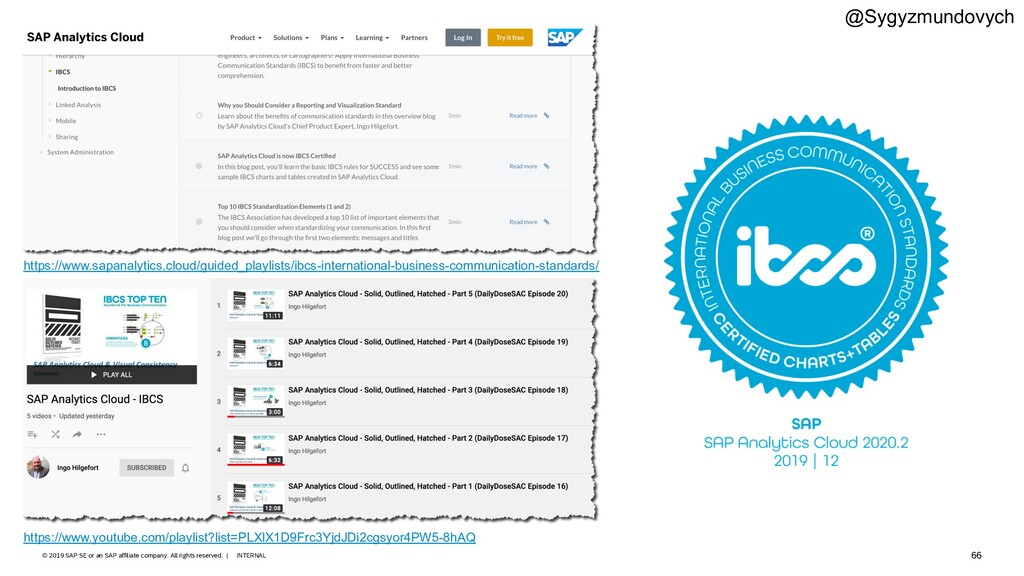
company. All rights reserved. ǀ https://www.youtube.com/playlist?list=PLXlX1D9Frc3YjdJDi2cgsyor4PW5-8hAQ https://www.sapanalytics.cloud/guided_playlists/ibcs-international-business-communication-standards/ @Sygyzmundovych
company. All rights reserved. ǀ Modelling (Schema) Data Collection Data Analysis Data Storytelling Data Collection Data Analysis Modelling Data Storytelling Traditional Data Analytics Exploratory Data Analysis @Sygyzmundovych
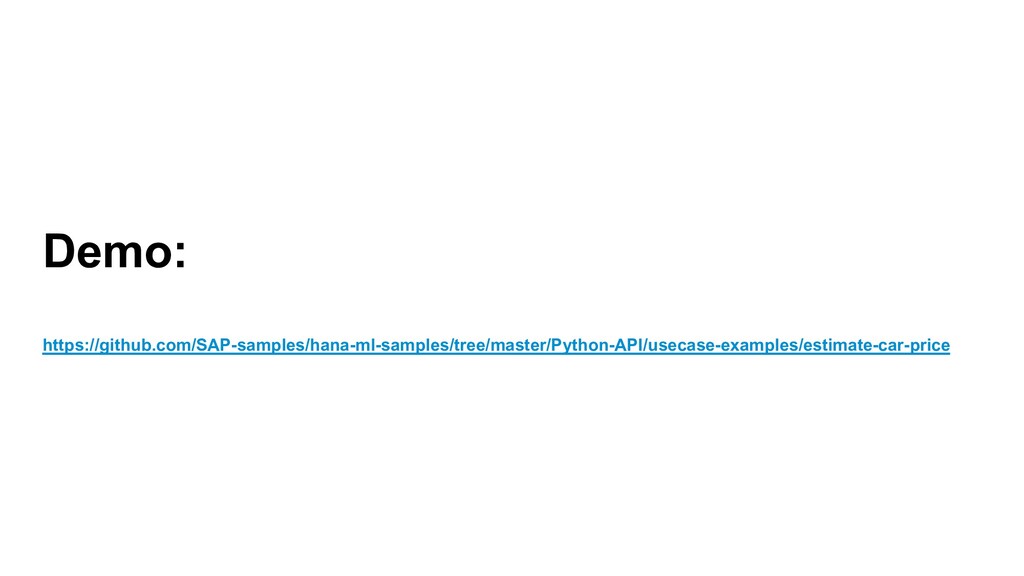